


Abstract
To examine if sleep symptomatology was associated with subjective cognitive concerns or objective cognitive performance in a dementia-free community-based sample.
A total of 1,421 middle-aged participants (mean ± standard deviation = 57 ± 7; 77% female) from the Healthy Brain Project completed the Pittsburgh Sleep Quality Index, Insomnia Severity Index, and Epworth Sleepiness Scale to measure sleep quality, insomnia symptom severity, and daytime sleepiness, respectively. Participants were classified as having no sleep symptomatology (normal scores on each sleep measure), moderate sleep symptomatology (abnormal scores on one sleep measure), or high sleep symptomatology (abnormal scores on at least two sleep measures), using established cutoff values. Analysis of covariance was used to compare objective cognitive function (Cogstate Brief Battery) and subjective cognitive concerns (Modified Cognitive Function Instrument) across groups.
Following adjustments for age, sex, education, mood, and vascular risk factors, persons classified as having high sleep symptomatology, versus none, displayed more subjective cognitive concerns (d = 0.24) but no differences in objective cognitive performance (d = 0.00–0.18). Subjective cognitive concerns modified the association between sleep symptomatology and psychomotor function. The strength of the relationship between high sleep symptomatology (versus none) and psychomotor function was significantly greater in persons with high as compared with low cognitive concerns (β ± SE = −0.37 ± 0.16; p = 0.02).
More severe sleep symptomatology was associated with greater subjective cognitive concerns. Persons reporting high levels of sleep symptomatology may be more likely to display poorer objective cognitive function in the presence of subjective cognitive concerns.
We observed that poorer self-reported sleep quality, insomnia symptom severity, and greater daytime sleepiness were associated with subjective cognitive concerns but not objective cognitive test performance in the whole sample. Persons reporting high levels of sleep symptomatology, versus none, displayed poorer objective cognitive function in the presence of high subjective cognitive concerns. Future research is needed to examine whether persons reporting severe sleep symptomatology and subjective cognitive concerns are at a higher risk of developing cognitive impairment.
Introduction
Patients with Alzheimer’s disease (AD) dementia commonly report poor sleep quality, daytime sleepiness, and symptoms of insomnia [1]. Although sleep dysfunction is a common symptom of dementia [2], sleep disturbances have also been linked to numerous processes that lead to dementia, including vascular brain injury [3], impaired memory consolidation [4], reduced glymphatic clearance [5], and greater amyloid-beta burden [6]. A growing evidence base also suggests that specific aspects of sleep may increase the risk of developing cognitive impairment [7–10]. Further investigating the nature and magnitude of relationships between sleep disturbance and cognitive impairment in non-demented older adults could increase understanding of the role of sleep in dementia, provide a basis for the assessment of sleep disturbance in dementia screening or case finding systems, and identify a target whose optimal management might reduce AD risk.
While polysomnography is the gold standard assessment for the identification of sleep disturbance in older individuals with and without AD, indices of sleep disturbance derived from self-report measures can be used more broadly and at lower cost while maintaining acceptable validity for identification of sleep disturbance [11–13]. Despite this, the nature and magnitude of the relationship between sleep disturbance, assessed using self-report measures, and cognitive impairment in individuals at risk for AD remains equivocal [7, 14–17], with inconsistent findings reported. In older adults, inconsistency in relationships between the severity of self-rated sleep disturbances and cognitive impairment may be because self-report sleep disturbance questionnaires are subject to recall bias and sleep state misperception, or because the different self-report measures used actually measure different dimensions of sleep disturbance. Sampling bias may also explain inconsistent findings as characteristics such as the age range studied [18], sex [19], depressed mood [20, 21], and carriage of the apolipoprotein E (APOE) ε4 allele [22], all of which can vary between samples, may have contributed to discrepant findings.
Therefore, one approach to understanding the relationship between sleep disturbance, determined from self-report, and dementia is to apply each of the most commonly used self-reported scales of sleep disturbance in a large sample of adults free from prodromal or clinically classified dementia, but who may be at risk of such diseases because of their age and family history of dementia, as well as by carriage of Apoe ε4 allele. In this large sample, central nervous system involvement can be quantified by measurement of cognition using tests shown to be sensitive to very early dementia. A large sample will then provide statistical power sufficient to detect subtle but meaningful relationships between sleep symptoms, dementia risk factors, and cognition.
Accordingly, we examined the association between self-reported sleep and cognitive function in a large community-based cohort of middle-aged dementia-free adults enriched for a first- or second-degree family history of dementia. We measured sleep symptomatology using self-rated scales that focused on sleep quality, excessive daytime sleepiness, and insomnia symptom severity. We hypothesized that greater sleep symptomatology would be associated with poorer objective cognitive function and greater subjective cognitive concerns. We also explored effect modification by factors that may differentially affect relationships between sleep and cognition: sex, ε4 status, depressive symptoms, and subjective cognitive concerns [19–22].
Methods
Participants
The sample comprised participants from the community-based Healthy Brain Project (HBP; healthybrainproject.org.au) [23]. The cohort comprised Australian residents, aged between 40 and 70 years, enriched with a first- or second-degree family history of dementia. Participants were without a diagnosis of AD or any other known diagnosis of dementia, a history of major neurological disease or insult (e.g. multiple sclerosis or severe traumatic brain injury), a diagnosis of a major psychiatric disorder (e.g. major depressive disorder), and use of medication approved by the Therapeutic Goods Administration for the treatment of AD or other dementia. Further details of the cohort have been published [23]. Participants were recruited via various media outlets (television, radio, and social media) and word of mouth.
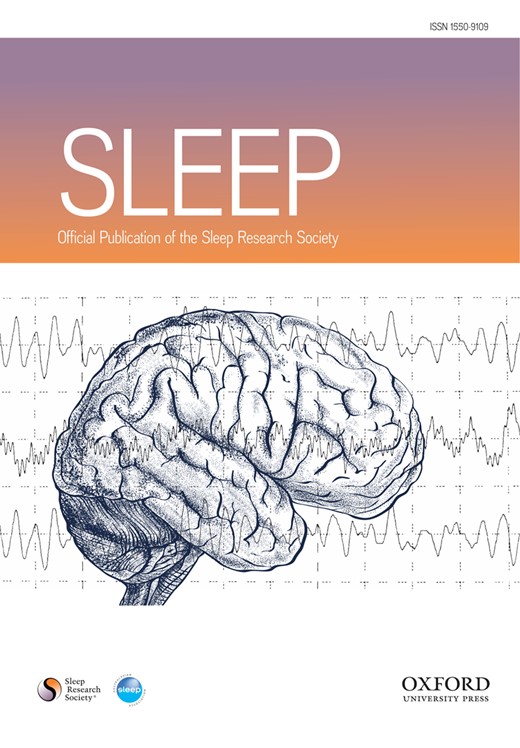
As participant recruitment is ongoing, this study utilizes data collected up until the third data freeze (April 2020), comprising 6,945 participants. Figure 1 displays the number of participants who were enrolled and who completed the sleep and cognitive assessments. As several of the sleep measures were introduced approximately 2 years after the study’s commencement, the number of participants available for analysis was lower than the overall enrollment numbers in the cohort. The final sample included 1,421 participants. The Melbourne Health Human Research Ethics Committee approved the study.
Study flow diagram. HBP, Healthy Brain Project; PSQI, Pittsburgh Sleep Quality Index; ESS, Epworth Sleepiness Scale; ISI, Insomnia Severity Index.
All measures were completed remotely via the HBP online platform, which has high usability, acceptability, and validity [23, 24]. Only data collected at the baseline assessment were included in this analysis.
Measures of sleep
Each sleep questionnaire used in this study is well-validated and commonly used in clinical and research settings [11–13].
Pittsburgh Sleep Quality Index
The Pittsburgh Sleep Quality Index (PSQI) is a 19-item questionnaire that measures self-reported sleep quality over the last month. The questionnaire comprises 4 free-text questions and 15 questions measured on a 4-point scale (responses range from 0 to 3). These questions make up seven components measuring the following: sleep quality, sleep latency, sleep duration, sleep efficiency, sleep disturbance, use of sleep medications, and daytime dysfunction. The components are summed to form a total score, ranging from 0 to 21, with higher scores indicating poorer sleep quality. PSQI scoring followed the guidelines of Buysse [17], with an extra question added to assess the amount of time in bed with responses used to calculate sleep efficiency. Following the original scale guidelines, we defined poor sleep quality as scores above 5 [25].
The Epworth Sleepiness Scale
The Epworth Sleepiness Scale (ESS) is an 8-item questionnaire that measures daytime sleepiness. Each item is scored on a 4-point scale (response range from 0 to 3) to examine the likelihood of falling asleep during eight different situations. The ESS was coded and scored on a continuous scale following published guidelines [18], with higher scores indicating higher levels of daytime sleepiness. In line with Johns and Hocking [26], we classified participants with scores of 11 or higher as exhibiting excessive daytime sleepiness.
The Insomnia Severity Scale
The Insomnia Severity Index (ISI) is a 7-item questionnaire that measures the severity of insomnia symptoms over 2 weeks, with each item scored on a 5-point scale (responses range from 0 to 4). The ISI was scored on a continuous scale with higher scores indicating more severe insomnia symptoms. Validated cut-off scores for insomnia detection vary from 8 to 14; we used an abnormal insomnia cutoff severity cutoff score of 8 or more, as utilized previously [27].
We performed an integrity check on the PSQI and only included participants who had valid responses on at least four of the seven components. Of those participants who completed the ISI and ESS, there were no missing data for each measure, respectively, since participants were forced to provide a response for each item.
Cognitive measures
Objective cognitive function—the Cogstate Brief Battery
The Cogstate Brief Battery (CBB) consisted of four tasks: Detection (DET), Identification (IDN), One-Card Learning (OCL), and One-Back (OBK). DET is a reaction time test that measures psychomotor function. IDN is a choice reaction time test measuring visual attention. The main outcome measure for DET and IDN was reaction time (milliseconds), normalized using a log10 transformation, with lower scores indicating faster response times. To aid in interpreting results, DET and IDN scores were reversed for analyses, such that higher scores indicated better performance on all measures. OCL is a visual recognition learning task, which assesses visual learning. OBK is a task of working memory and attention. The primary outcome measure for OCL and OBK was accuracy, normalized using an arcsine square-root transformation, with higher scores indicating more accurate responses. The CBB has been shown to reliably identify cognitive impairment in people at risk of AD [28–30], and is validated for remote assessment [24, 31]. Integrity checks were conducted on the CBB task scores, using established error criteria: less than 80% accuracy on the DET and IDN tasks, 50% accuracy on the OCL tasks, and 70% accuracy on the OBK tasks. Participants who did not pass error criteria on at least two of the CBB tasks were excluded from the analyses [24, 32, 33].
Subjective cognitive function—the modified Cognitive Function Instrument
We used a modified 15 questions version of the Cognitive Function Instrument (CFI) to measure each participant’s subjective experiences of their cognition [34]. The original instrument was developed to measure older adults’ subjective cognitive concerns without the need for an in-person interview [34]. We modified the CFI to be more appropriate for our middle-aged sample. Our version measured subjective experiences of thinking ability relating to work and other aspects of an individual’s life that may be more common in midlife as compared to old age [23]. As an illustrative example, the original version of the CFI included the following question: Do you need more help from others to remember appointments, family occasions or holidays? In comparison, a similar question asked in our modified version was: Have you noticed a decline in your ability to remember appointments, dates/times of family events and/or meeting times? Responses on our CFI ranged between 0 and 30, such that higher scores indicate more subjective concerns about one’s memory and thinking ability. We have included a copy of the modified CFI in our online supplementary material.
Demographic and health measures
The HBP also included questionnaires to measure key demographics variables including age, sex, years of education, body mass index (BMI), smoking status, history of diabetes, and history of hypertension. Mood was measured using the Hospital Anxiety and Depression Scale (HADS) [35].
APOE genotyping
Genotek Oragene (OG-500) 2mL saliva kits (including instructions on saliva collection) were mailed to participants who had completed at least 80% of all assessments on the online platform [23]. APOE genotype was determined through TaqMan genotyping assays (Life Technologies) for rs7412 (Assay ID: C____904973_10) and rs429358 (Assay ID: C___3084793_20) on a QuantStudio 12K-Flex real-time PCR system (Applied Biosystems) using the TaqMan GTXpress Master Mix (Life Technologies) methodology, per the manufacturer’s instructions.
Statistical methods
We created a novel variable to capture the overall severity of sleep symptomatology across several interrelated domains. Specifically, we classified participants with abnormal scores on the PSQI (total score >5), ESS (score >10), and ISI (score >7). We then allocated participants into one of the following groups:
a) “No sleep symptomatology” (i.e. normal scores on all three sleep questionnaires);
b) “Moderate sleep symptomatology” (i.e. abnormal scores on one sleep measure); and
c) “High sleep symptomatology” (i.e. abnormal scores on two or more sleep measures).
We performed a series of Analyses of Covariance (ANCOVAs) models to examine whether cognition differed between the levels of sleep symptomatology. In the presence of a significant main effect for sleep symptomatology, planned comparisons were used to compare outcome differences across groups, with the no sleep symptomology group used as the reference. Least square means were derived from all ANCOVA models.
All analyses were adjusted for the effects of age, sex, and years of education. We also performed a second statistical model, which included further adjustments for depression and anxiety symptom scores (using the HADS), BMI, smoking status, and self-reported history of diabetes and hypertension. These variables were selected to reduce confounding based on their known relationships with cognitive function [36, 37].
Sensitivity analyses
Since our sleep symptomatology variable was novel, we performed sensitivity analyses in which we sought to examine the independent associations of each sleep measure. We performed a series of multiple linear regressions with each continuous sleep measure (PSQI, ISI, and ESS) and each cognitive outcome examined separately.
Interactions
When predicting cognitive function, we examined the interactions between the sleep symptomatology variable and APOE ε4 status (ε4 carrier vs. non-ε4 carrier), sex (male vs. female), depressive symptoms (HADS scores > 7 vs. the remainder of the sample [38]), and subjective cognitive concerns (top quartile [most concerns] vs. the remainder of the sample). Interactions between sleep symptomatology and subjective cognitive concerns were only examined when objective cognitive function was the outcome. Interaction effects were investigated using multiple regression, adjusting for the covariates outlined in model 2.
The statistical significance for all main and interaction effects, and planned contrasts was set at p < 0.05. As these analyses were exploratory and aimed at generating new hypotheses, no p-value adjustments were made. In addition to testing statistical significance, we used least square means to calculate Cohen’s d in order to quantify the effect when comparing across levels of sleep symptomatology. All analyses were conducted using SPSS Statistical Software (version 25) and STATA (version 16). Missing data were excluded from analyses.
Results
Sample overview
Table 1 displays the demographic characteristics of the sample. Of the sample, 54% reported a first-degree family history of dementia. About 35% of participants had above threshold PSQI scores, 7% had above threshold ESS scores, and 30% had above threshold ISI scores. Compared to people with no sleep symptomatology, those with moderate or high sleep symptomatology were younger, had a higher BMI, were more likely to be women, and reported more depression and anxiety symptomatology. Correlations between the PSQI, ESS, and ISI and the distributions of these variables are shown in Supplementary Table S1 and Supplementary Figure S1, respectively.
Sample demographics stratified by the degree of sleep symptomatology
| Sleep symptomatology* | |||||
|---|---|---|---|---|---|
| Overall | None | Moderate | High | p | |
| Variable | (N = 1,413) | (n = 742) | (n = 351) | (n = 320) | |
| Age, years | 57.2 (7.1) | 57.5 (7.2) | 57.1 (7.3) | 56.6 (6.7) | 0.14 |
| BMI, kg/m2 | 26.4 (5.5) | 26.0 (4.9) | 26.6 (6.1) | 27.2 (6.1) | 0.008 |
| Education, years | 16.1 (3.4) | 16.2 (3.4) | 16.1 (3.4) | 15.7 (3.4) | 0.13 |
| Female, N (%) | 1,088 (77) | 564 (76) | 267 (77) | 257 (80) | 0.32 |
| Depressive symptoms, HADS score | 2.8 (2.5) | 2.1 (2.1) | 3.2 (2.7) | 3.9 (2.9) | <0.0001 |
| Anxiety symptoms, HADS score | 3.3 (3.0) | 2.5 (2.5) | 3.7 (2.9) | 4.8 (3.4) | <0.0001 |
| Current smoker, N (%) | 13 (1) | 4 (1) | 3 (1) | 6 (2) | 0.11 |
| History of type II diabetes, N (%) | 45 (3) | 22 (3) | 12 (3) | 11 (3) | 0.88 |
| Hypertension, N (%) | 269 (19) | 141 (19) | 57 (16) | 71 (22) | 0.14 |
| First-degree family history of dementia, N (%) | 764 (54) | 402 (54) | 185 (52) | 177 (55) | 0.79 |
| Second-degree family history of dementia, N (%) | 619 (44) | 320 (43) | 153 (44) | 146 (46) | 0.75 |
| APOE ε4 carrier, N (%)† | 250 (33) | 137 (35) | 68 (34) | 45 (29) | 0.40 |
| PSQI, global score | 5.0 (2.8) | 3.1 (1.4) | 5.9 (2.4) | 8.2 (2.3) | <0.0001 |
| ESS, total score | 5.0 (3.3) | 4.3 (2.6) | 5.3 (3.5) | 6.1 (3.9) | <0.0001 |
| ISI, total score | 5.3 (3.9) | 2.9 (2.1) | 6.1 (3.3) | 10.3 (2.2) | <0.0001 |
All values are presented as mean (SD) unless stated otherwise; chi-square tests were used to test differences between groups for categorical variables, and analysis of variance was used to test differences between groups for continuous variables. BMI, body mass index; HADS, Hospital Anxiety and Depression Scale; PSQI, Pittsburgh Sleep Quality Index; ESS, Epworth Sleepiness Scale; ISI, Insomnia Severity Index.
*None, normal scores on the PSQI, ISI, and ESS; Moderate, abnormal sleep on one of the sleep questionnaires; High, abnormal sleep on at least two of the three sleep questionnaires.
†Sample size with known APOE status = 754.
Association between sleep symptomatology and cognitive function
After adjusting for demographic variables, individuals with moderate sleep symptomatology displayed greater subjective cognitive concerns when compared to individuals with no sleep symptomatology, but the difference in effect was small (Table 2). Participants with high sleep symptomatology also reported greater subjective cognitive concerns when compared to individuals with no sleep symptomatology; the magnitude of the difference was moderate. Following additional adjustments for mood and vascular risk factors (model 2), individuals with high sleep symptomatology remained significantly more likely to report greater subjective cognitive concerns when compared to individuals without sleep symptomatology, but the magnitude of difference between groups reduced from moderate (model 1) to small (model 2). Sleep symptomatology was not associated with objective cognitive performance in either statistical model.
Differences in subjective and objective cognition across levels of sleep symptomatology
| Sleep symptomatology estimated marginal mean (SE)* | ANCOVA | No versus moderate sleep symptomatology | No versus high sleep symptomatology | |||||||
|---|---|---|---|---|---|---|---|---|---|---|
| Overall | None | Moderate | High | F | p | Cohen’s d (95% CI) | p | Cohen’s d (95% CI) | p | |
| Model 1† | N = 1,351 | n = 711 | n = 337 | n = 303 | ||||||
| DET | 1.52 (0.002) | 1.52 (0.003) | 1.52 (0.004) | 1.52 (0.005) | 0.21 | 0.81 | 0.00 [−0.13, 0.13] | – | 0.00 [−0.13, 0.13] | – |
| IDN | 1.41 (0.002) | 1.42 (0.002) | 1.41 (0.003) | 1.41 (0.004) | 0.39 | 0.68 | 0.19 [0.06, 0.32] | – | 0.18 [0.04, 0.31] | – |
| OCL | 1.00 (0.003) | 1.01 (0.004) | 1.00 (0.006) | 0.99 (0.006) | 2.04 | 0.13 | 0.09 [−0.04,0.22] | – | 0.19 [0.05, 0.32] | – |
| OBK | 1.39 (0.004) | 1.39 (0.005) | 1.40 (0.008) | 1.39 (0.008) | 0.35 | 0.71 | 0.07 [−0.06, 0.20] | – | 0.00 [−0.13, 0.13] | – |
| CFI | 5.62 (0.16) | 4.45 (0.20) | 5.35 (0.30) | 7.06 (0.32) | 24.31 | <0.0001 | 0.17 [0.04, 0.30] | 0.01 | 0.48 [0.35, 0.62] | <0.001 |
| Model 2‡ | N = 1,293 | n = 675 | n = 327 | n = 291 | ||||||
| DET | 1.52 (0.002) | 1.52 (0.003) | 1.52 (0.005) | 1.52 (0.005) | 0.07 | 0.94 | 0.00 [−0.13, 0.13] | – | 0.00 [−0.14, 0.14] | – |
| IDN | 1.41 (0.002) | 1.41 (0.002) | 1.41 (0.003) | 1.42 (0.004) | 0.09 | 0.91 | 0.00 [−0.13, 0.13] | – | 0.18 [0.04, 0.31] | – |
| OCL | 1.00 (0.003) | 1.00 (0.004) | 0.99 (0.006) | 1.00 (0.006) | 0.86 | 0.43 | 0.10 [−0.04, 0.23] | – | 0.00 [−0.14, 0.14] | – |
| OBK | 1.39 (0.004) | 1.39 (0.006) | 1.40 (0.008) | 1.39 (0.009) | 0.40 | 0.67 | 0.07 [−0.06, 0.20] | – | 0.07 [−0.14, 0.14] | – |
| CFI | 5.35 (0.15) | 4.91 (0.20) | 5.01 (0.28) | 6.14 (0.31) | 5.67 | 0.004 | 0.02 [−0.11, 0.15] | 0.77 | 0.24 [0.10, 0.37] | <0.001 |
Boldface denotes that results are significant at p<0.05
*None, normal scores on the PSQI, ISI, and ESS; Moderate, abnormal sleep on one of three sleep questionnaires; High, abnormal sleep on at least two of the three sleep questionnaires. Means are estimated with covariates held at the average sample value. The largest analysis sample sizes are reported. The sample sizes for the CFI were 1,257, 670, 310, 277 in Model 1 and 1,200, 635, 300, 265 in Model 2. DET, The Detection task speed (reverse coded); IDN, The Identification task speed (reverse coded); OCL, The One-Card Learning task accuracy; OBK, The One-back task accuracy; CFI, Cognitive Function Instrument.
†Adjusts for age, sex, education.
‡Adjusts for age, sex, education, depression, anxiety, BMI, smoking, diabetes, and hypertension.
Sensitivity analysis—associations of sleep quality, daytime sleepiness, and insomnia symptoms with cognitive function
Higher scores on the PSQI, ESS, and ISI were each individually related to higher scores on the CFI (Table 3), indicating more subjective cognitive concerns. Scores on each sleep measure were not associated with any objective measure of cognition. This pattern of results was consistent with the earlier set of analyses using levels of overall sleep symptomatology as the independent variable, suggesting that no one questionnaire drove the association between sleep symptomatology and subjective cognitive concerns.
Linear associations of poor sleep quality, excessive daytime sleepiness, and insomnia symptom severity with objective cognition function and subjective cognitive concerns
| DET | IDN | OCL | OBK | CFI | ||||||
|---|---|---|---|---|---|---|---|---|---|---|
| Variable | β (SE) | p | β (SE) | p | β (SE) | p | β (SE) | p | β (SE) | p |
| Model 1* | ||||||||||
| PSQI | −0.01 (0.02) | 0.62 | −0.02 (0.03) | 0.53 | −0.05 (0.02) | 0.08 | −0.04 (0.03) | 0.17 | 0.19 (0.03) | <0.0001 |
| ESS | −0.04 (0.03) | 0.11 | −0.05 (0.03) | 0.06 | 0.03 (0.03) | 0.35 | −0.03 (0.03) | 0.22 | 0.14 (0.03) | <0.0001 |
| ISI | −0.00 (0.03) | 0.72 | −0.01 (0.03) | 0.65 | −0.04 (0.03) | 0.14 | −0.02 (0.03) | 0.49 | 0.17 (0.03) | <0.0001 |
| Model 2† | ||||||||||
| PSQI | 0.01 (0.03) | 0.82 | 0.02 (0.03) | 0.44 | −0.01 (0.03) | 0.78 | −0.01 (0.03) | 0.85 | 0.08 (0.03) | 0.003 |
| ESS | −0.03 (0.03) | 0.26 | −0.04 (0.03) | 0.18 | 0.03 (0.03) | 0.32 | −0.03 (0.03) | 0.25 | 0.09 (0.03) | 0.001 |
| ISI | 0.01 (0.03) | 0.71 | 0.01 (0.03) | 0.66 | −0.02 (0.03) | 0.44 | 0.01 (0.03) | 0.79 | 0.07 (0.03) | 0.01 |
For these analyses, all sleep scores and cognitive outcomes are measured on a continuous scale. BMI, body mass index; PSQI, Pittsburgh Sleep Quality Index; ESS, Epworth Sleepiness Scale; ISI, Insomnia Severity Scale; DET, The Detection task speed; IDN, The Identification task speed; OCL, The One-Card Learning task accuracy; OBK, The One-back task accuracy; CFI, Cognitive Function Instrument. Standardized regression coefficients are presented. Scores on the DET and IDN tasks are reverse coded such that higher scores indicate better performance. Higher scores on the OCL and OBK tasks indicate more accurate responses. Higher scores on the CFI indicate more subjective concerns. Boldface denotes that results are significant at p<0.05
*Adjusts for age, sex, education (N = 1,351).
†Adjusts for age, sex, education, depression, anxiety, BMI, smoking, diabetes, and hypertension (N = 1,293).
Interactions with APOE ε4, sex, depressive symptoms, and subjective cognitive concerns
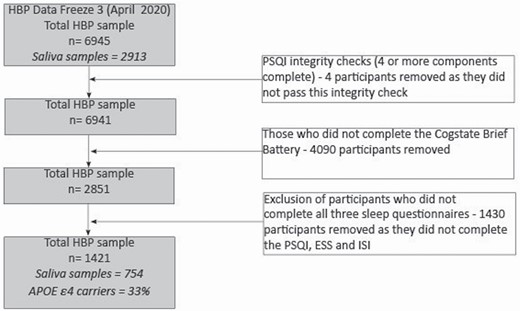
Differences in subjective cognitive concerns (high concerns [top quartile] vs. the remainder of the sample) modified the effect of sleep symptomatology on psychomotor function as measured by DET task scores (omnibus variable level test for interaction F(df) = 3.12 (2, 1,185), p = 0.045; Figure 2). The effect of high sleep symptomatology (versus none) on psychomotor function was significantly greater in persons with high as compared with low cognitive concerns (β ± SE = −0.03 ± 0.01; p = 0.02). The stratified analysis for this significant moderating effect is shown in Table 4. In participants with high subjective cognitive concerns, high sleep symptomatology (vs. none) was associated with poorer psychomotor function; the effect size was moderate. There was no association between sleep symptomatology (high vs. none) and psychomotor function in participants with less severe subjective cognitive concerns. The effect of moderate sleep symptomatology (versus none) on psychomotor function was not modified by subjective cognitive concerns (β ± SE = −0.02 ± 0.01; p = 0.10). No other significant interaction effects were observed (Supplementary Table S2).
![Moderating effect of subjective cognitive concerns (top quintile [high concerns] vs. the bottom 3 [low concerns]) on the relationship between sleep symptomatology and detection speed scores. Higher detection speed scores indicate superior psychomotor function. The model adjusts for age, sex, education, depressive symptoms, anxiety symptoms, BMI, smoking, diabetes, and hypertension. No sleep symptomatology, normal scores on the PSQI, ISI, and ESS; Moderate sleep symptomatology, abnormal sleep on one of three sleep questionnaires; High sleep symptomatology, abnormal sleep on at least two of the three sleep questionnaires.](https://oup.silverchair-cdn.com/oup/backfile/Content_public/Journal/sleep/44/9/10.1093_sleep_zsab097/2/m_zsab097_fig2.jpeg?Expires=1716427544&Signature=wT0p6q6NyrcAPNHNZ9Zqe~ocTZ7nrBQQQkE4poAfK2O9RfaZCX08fnxAZi1xsRYf8wKth3na5LjinJJUUxanlp83DEqzy5LUE7Fp--JzVSLrn-6ngQnoGZJUDveiic1voi4BUdF3XFYTt7YW9stOLRtBukDssHYplJrwVkXJapfC9fJT6-X6~4iAuWJGpxY1bpCp~cheQPgKzuRnzm-13-7FBCk2CzYTR2u1TFZDzApXrpilXVxhI~iHbmMWgFXKt-yoMzQPYwKW4arxepf8BvnDy3GpcbL~C5pj8pC00Nu4O1IcsZSZbNql1k0XIKmqTnlozUptfCTx2XaRRI6UCA__&Key-Pair-Id=APKAIE5G5CRDK6RD3PGA)
Moderating effect of subjective cognitive concerns (top quintile [high concerns] vs. the bottom 3 [low concerns]) on the relationship between sleep symptomatology and detection speed scores. Higher detection speed scores indicate superior psychomotor function. The model adjusts for age, sex, education, depressive symptoms, anxiety symptoms, BMI, smoking, diabetes, and hypertension. No sleep symptomatology, normal scores on the PSQI, ISI, and ESS; Moderate sleep symptomatology, abnormal sleep on one of three sleep questionnaires; High sleep symptomatology, abnormal sleep on at least two of the three sleep questionnaires.
Stratified results (high subjective cognitive concerns versus the remainder of the sample) for the significant subgroup interaction effect between high sleep symptomology (vs. none) and detection speed scores
| Detection speed estimated marginal mean (SE)* | Cohen’s d (95% CI) | p | ||
|---|---|---|---|---|
| Subjective cognitive concerns | No sleep symptomatology | High sleep symptomatology | ||
| High (top CFI quartile) | n = 114 | n = 86 | ||
| 1.524 (0.008) | 1.493 (0.010) | 0.34 (0.06, 0.62) | 0.02 | |
| Low (remainder of the sample) | n = 521 | n = 179 | ||
| 1.517 (0.004) | 1.526 (0.006) | −0.10 (−0.27, 0.07) | 0.23 |
Higher detection speed scores indicate better psychomotor function. Models are adjusted for the effects of age, sex, education, depression, anxiety, BMI, smoking, diabetes, and hypertension. Sleep symptomatology none, normal scores on the PSQI, ISI, and ESS; Sleep symptomatology high, abnormal sleep on at least two of the three sleep questionnaires. CFI, cognitive function instrument.
Discussion
The results of this study showed that greater sleep symptomatology, encompassing poorer self-reported sleep quality, greater daytime sleepiness, and higher insomnia symptom severity, was associated with greater subjective cognitive concern. In our primary analyses, sleep symptomatology was not significantly associated with objective measures of cognitive performance. However, the strength of the relationship between sleep symptomology and psychomotor function varied across levels of subjective cognitive concerns. Specifically, high sleep symptomatology (versus none) was more strongly associated with poorer psychomotor function in persons with high as compared with low cognitive concerns.
Although a recent meta-analysis reported that insomnia was associated with poorer cognitive function across studies [39], insomnia was adjudicated using both clinical diagnosis and self-reported symptomatology. In our study, self-reported insomnia symptom severity was not associated with objective cognitive deficits. One previous study found that sleep quality and daytime sleepiness (measured using the PSQI and ESS, respectively) were not related to performance on several cognitive tasks in a small sample of 78 adults aged 60 years and over [40]. In the Multicenter Outcomes of Sleep Disorders in Men study (MrOS), the authors reported no associations between self-reported sleep quality (PSQI scores) or daytime sleepiness (ESS scores) and clinically significant cognitive decline, determined based on a decline of 5 or more points on the Modified Mini-Mental State Examination [17]. However, higher PSQI scores did correlate with a greater decline in executive function. In the large community-based Rotterdam Study, PSQI scores were not related to the risk of dementia over a five-year follow-up [15]. Despite these results, several studies report there to be moderate strength associations between daytime sleepiness, self-reported sleep quality, and greater cognitive decline, particularly in older populations [14, 41, 42].
We speculated that certain subgroups may be more vulnerable to the effects of poor sleep and that this may explain differences in results between studies. In partial support of this notion, we found that the relationship between sleep symptomatology and cognitive function was modified by subjective cognitive concerns. We did not find any effect modification by depressive symptoms, APOE ε4 status, or sex. This was somewhat surprising based on past studies. One study found that in a sample of older adults, sleep dysfunction measured with the PSQI was associated with poorer cognitive performance, and this relationship was moderated by subclinical depression [21]. A further study assessing cognitively healthy older adults found that greater insomnia severity was associated with poorer attention, but only for those who reported higher levels of subclinical depressive symptoms [20]. Previous research has also reported that self-reported difficulty breathing during sleep, habitual snoring, and prolonged sleep duration were related to cognitive impairment in older men but not elderly women [19]. With respect to APOE, previous research in older adults has found that a greater number of respiratory events are associated with worse memory performance in APOE ε4 carriers but not non-ε4 carriers [22]. However, our cohort is relatively young, and past research has not found associations between APOE ε4 status and cognition in a cohort with a similar age range [43]. We recently reported that cognitive impairment in the HBP sample was observed only in ε4 homozygotes and that ε4 heterozygotes performed equivalently to non-carriers [44]. As such, the additive effect of sleep disturbances on cognitive impairment may only be evident in ε4 homozygotes. However, given the low prevalence of ε4 homozygotes in the HBP sample (3%), we were underpowered to examine this subgroup separately as part of the current study.
One of our primary findings was that sleep symptomatology was associated with greater subjective cognitive concerns, which could be related to the development of cognitive impairment in the future [45, 46]. Sensitivity analysis confirmed that this was not driven by any single sleep measure since higher scores on the PSQI, ESS, and ISI were all independently associated with more subjective cognitive complaints. In an analysis of two large population-based cohorts (n = 2,993) comprising cognitively normal adults aged 65 years or older, self-reported sleep problems were associated with subjective cognitive decline independent of objective cognitive function [47]. One meta-analysis found that older adults (mean age of 72 years) with concerns about memory but no objective memory deficits were twice as likely to develop dementia as individuals without memory concerns [46]. In our study, the magnitude of the association between sleep symptomatology and objective cognition was also dependent on the severity of subjective cognitive concerns. Thus, patients presenting with cognitive complaints and sleep symptomatology could be encouraged to seek formal assessments, both to screen for sleep disorders and cognitive difficulties. Further follow-up of our cohort is needed to ascertain whether participants reporting sleep symptomatology and subjective cognitive concerns have accelerated cognitive decline and a higher risk of progression to cognitive impairment.
One strength of our study was that our cohort was geographically and ethnically diverse, with 28% of participants reporting residential addresses in rural or regional Australia and approximately 4% from a non-Caucasian background. Thus, our results may generalize beyond participants living in metropolitan areas. Moreover, our assessment of self-reported sleep was comprehensive with the use of three validated questionnaires. We also used the novel approach of combining scores from three sleep questionnaires into a single variable, reflecting overall sleep symptomatology. However, our study is not without limitations. This study’s cross-sectional and observational design means that we cannot infer causality or speculate on the temporal associations between sleep and cognitive function. As sleep was self-reported, there may be an element of response bias or sleep state misperception. However, all sleep measurements used have been validated extensively [11–13], and were included to understand how perceptions of sleep were related to cognition. Future studies could examine whether poor objective sleep quality also has differential associations with objective and subjective cognitive function, measured both cross-sectionally and longitudinally. Lastly, our sample may have some degree of selection bias, as individuals concerned with their cognitive function may have been more likely to participate. This is likely reflected in the high proportions of individuals with a first-degree family history of dementia. As such, replication of our findings in independent cohorts is needed to confirm our findings.
In summary, results from this community-based cohort comprising middle-aged adults suggest a relationship between sleep symptomatology, including poorer sleep quality, excessive daytime sleepiness, and greater insomnia symptom severity, with greater subjective cognitive concerns. Associations between sleep symptomatology and objective cognition were dependent on subjective cognitive concerns. These results suggest that, in midlife, associations between sleep symptomatology and subjective cognition are small to moderate in magnitude. Sleep symptomatology may be more strongly related to objective deficits in cognitive function in the presence of subjective cognitive concerns.
Acknowledgments
We thank all HBP participants for their commitment and dedication to helping advance research into the early detection and causation of dementia. PM is a full-time employee of Cogstate Ltd.
Funding
The Healthy Brain Project (healthybrainproject.org.au) is funded by the National Health and Medical Research Council (GNT1158384, GNT1147465, GNT1111603, GNT1105576, GNT1104273, GNT1158384, GNT1171816), the Alzheimer’s Association (AARG-17-591424, AARG-18-591358, AARG-19-643133), the Dementia Australia Research Foundation, the Bethlehem Griffiths Research Foundation, the Yulgilbar Alzheimer’s Research Program, the National Heart Foundation of Australia (102052), and the Charleston Conference for Alzheimer’s Disease (New Vision Research). MP Pase is supported by a Heart Foundation Future Leader Fellowship (GNT102052) with a sleep research program funded by the National Institutes of Health (NIH)-NIA (R01AG062531). YY Lim is supported by an NHMRC Career Development Fellowship (GNT1162645). RF Buckley is supported by a NIH-NIA K99-R00 award (K99AG061238).
Disclosure Statement
All other authors report no non-financial disclosures.
References
Author notes
Jessica Nicolazzo and Katharine Xu are joint first author.
Yen Ying Lim and Matthew P. Pase are joint senior author.


Comments