


Abstract
To clarify whether sleep disturbance would alter the patterns of structural and functional networks underlying cognitive dysfunction in patients with Parkinson’s disease (PD).
Among the 180 patients with nondemented PD in our cohort, 45 patients were classified as the group with sleep disturbance according to the 5-item scales for outcomes in Parkinson’s disease nighttime scale. Based on propensity scores, another 45 PD patients without sleep disturbance were matched to this group. We performed a comparative analysis of cortical thickness, diffusion tensor imaging-based white matter integrity, resting-state functional connectivity, and cognitive performance between PD patients with and without sleep disturbance.
PD patients with sleep disturbance showed poorer performance in attention and working memory and a tendency toward a lower score in frontal executive function relative to those without sleep disturbance. The PD with sleep disturbance group exhibited widespread white matter disintegration compared to the PD without sleep disturbance group, although there were no significant differences in cortical thickness between the PD subgroups. On functional network analysis, PD patients with sleep disturbance exhibited less severely decreased cortical functional connectivity within the default mode network, central executive network, and dorsal attention network when compared to those without sleep disturbance.
The present study suggests that sleep disturbance in PD patients could be associated with white matter and functional network alterations in conjunction with cognitive impairment.
Ample evidence has suggested that sleep disturbance may have a detrimental impact on neurodegenerative process responsible for cognitive performance in general population or patients with Alzheimer’s disease. However, it remains unclear whether poor sleep contributes to cortical or subcortical structural changes underlying cognitive impairment in patients with Parkinson’s disease. The present study demonstrated the possible effect of sleep disturbance on white matter integrity and resting-state functional networks in Parkinson’s disease. Accordingly, further studies are needed to elucidate the clinical relevance of active intervention to improve sleep quality in patients with Parkinson’s disease.
INTRODUCTION
Sleep disturbance, a common nonmotor symptom in Parkinson’s disease (PD), often occurs in the early stages of PD and even before the onset of parkinsonian motor symptoms.1 Sleep disturbance impairs quality of life in patients with PD as well as their caregivers, and thus, the clinical significance of sleep problems in PD has been rapidly growing.
Along with poor sleep-related cognitive impairment and cortical atrophy in primary insomnia,2 ample evidence has suggested that sleep disturbance may have a detrimental impact on neurodegenerative neuropathologies responsible for cognitive performance. For example, chronic sleep deprivation accelerated β-amyloid plaque formation in a transgenic mouse model of Alzheimer’s disease (AD).3 Moreover, fragmented slow wave sleep was associated with increased plasma β-amyloid levels in patients with amnestic mild cognitive impairment (MCI).4 Adults with self-reported sleep disturbances had a greater β-amyloid burden in cortical and precuneus regions assessed using Pittsburgh Compound B-positron emission tomography (PET) images,5 and thus, a higher risk of developing AD than those without sleep disturbances.6 Similarly, sleep disturbance in patients with PD seems to be associated with poorer cognitive performance7 and a greater α-synuclein burden.8 However, it remains unclear whether poor sleep contributes to cortical or subcortical structural changes underlying cognitive impairment in patients with PD. In the present study, we hypothesized that the presence of sleep disturbance in nondemented PD would exhibit either a distinct cognitive profile or its related structural or functional changes. To do this, we analyzed the pattern of the cortical thickness, white matter (WM) integrity, and resting-state functional networks in nondemented PD patients with respect to the presence of sleep disturbance.
METHODS
Subjects
We reviewed the medical records of the Movement Disorders and Dementia outpatient clinic at Severance Hospital, Yonsei University Health System from January 2011 to June 2015 and selected retrospectively 180 patients with nondemented PD. PD was diagnosed according to the clinical diagnostic criteria of the UK PD Society Brain Bank.9 To ensure clinical diagnostic accuracy,18F-FP-CIT PET scans were performed on all subjects and all showed decreased dopamine transporter (DAT) activity in the posterior putamen. Each subject underwent a neuropsychological assessment and a brain magnetic resonance imaging (MRI) within a 1-year period. Nondemented PD consisted of PD with normal cognition (PD-NC; n = 42) and PD with MCI (PD-MCI; n = 138): PD-NC was diagnosed when a subject showed impairment on less than two items of a detailed neuropsychological test. PD-MCI was diagnosed according to the Movement Disorder Society Task Force guidelines.10 To diagnose PD-MCI, two tests were designated to represent each of the four cognitive domains except language, as described in our previous work.11 In addition, these participants showed no evidence of abnormal activities of daily living, judged both clinically and on an instrumental activities of daily living scale. PD-related impairment and disability were assessed using the Unified PD Rating Scale (UPDRS) in the medication off state. Total medication dose for PD was calculated in levodopa-equivalent dose (LED).12 Exclusion criteria included drug-induced parkinsonism and evidence of focal brain lesions, diffuse WM hyperintensities, or multiple lacunes in the basal ganglia as seen on MRI. The presence of medical comorbidities was also excluded by laboratory tests including tests for thyroid function, vitamin B12 and folic acid levels, and syphilis. In addition, 30 healthy subjects without neurological disease history were included as a control group. The absence of sleep disturbance in healthy subjects was ascertained using the Caregiver-Administered Neuropsychiatric Inventory13: All the subjects denied any sleep-related problem in the sleep and nighttime behavior disorders section. This study was approved by the Yonsei University Severance Hospital institutional review board. Written informed consent was obtained from all subjects who participated in the study.
Classification of PD Patients According to the Presence of Sleep Disturbance
The patients with nondemented PD completed a five-item Scales for Outcomes in Parkinson’s disease (SCOPA)-nighttime scale (NS). The maximum score of the scale is 15, with a score of 6/7 differentiating good sleepers from poor sleepers with good sensitivity and specificity.14 Among 180 nondemented patients, 45 patients (9 PD-NC and 36 PD-MCI) were classified as the group with sleep disturbance (SCOPA-NS score > 6) and the other 135 patients were categorized in the group without sleep disturbance. To reduce the effect of selection bias and potential confounding in this retrospective cohort study, estimated propensity scores were used to match patients with sleep disturbance (n = 45) to those without sleep disturbance (n = 135). In our study, the propensity score was computed for each patient using a logistic regression model including the following variables: age, sex, education, PD duration, UPDRS-III, LED, and the presence of MCI. The propensity score model was well calibrated (Hosmer and Lemeshow goodness of fit test, p = .888) with good discrimination (Harrell’s c index = 0.682, 95% confidence interval [CI]: 0.585–0.779). Based on the propensity scores, 45 patients with sleep disturbance were matched to 45 patients without sleep disturbance. The propensity score matching (PSM) was performed with the R software package, version 3.2.1 (http://www.R-project.org).
Neuropsychological Assessment
All subjects were administered the Seoul Neuropsychological Screening Battery (SNSB), a comprehensive Korean language neuropsychological test battery. A detailed description is provided in the supplemental methods.
MRI and18F-FP-CIT PET Acquisition
MRI and18F-FP-CIT PET scans were acquired in the medication off state using the same protocol as described in our previous works,15,16 and a detailed description is provided in the supplemental methods.
Analysis of Cortical Thickness
We used the same methodology that we employed in a previous study,15 and a detailed description this is provided in the supplemental methods. The statistical analysis of cortical thickness was performed at a vertex-wise level using an analysis of covariance (ANCOVA) with age, sex, years of education, and intracranial volume as covariates for comparisons among the nondemented PD groups with the SurfStat package (http://www.math.mcgill.ca/keith/surfstat). The comparisons between healthy control and nondemented PD groups were also performed. The results for the differences between the groups in cortical thickness were considered significant at random-field theory (RFT)-corrected p < .05.
Tract-Based Spatial Statistics Analysis
We used a similar methodology for data preprocessing as we employed in a previous study (see supplemental methods).15 To compare the fractional anisotropy (FA) and mean diffusivity (MD) differences between the two groups, voxel-wise statistical analyses were performed using the randomized tool in the Functional Magnetic Resonance Imaging of the Brain (FMRIB) Software Library (FSL) with 5000 permutations. Age, sex, and years of education were used as covariates in the ANCOVA. We used a threshold-free cluster enhancement (TFCE) approach and corrected the tract-based spatial statistics (TBSS) result for multiple comparisons using familywise error (FWE) correction. The observed results were considered significant at FWE-corrected p < .05 level.
Functional Connectivity Analysis
For preprocessing of resting-state fMRI data, we used the same methodology that we employed in a previous study (see supplemental methods).17 Three resting-state function networks were included in the analyses to investigate alterations within these networks in patients with nondemented PD according to the presence of sleep disturbance. Each resting-state network and corresponding MNI coordinate of regions of interest (ROIs) were as follows: the default mode network (DMN), posterior cingulate cortex (PCC, x/y/z = 1/−55/17)18; the central executive network (CEN), bilateral dorsolateral prefrontal cortex (DLPFC, x/y/z = −50/15/43 and 50/15/43) and posterior parietal cortex (PPC, x/y/z = −46/−50/44 and 50/−50/51)19; and the dorsal attention network (DAN), bilateral intraparietal sulcus (IPS, x/y/z = −25/−63/47 and 23/−65/43) and frontal eye field (FEF, x/y/z = −26/−9/48 and 32/−9/48).20 These ROIs were described as a 6-mm radius sphere at the peak using a voxel mask. The DMN is strongly associated with cognitive function in resting-state fMRI studies.21 It has also been reported that the CEN and DAN may be related to cognitive impairments in PD.22 The time course for data in each ROI was averaged as reference signals, and the Pearson’s correlation coefficient was computed for each individual subject. The correlation coefficient maps were converted to a z-value using Fisher’s r-to-z transformation. We used an ANCOVA to assess the differences in functional connectivity between the groups using age, sex, and years of education as covariates. Monte Carlo simulations were performed to adjust for type I errors (parameters: individual voxel p value = .02, simulation = 10,000 times iteratively, 8-mm full width at half maximum Gaussian filter width with a whole-brain mask) using the AFNI’s 3dClust Sim program. This program provides an estimate of the overall significance level achieved for various combinations of voxel probability and cluster size threshold.23 Post hoc two-sample t-tests were also performed to assess differences between pairs of the groups. We set a corrected significance level of Palpha < .05 (uncorrected threshold of p < .02 with 313 voxels).
Quantitative Analysis of the18F-FP-CIT PET
A detailed procedure for quantitation of the18F-FP-CIT PET is provided in the supplemental methods. We compared the differences in DAT activities in the caudate and anterior/posterior putamen between PD patients with sleep disturbance and without sleep disturbance.
Statistical Analyses
To compare the baseline demographic characteristics of the groups (before and after PSM), Student’s t test and Pearson’s χ2 test were conducted for continuous and categorical variables, respectively. To compare the subscores of the neuropsychological test between the groups, an ANCOVA was performed adjusting for age, sex, and years of education as covariates. We also used a composite score, dividing the sum of scores by the number of tests in each cognitive domain, in the neuropsychological test, and applied the same analysis. These statistical analyses were performed using SPSS version 20.0 (IBM Inc., Chicago, IL, USA) and a two-tailed P < .05 was considered significant.
RESULTS
Demographic Characteristics
The baseline demographic characteristics of patients with nondemented PD are shown in Table 1. No significant differences were observed in age, sex, years of education, general cognitive deficits measured by the K-MMSE, initial UPDRS-III score, LED, dopamine agonist doses, or the frequency of MCI between groups according to the presence of sleep disturbance. Nondemented PD patients with sleep disturbance showed a significantly longer duration of PD and a higher UPDRS-II score than those without sleep disturbance before PSM, and this difference was not observed after PSM. The PD group with sleep disturbance showed higher scores of UPDRS-I and Beck Depression Inventory (BDI) than that without sleep disturbance.
Baseline demographic characteristics of patients with non-demented PD.
| Overall series | Propensity score-matched pairs | |||||
|---|---|---|---|---|---|---|
| PD-SD+ (n = 45) | PD-SD− (n = 135) | p value | PD-SD+ (n = 45) | PD-SD− (n = 45) | p value | |
| Age | 70.04 ± 7.40 | 68.03 ± 8.36 | .157 | 70.04 ± 7.40 | 70.62 ± 8.28 | .728 |
| Female, No. (%) | 26 (57.8%) | 63 (52.9%) | .579 | 26 (57.8%) | 25 (55.6%) | .832 |
| Education (years) | 10.37 ± 4.87 | 9.04 ± 4.67 | .111 | 10.37 ± 4.87 | 10.39 ± 5.15 | .983 |
| PD duration (months) | 43.49 ± 39.64 | 25.33 ± 32.30 | .008 | 43.49 ± 39.64 | 35.36 ± 46.62 | .375 |
| UPDRS I | 3.33 ± 1.72 | 2.41 ± 1.78 | .008 | 3.33 ± 1.72 | 2.08 ± 1.57 | .002 |
| UPDRS II | 10.22 ± 5.65 | 7.96 ± 4.74 | .021 | 10.22 ± 5.65 | 8.51 ± 6.13 | .220 |
| UPDRS III | 24.43 ± 10.71 | 24.66 ± 11.02 | .908 | 24.43 ± 10.71 | 25.20 ± 14.07 | .783 |
| BDI | 16.93 ± 10.25 | 12.56 ± 8.61 | .013 | 16.93 ± 10.25 | 10.75 ± 7.88 | .002 |
| LED | 190.22 ± 314.61 | 93.57 ± 269.19 | .072 | 190.22 ± 314.61 | 119.89 ± 326.49 | .301 |
| Dopamine agonist dose | 34.44 ± 80.35 | 19.13 ± 58.22 | .265 | 34.44 ± 80.35 | 12.44 ± 53.14 | .130 |
| MCI, No. (%) | 36 (80.0%) | 90 (75.6%) | .554 | 36 (80.0%) | 34 (75.6%) | .612 |
| K-MMSE | 26.31 ± 2.35 | 26.56 ± 2.46 | .555 | 26.31 ± 2.35 | 26.78 ± 2.33 | .347 |
| DAT activity | ||||||
| Right posterior putamen | 2.44 ± 0.67 | 2.27 ± 0.52 | .303 | |||
| Left posterior putamen | 2.39 ± 0.65 | 2.39 ± 0.55 | .900 | |||
| Right anterior putamen | 3.21 ± 0.87 | 2.98 ± 0.68 | .465 | |||
| Left anterior putamen | 3.20 ± 0.80 | 3.17 ± 0.77 | .883 | |||
| Right caudate | 2.53 ± 0.65 | 2.50 ± 0.69 | .330 | |||
| Left caudate | 2.53 ± 0.65 | 2.60 ± 0.74 | .163 | |||
Abbreviations: PD, Parkinson’s disease; PD-SD+, PD with sleep disturbance; PD-SD−, PD without sleep disturbance; UPDRS, Unified PD Rating Scale; BDI, Beck Depression Inventory; LED, levodopa-equivalent dose; MCI, mild cognitive impairment; K-MMSE, the Korean version of the Mini-Mental State Examination; DAT, dopamine transporter.
The values are expressed as mean ± standard deviation or number (percentage).
Table 2 shows the detailed neuropsychological examination of nondemented PD patients. PD patients with sleep disturbance showed poorer performance in the attention and working memory domain (backward digit span, p = .002 and color Stroop test, p = .001) and frontal executive function domain (Controlled Oral Word Association Test [COWAT] animal, p = .045) when compared to those without sleep disturbance. By analyzing composite scores between the 2 groups, PD patients with sleep disturbance had poorer performance in attention and working memory (p = .004) with a tendency toward lower scores in frontal executive function relative to those without sleep disturbance (p = .086).
Neuropsychological data in patients with non-demented PD.
| Test | PD-SD+ (n = 45) | PD-SD− (n = 45) | p value |
|---|---|---|---|
| Attention and working memory | 44.2 ± 1.1 | 48.6 ± 1.1 | .004a |
| Digit span (forward) | 5.9 ± 0.2 | 6.2 ± 0.2 | .218 |
| Digit span (backward) | 3.12 ± 0.16 | 3.86 ± 0.16 | .002 |
| Word stroop test | 109.5 ± 1.3 | 109.3 ± 1.3 | .877 |
| Color stroop test | 58.2 ± 3.5 | 75.0 ± 3.5 | .001 |
| Frontal executive function | 15.2 ± 0.4 | 16.1 ± 0.4 | .086 a |
| Phonemic generative naming | 18.0 ± 1.2 | 19.9 ± 1.2 | .276 |
| COWAT (animal) | 13.2 ± 0.5 | 14.7 ± 0.5 | .045 |
| COWAT (supermarket) | 14.0 ± 0.7 | 15.0 ± 0.7 | .286 |
| 10 points Clock Drawing Test | 8.8 ± 0.2 | 8.9 ± 0.2 | .607 |
| Contrasting program | 19.1 ± 0.4 | 19.5 ± 0.4 | .405 |
| Go-no-go test | 17.4 ± 0.6 | 17.8 ± 0.6 | .676 |
| Language and related function | 23.1 ± 0.4 | 23.0 ± 0.4 | .900 a |
| K-BNT | 43.5 ± 1.1 | 43.0 ± 1.1 | .757 |
| Repetition | 14.7 ± 0.7 | 14.8 ± 0.7 | .246 |
| Calculation | 11.0 ± 0.2 | 11.2 ± 0.2 | .569 |
| Memory function | 14.0 ± 0.4 | 14.3 ± 0.4 | .549 a |
| Verbal memory (SVLT) | 14.4 ± 0.4 | 14.5 ± 0.4 | .913 a |
| Immediate recall | 17.9 ± 0.6 | 18.5 ± 0.6 | .505 |
| Delayed recall | 5.0 ± 0.4 | 4.8 ± 0.4 | .687 |
| Recognition | 20.4 ± 0.3 | 20.2 ± 0.3 | .707 |
| Visual memory (RCFT) | 13.5 ± 0.5 | 14.1 ± 0.5 | .425 a |
| Immediate recall | 10.4 ± 0.7 | 11.4 ± 0.7 | .324 |
| Delayed recall | 10.3 ± 0.8 | 11.2 ± 0.8 | .414 |
| Recognition | 19.2 ± 0.3 | 19.1 ± 0.3 | .618 |
| Visuospatial function | 29.8 ± 0.7 | 30.5 ± 0.7 | .514a |
| RCFT | 29.8 ± 0.7 | 30.5 ± 0.7 | .514 |
| Interlocking pentagon | 8 (17.8%) | 7 (15.6%) | .777 |
The values are expressed as estimated mean ± standard error (score) or number of patients with abnormal score (percentage).
Abbreviations: PD, Parkinson’s disease; PD-SD+, PD with sleep disturbance; PD-SD−, PD without sleep disturbance; COWAT, the Controlled Oral Word Association Test; K-BNT, the Korean version of the Boston Naming Test; SVLT, the Seoul Verbal Learning Test; RCFT, the Rey Complex Figure Test.
a Group comparison with composite scores.
Analysis of Cortical Thickness
PD patients without sleep disturbance exhibited cortical thinning in the left frontoparietal regions compared to control subjects. Areas with cortical thinning areas in PD patients with sleep disturbance relative to controls were extensive, involving the bilateral frontoparietal and lateral temporal areas (Figure 1). In a direct comparison, significant clusters were not observed between PD patients with and without sleep disturbance.
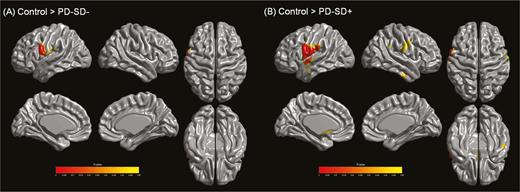
Analysis of cortical thickness. (A) Parkinson’s disease (PD) patients without sleep disturbance exhibited reduced cortical thickness in the left frontoparietal regions relative to controls. (B) PD patients with sleep disturbance showed cortical thinning in more extensive areas compared to controls, including the bilateral frontoparietal and lateral temporal regions (RFT-corrected p < .05). There were no areas of significantly different cortical thickness between PD patients with and without sleep disturbance. Abbreviations: PD-SD−, PD without sleep disturbance; PD-SD+, PD with sleep disturbance.
TBSS Analysis
Compared to control subjects, PD patients with and without sleep disturbance had no significant difference in FA values in WM regions. In a direct comparison, PD patients with sleep disturbance had significantly lower FA values in the bilateral frontoparietal, temporo-occipital, and corpus callosal WM regions than those without sleep disturbance (figure 2A). No WM areas were observed where PD patients without sleep disturbance had decreased FA values relative to those with sleep disturbance. The pattern of MD increase was similar to that of FA decrease in a comparison between the PD groups. No significant clusters in PD patients without sleep disturbance relative to controls were observed. However, PD patients with sleep disturbance exhibited significantly higher MD values in the bilateral frontoparietal, temporal, and corpus callosal WM regions relative to controls (Figure 2B). In a direct comparison, PD patients with sleep disturbance had significantly higher MD values in extensive WM regions than those without sleep disturbance group (Figure 2C). WM areas where PD patients without sleep disturbance had increased MD values relative to those with sleep disturbance were not observed.
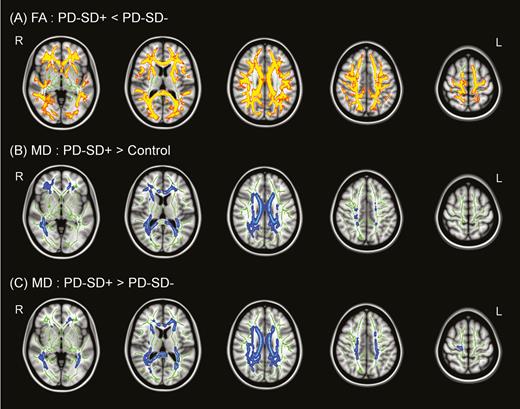
Tract-based spatial statistics (TBSS) analysis. (A) Parkinson’s disease (PD) patients with sleep disturbance showed significantly lower fractional anisotropy (FA) values in widespread regions than those without sleep disturbance. PD patients with sleep disturbance also showed higher mean diffusivity (MD) values than both controls (B) and PD patients without sleep disturbance (C) in widespread regions (FWE-corrected p < .05), where decreased FA and increased MD values are indicative of white matter (WM) disintegration. There were no significant differences between PD patients without sleep disturbance and controls.
Functional Connectivity Analysis
Resting-State Functional Connectivity in DMN
Compared to control subjects, PD patients with and without sleep disturbance showed decreased functional connectivity in sensorimotor and visual cortical areas. However, decreased functional connectivity in DMN was less extensive in PD patients with sleep disturbance (Figure 3I, A and B). In a direct comparison, PD patients with sleep disturbance exhibited less severely decreased cortical functional connectivity in the left medial temporal area compared to those without sleep disturbance (Figure 3I, C). No areas were observed where cortical functional connectivity was significantly increased in PD patients without sleep disturbance relative to those with sleep disturbance.
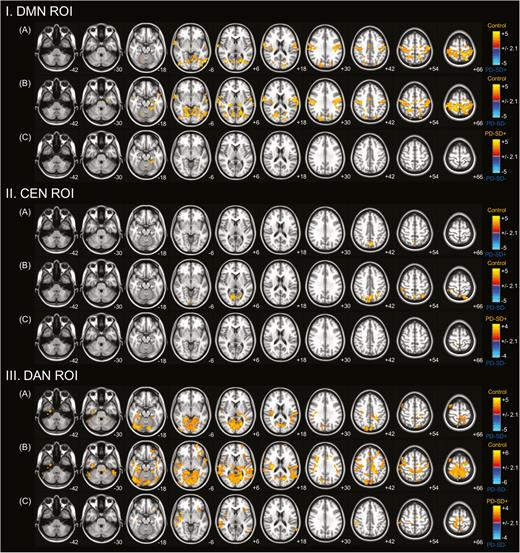
Comparison of resting-state functional connectivity with regions of interest (ROIs). ROIs in the posterior cingulate cortex (PCC) or default mode network (DMN), dorsolateral prefrontal cortex/posterior parietal cortex (DLPFC/PPC) or central executive network (CEN), and intraparietal sulcus/frontal eye field (IPS/FEF) or dorsal attention network (DAN). Groupwise comparisons between Parkinson’s disease (PD) patients with sleep disturbance and controls (A); PD patients without sleep disturbance and controls (B); and PD patients with and without sleep disturbance (C) are shown. PD patients exhibited decreased functional connectivity in sensorimotor and visual cortical areas from seed ROIs in the DMN (I) and DAN (III) and in parieatal areas from a seed ROI in the CEN (II) compared with controls. In a direct comparison, nondemented PD patients with sleep disturbance demonstrated less severely decreased functional connectivity from the seed ROIs than those without sleep disturbance.
Resting-State Functional Connectivity in CEN
Compared to control subjects, PD patients with sleep disturbance had decreased functional connectivity in the parietal areas, and PD patients without sleep disturbance showed decreased connectivity in the parietal and occipital areas (Figure 3II, A and B). In a direct comparison, PD patients with sleep disturbance exhibited less severely decreased cortical functional connectivity in the focal area of right parietal cortex with a high maximum t-value compared to those without sleep disturbance (Figure 3II, C). No areas were observed where cortical functional connectivity was significantly increased in PD patients without sleep disturbance relative to those with sleep disturbance.
Resting-State Functional Connectivity in DAN
Compared to control subjects, PD patients with and without sleep disturbance showed decreased functional connectivity more pronounced in visual cortex and less pronounced in sensorimotor cortex. However, decreased functional connectivity in DAN was less extensive in PD patients with sleep disturbance (Figure 3III, A and B). In a direct comparison, PD patients with sleep disturbance exhibited less severely decreased cortical functional connectivity in the frontal, insular, parietal, and temporal areas compared to those without sleep disturbance (Figure 3III, C). No areas were observed where cortical functional connectivity was significantly increased in PD patients without sleep disturbance relative to those with sleep disturbance were observed. The anatomical locations of the significant peaks based on seed ROIs are listed in a supplemental table (Table S1).
Quantitation of the18F-FP-CIT PET Between the Nondemented PD Groups
There were no significant differences in DAT activity in the bilateral caudate and anterior/posterior putamen between nondemented PD patients with sleep disturbance and those without sleep disturbance (table 1).
DISCUSSION
The present study provides novel information regarding the relationship between sleep disturbance and structural or functional network abnormality-related cognitive impairment in patients with nondemented PD. The major findings of the present study were as follows: (1) PD patients with sleep disturbance showed poorer performance in attention/working memory with a tendency toward lower scores in frontal executive function than those without sleep disturbance. (2) Cortical thinning in PD patients with sleep disturbance relative to controls was more extensive than those without sleep disturbance. (3) PD patients with sleep disturbance exhibited WM disintegration in widespread regions when compared to those without sleep disturbance. (4) cortical functional connectivity from seed ROIs of the DMN, CEN, and DAN in PD patients with sleep disturbance exhibited a less severe decrease when compared to those without sleep disturbance. These data suggest that sleep disturbance in PD patients would be associated with WM and functional network alterations in conjunction with cognitive impairment.
Several studies have reported that sleep plays a restorative role in the brain by reducing the release of neurotoxic metabolites3 or enhancing the removal of waste products that accumulated during the awake state.24 It can be inferred that sleep disturbance would promote the deposition of neurotoxic products, especially under neurodegenerative conditions. The current study demonstrated that patients with nondemented PD with sleep disturbance had more severe WM disintegration in widespread regions than those without sleep disturbance and healthy controls, although FA values of the sleep disturbance group were comparable with those of the normal subjects. Significant WM alterations were not seen in PD patients without sleep disturbance compared to controls. Our results suggest that sleep disturbance would be associated with microstructural abnormalities of WM in patients with nondemented PD. Since there were no significant differences in cortical thickness between the PD groups, WM pathology would not result from secondary degeneration adjacent to gray matter atrophy but rather primary damage to the fibers. In AD, chronic sleep deprivation accelerates β-amyloid deposition into insoluble amyloid plaques.3 Similarly, a postmortem study demonstrated a significant association between sleep disruption in patients with PD and α-synuclein and tau pathologies in structures relating to sleep physiology,8 although it remains unclear whether sleep disturbance preceded these pathological changes or vice versa. Given that disruption in axonal transport α-synuclein precedes cell body loss,25 we speculate that poor sleep in patients with PD may lead to a greater burden of PD-related pathologies, possibly contributing to microstructural changes in WM regions prior to neuronal damage.
It is widely accepted that sleep disturbance is associated with impairment in cognitive performance. In PD populations, greater nocturnal sleep disturbance was associated with cognitive dysfunction in executive attention,26 working memory, and memory consolidation.27 Our data also revealed poor performance in executive attention and working memory function domains in nondemented PD patients with sleep disturbance compared to those without sleep disturbance, which are in line with previous studies. Regarding the pathogenesis, there are some data to suggest that sleep disturbance and cognitive impairment are etiologically linked. However, it is difficult to define in a PD population because the etiology of sleep disturbance in PD may be multifactorial. Nevertheless, the present data suggest that the microstructural disintegrity of WM in frontoparietal, temporooccipital, and corpus callosal regions may be structural correlates to explain the cognitive impairment in PD patients with sleep disturbance. In addition, a previous study has suggested that cognitive complaints seem to differ according to the specific profiles of sleep problems.27 Nocturnal sleep disturbance was correlated with working memory and memory consolidation, although there was no longer significant association after controlling for potential confounders. On the other hand, excessive daytime sleepiness was associated with slow processing speed and REM sleep behavior disorder (RBD) was associated with working memory and verbal fluency. Since distinct profiles of sleep problems may reflect different pathophysiological or neuroanatomical changes, caution is required to define the sleep disruptions when future studies are performed.
A number of previous studies have reported that nondemented PD patients exhibited cortical thinning in various regions including the parietal–temporal cortex,28–32 prefrontal cortex,29,30,33,34 occipital cortex,29,31 and hippocampus.33 In addition, cortical thinning was also observed in the vicinity of the motor cortex similar to the present study,32,34 and cortical atrophy in this area seems to be a reflection of parkinsonian motor symptoms.34 A recent study investigated the anatomical patterns of cortical atrophy in PD without dementia and demonstrated that atrophy in the precentral gyrus was one of distinct cortical thinning patterns.35 In this regard, the pattern of cortical thinning in PD patients in this study would be PD-specific atrophy, although the PD subgroups according to the presence of sleep disturbance did not show a significant difference in cortical thickness.
In non-PD populations, numerous studies have assessed the functional network changes associated with sleep deprivation. However, the patterns of functional networks are different depending on type of sleep deprivation or variety of sleep problems.36–38 There is little information on the patterns of functional networks related to sleep problems in PD populations, although a recent study in PD patients with daytime sleepiness showed an altered neural activity in several cortical regions.39 The current study demonstrated that the nondemented PD with sleep disturbance group showed less severely decreased functional connectivity from the DMN, CEN, and DAN relative to the PD without sleep disturbance group. The functional connectivity has not yet been fully determined by the underlying structural connectivity architecture, although it is commonly thought to have a strong correlation between functional and anatomical connectivity.40,41 Our findings, a discrepancy between functional and structural connectivity with respect to the presence of sleep disturbance in PD patients, can be interpreted as a compensatory mechanism of functional networks against microstructural alterations in widespread WM. Alternatively, a loss of diversity in large-scale cortical dynamics resulting from the WM disintegration may lead to an increase in functional connectivity.41 In particular, our study demonstrated that less severely decreased cortical functional connectivity was most extensively observed from the DAN in PD patients with sleep disturbance relative to those without sleep disturbance. The DAN is known to be activated during attention oriented in space and processing of categorization and item working memory,42 which is in line with cognitive patterns exhibiting poorer performance in the PD group with sleep disturbance. On the other hand, the PD groups with or without sleep disturbance had decreased functional connectivity within these representative networks compared to the control group. As this finding is consistent with previous functional networks studies, it may be ascribed to the underlying PD pathology of their own or structural abnormalities.22,43 Additionally, PD patients in the present study had reduced cortical thickness in the frontoparietal regions relative to controls. Thus, it seems that a compensatory effect of functional networks in PD patients with sleep disturbance may not be sufficient to overcome the effect of PD pathology itself.
Finally, there was no significant difference in nigrostriatal dopaminergic denervation between nondemented PD patients with and without sleep disturbance. This result suggests that the contribution of the dopaminergic system to sleep and cognition in PD patients would be less than that of either WM integrity or resting-state functional connectivity network.
Our study had some limitations. First, sleep disturbance was not evaluated with objective measures, such as polysomnography and actigraphy, although the validated sleep scale, SCOPA-NS, was used for a reliable classification. Second, dopaminergic treatment may have an effect on either sleep44 or cognition45,46 and functional connectivity.47 However, the majority (77.8%) of subjects in this study were de novo PD patients, and LED was included as a variable when matching the PD groups with the propensity score. In addition, PD patients with sleep disturbance had higher scores on BDI and UPDRS-I than those without sleep disturbance. The presence of depression or other factors in UPDRS-I may lead to alterations in structural and functional network patterns48; however, the pattern of structural and functional networks was consistent when adjusting these factors. Third, when performing the fMRI, the resting state may be an uncontrolled condition, despite an instruction to remain awake and its heterogeneity from wakefulness to sleep may partially impact on the results.49 The effect of acute sleep deprivation on the cortical functional connectivity also has been reported in numerous studies.36,37,50,51 It may act as a confounding factor in this study, although we investigated the effect of long-standing sleep deprivation in the patients with PD. In addition, the head motion may induce spurious findings in the neuroimaging analyses,52–54 and we made an effort to correct for the motion artifacts to minimize its effect. Fourth, mixed sleep profiles were present in some subjects with sleep disturbance. Indeed, 19 (42.2%) PD patients showed either excessive daytime somnolence or RBD symptoms in addition to nocturnal sleep disturbance, which may confound the results of neuroimaging and cognitive assessments. In addition, the common sleep disorders such as obstructive sleep apnea and restless legs syndrome were not assessed, and these conditions may be associated with the structural and functional network alterations.55,56 A further study of imaging networks focusing on a specific sleep problem is required to resolve this issue in patients with PD.
SUPPLEMENTARY MATERIAL
Supplementary data are available at SLEEPJ online.
FUNDING
This research was supported by a grant from the Korea Health Technology R&D Project through the Korea Health Industry Development Institute (KHIDI), funded by the Ministry of Health & Welfare, Republic of Korea (grant number: HI16C1118), and by the Brain Research Program through the National Research Foundation of Korea (NRF) funded by the Ministry of Science, ICT & Future Planning (NRF-2014M3C71A1046050).
INSTITUTIONS AT WHICH THE WORK WAS PERFORMED
Yonsei University College of Medicine and Hanyang University
DISCLOSURE OF OFF-LABEL OR INVESTIGATIONAL USE
Not applicable.
CLINICAL TRIAL
Not applicable.
DISCLOSURE STATEMENT
None declared.
ACKNOWLEDGMENT
The authors would like to thank all the participants who have taken part in this study. Author contributions: S.J. Chung and P.H. Lee conducted the study design. S.J. Chung, H.S. Yoo, and S.H. Moon included participants. S.J. Chung, Y.H. Choi, H. Kwon, Y.H. Park, H.J. Yun, and S.H. Moon performed the statistical analyses. Y.H. Choi, H. Kwon, Y.H. Park, H.J. Yun, and J.M. Lee performed the imaging data processing and analyses. S.J. Chung, Y.H. Choi, H. Kown, Y.H. Park, and H.J. Yun wrote the manuscript, which was co-edited by H.S. Yoo, B.S. Ye, Y.H. Sohn, J.M. Lee, and P.H. Lee.
REFERENCES
Author notes
Address correspondence to: Phil Hyu Lee, MD, PhD, Department of Neurology, Yonsei University College of Medicine, 50 Yonsei-ro, Seodaemun-gu, Seoul, 120–752, South Korea. Telephone: 82-2-2228-1608; Fax: 82-2-393-0705; E-mail: phisland@chol.net


Comments