


Abstract
Sleep is a plausible target for public health promotion. We examined the association of changes in sleep with subsequent health and well-being in the general population.
We analyzed data from the UK Household Longitudinal Survey, involving 30594 people (aged > 16) who provided data on sleep and health and well-being at both Wave 1 (2009–2011) and Wave 4 (2012–2014) assessments. Predicting variables were changes in sleep quantity, sleep quality, and sleep medication use over the 4-year period. Outcome variables were the General Health Questionnaire (GHQ-12) and the 12-Item Short-Form Health Survey (SF-12) mental (MCS) and physical (PCS) component scores at Wave 4. Linear regression on each outcome was fully adjusted for potential confounders and baseline values of the relevant predicting and outcome variables.
Better outcomes were associated with an increase in sleep duration (GHQ: β = 1.031 [95% confidence interval {CI}: −1.328, −0.734]; MCS: 1.531 [1.006, 2.055]; PCS: −0.071 [−0.419, 0.56]), sleep quality (GHQ: β = −2.031 [95% CI: −2.218, −1.844]; MCS: 3.027 [2.692, 3.361]; PCS: 0.924 [0.604, 1.245]), and a reduction in sleep medication use (GHQ: β = −1.929 [95% CI: −2.400, −1.459]; MCS: 3.106 [2.279, 3.933]; PCS: 2.633 [1.860, 3.406]). Poorer outcomes were on the other hand associated with a reduction in sleep duration, a decrease in sleep quality, and an increase in sleep medication use. Changes in sleep quality yielded the largest effects on the health and well-being outcomes.
Changes in sleep were temporally associated with subsequent health and well-being. Initiatives that aim to protect a critical amount of sleep, promote sleep quality, and reduce sleep medication use may have public health values.
Sleep is gaining traction as a health and well-being topic in recent years, with more and more evidence showing that poor sleep is a risk factor of a range of noncommunicable diseases and even increased mortality. Helping people to achieve a healthy sleep pattern may be a cost-effective way to promote well-being, but there is little empirical evidence that sleep improvements (in a nonclinical context) is followed by better health and well-being outcomes. This article examined the potential benefits of positive sleep changes on health and well-being in the general population from an epidemiological angle. Using data from the UK Household Longitudinal Study, we found that positive changes in sleep duration, sleep quality, and sleep medication use over a period of 4 years are temporally associated with better subsequent health and well-being. Initiatives that aim to protect a critical amount of sleep, promote sleep quality, and reduce sleep medication use may have public health values.
INTRODUCTION
Sleep is increasingly recognized as a vital part of public health.1–5 Sleeplessness has now been linked to problems with daytime functioning and vehicle and occupational accidents.6–8 The increased awareness is also explained by the emerging connections of sleep with health and well-being, whereby excessively long or short sleep duration, poor sleep quality, and chronic use of sleep medication have been identified as predictors of adverse outcomes. The most convincing evidence has come from longitudinal studies, showing that people reporting these sleep issues are at greater risk for developing depression,9 obesity,10 type II diabetes,11 hypertension,12 and cardiovascular disease,13 directly and indirectly contributing to higher risks of mortality.14–16
These findings highlight sleep as a profitable treatment target for a number of long-term conditions. However, in examining the public health benefits of early sleep interventions, we have limited evidence outside of the clinical context that sleep parameters are amenable to “positive change” over time and that “positive changes” in sleep duration, quality, and sleep medication use are associated with better health and well-being outcomes in the general population.
Only a handful of population-based longitudinal studies have investigated the prospective effect of sleep “changes” on health and well-being. Analyses of data from the Whitehall II study have indicated that a reduction of sleep duration to <6 hours per night, over a period of 5 years, is associated with lower scores on a range of memory and cognitive function tests including the Mini Mental State Examination, an instrument commonly used to assess progression of dementia.17 Such reduction in nightly sleep duration is also associated with higher levels of C-reactive protein (CRP) and interleukin-6 (IL-6) over the 5-year period.18 Both CRP and IL-6 are biomarkers of inflammation with implications for the development of cardiovascular disease, cancer, and depression.19 Whereas, analyses of data from the Quebec Family Study have revealed that short sleepers increasing their nightly sleep duration from <6 to 7–8 hours were less likely to gain weight and adiposity over a period of 6 years, compared with those who maintain a short sleep duration.20,21 Although these findings suggest a role for sleep in cognitive functioning and weight control, the extent to which “changes” in sleep impact on our health and well-being has not been examined. Furthermore, little is understood about the effect of changes in other important sleep parameters such as sleep quality and sleep medication use. The only population-based study that looked at changes in these parameters found no effect for sleep quality change, but a significant increase in mortality risk among those who switched status from nonusers or infrequent users to frequent users of sleep medication.22
To address these gaps in knowledge, the current study examined changes in sleep in the general population and the effect of both positive and negative changes in sleep on health and well-being, using data from the UK Household Longitudinal Survey (UKLHS). We captured changes in sleep duration, sleep quality, and use of sleep medication over a period of 4 years, and we used changes in these parameters to predict outcomes reported at the end of the 4-year period. It was hypothesized that an increase in sleep duration and a reduction in sleep medication use would be associated with better outcomes, whereas a reduction in sleep duration and an increase in sleep medication use would be linked to poorer outcomes at 4 years. No prediction was made for changes in sleep quality given the absence of prior evidence.
METHOD
Study Design
We analyzed Wave 1 (2009–2011) and Wave 4 (2012–2014) data drawn from the UKLHS,23 a major panel study that supersedes and incorporates the British Household Panel Survey (BHPS). The University of Essex granted ethical approval to the study. Detailed description of the design and conduct of the survey can be found elsewhere.24 A total of 18 waves of annual assessment are planned. Each wave of data collection spans over 2 years. At the time of writing, only the first five waves of data have been released, and of particular relevance to our analysis plan, Wave 4 repeated for the first time the same sleep questions administered in Wave 1. These data were retrieved and analyzed under the regular UK Data Service’s End User License. Figure 1 summarizes the participant constitution of the UKHLS at Wave 1 and Wave 4 and the response rate by household data collection structure.
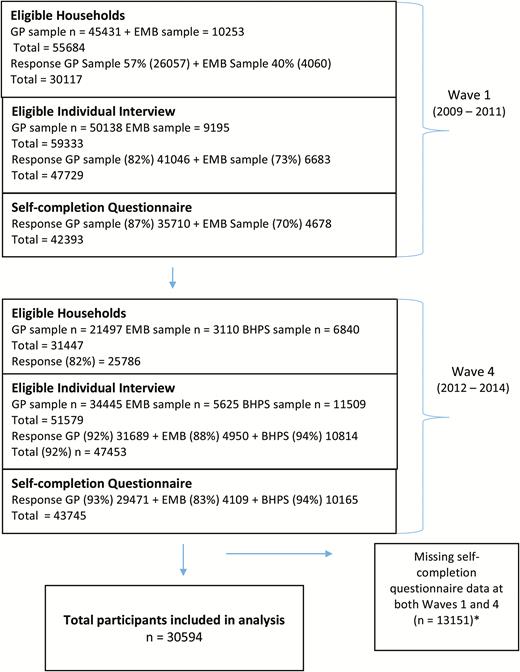
UKHLS survey flowchart, summarizing the participant constitution of the UKHLS at Wave 1 and Wave 4, and the response rate by household data collection structure. *The former BHPS sample was introduced at Wave 2, but these participants’ data were not included in the current analysis as their Wave 1 data were missing.
Both Wave 1 and Wave 4 samples consisted of a general population sample (GP) and a booster sample of minority ethnic groups (EMB). However, Wave 4 also incorporated a sample of BHPS whose involvement in the UKHLS began at Wave 2. The GP sample was selected from postal addresses, using a proportionally stratified, clustered, and equal probability approach. The EMB sample was recruited through oversampling of areas with a higher population density of five targeted ethnic minority groups; Indian, Pakistani, Bangladeshi, Black Caribbean, and Black African.
The data collection method followed the structure of a household. Within each household, only one person completed the household enumeration grid and the household interview. Each member of the household aged over 16 had an individual interview and a self-completed questionnaire.
At Wave 1,25 45431 eligible households were identified for the GP sample and 10253 for the EMB sample. Of these, interviews were achieved with 57% (26057) of the GP and 40% (4060) of the EMB households. Within these interviewed households, individual interviews were completed with 82% of adults (aged 16 or over) in the GP sample and 73% in the EMB sample. Of these adult respondents, 87% (n = 41046) of those in the GP sample and 70% (n = 6683) of those in the EMB sample also completed a paper self-completion questionnaire, which contained questions about sleep habits, health and well-being that were used in the current study.
At Wave 4,26 31447 eligible households were identified. Of these, 21497 were from the GP sample, 3110 the EMB sample, and 6840 the BHPS sample. The overall response rate was 62% at the household level. Within these interviewed households, 92% of all eligible adults (n = 47453) gave individual interviews and >80% of these interviewed individuals also returned a self-completion questionnaire (93% in the GP sample, 83% EMB sample, and 94% BHPS), which included the same questions about sleep habits, health and well-being asked in Wave 1.
Participants
For the current study, 30594 people provided self-completion data at both Waves 1 and 4, allowing for longitudinal comparison.
Assessment of Predictors, Outcomes, and Potential Confounders
The key sleep parameters of interest were (1) sleep quantity, (2) sleep quality, and (3) use of sleep medication. In both waves of assessments, sleep quantity was calculated from the question that asked, “How many hours of actual sleep did you usually get at night during the last month?” (“hh:mm”). Sleep quality was measured using the question, “During the past month, how would you rate your sleep quality overall?” (“very good,” “fairly good,” “fairly bad,” or “very bad”). Use of sleep medication was checked with the question, “During the past month, how often have you taken medicine (prescribed or ‘over the counter’) to help you sleep?” (“not during the past month,” “less than once a week,” “once or twice a week,” or “three or more times a week”). These sleep questions were modified from select items of the well-validated Pittsburgh Sleep Quality Index (PSQI).27 The wording, timeframe, and response scale of the questions were exactly the same. The PSQI has good internal consistency (α = 0.83) and test–retest reliability (r = 0.82; over an average of 19 days).28,29
Predicting variables were “changes” in these sleep parameters between Waves 1 and 4 assessments. For both sleep quantity and use of sleep medication, the three derived response categories were “increase,” “no change,” and “decrease”; for sleep quality, “better,” “no change,” or “worse.” The number of subjects and their response categories across assessment points for each of these sleep parameters are shown in Supplementary Tables 1–3.
Outcome variables were health and well-being, measured with the 12-item General Health Questionnaire (GHQ-12; Likert scoring)30,31 and the 12-item Short-Form Health Survey (SF-12)32 at Wave 4. The GHQ-12 is an established self-report measure for assessing psychological comorbidity in non-psychiatric, community settings. The SF-12 is a well-validated scale for measuring health-related quality of life. It gives two component summary scores, mental component summary (MCS) and physical component summary (PCS), which were used as separate outcome variables in the current study.
Potential confounders taken into consideration were demographics variables assessed at Wave 1, including age, sex, ethnicity, education and employment status, and body mass index (BMI). In addition, baseline values of the relevant predicting sleep variables, GHQ-12, MCS, and PCS were entered to the model to adjust for differences in symptom presentation.
Analysis
We first analyzed how the Wave 4 measurement of GHQ-12, PCS, and MCS was associated with each of the key sleep-change parameters. Each analysis was restricted to only the subjects who provided data for the outcome variables at both Waves 1 and 4, because cases with incomplete outcomes but complete predictors do not contribute to the regression of interest if the outcome is missing at random, or will cause modeling issues if the outcome is not missing at random.33,34 This led to a sample size of 22396 for GHQ-12 and 25431 for both PCS and MCS. We further restricted the analysis to those who had complete data on both Waves 1 and 4 measurements on the key sleep-change parameters as well as the confounders of interest. We investigated the sensitivity of our results to these further restrictions by using multiple imputation by chained equations35–37 (see Supplementary Appendix 1).
Our first analysis on each of the outcomes was a linear regression on the outcome measurement at Wave 4 on each of the key sleep-change parameters, while accounting for the baseline outcome measurement, the potential confounders, and baseline measurement of the sleep parameters. In the estimation of the parameters, longitudinal weights computed by UKHLS were applied to the regression analysis. These weights apply to individual data from Waves 1 to 4 representing adult populations who continued to live in the United Kingdom at both time points; they accounted for unequal selection probability, potential sampling biases, and participant nonresponse.38 We adjusted for confounders by means of multivariable adjustment. We computed the local effect size of each sleep predictor using Cohen’s f2, which quantifies the proportion of variance explained by adding a sleep predictor to the model with confounders alone.38
All analyses were carried out in R (http://www.r-project.org).
RESULTS
Participant Characteristics
Table 1 presents the baseline demographic characteristics of the participants by analysis. The sample characteristics were highly similar across analyses. Based on the complete case analysis, over half of the participants were female (56.037%), with a mean age of 47.166 years and a mean BMI of 26.268. The majority of the samples were white (87.957%), in full-time employment (44.483%), and did not have a university first degree (49.358%).
Participant Characteristics at Baseline by Analysis.
| Predictors/confounders | GHQ analysis (n = 20065) | MCS analysis (n = 20435) | PCS analysis (n = 20435) | Complete case analysis (n = 20003) |
|---|---|---|---|---|
| Demographic confounders at baseline | ||||
| Sex: female, n (%) | 11248 (56.058) | 11453 (56.046) | 11453 (56.046) | 11209 (56.037) |
| Age mean (SD) | 47.195 (16.619) | 47.157 (16.679) | 47.157 (16.679) | 47.166 (16.613) |
| BMI mean (SD) | 26.269 (5.019) | 26.262 (5.024) | 26.262 (5.024) | 26.268 (5.020) |
| Ethnicity | ||||
| White, n (%) | 17646 (87.944) | 17911 (87.649) | 17911 (87.649) | 17594 (87.957) |
| Asian, n (%) | 1283 (6.394) | 1337 (6.543) | 1337 (6.543) | 1274 (6.369) |
| Black, n (%) | 607 (3.025) | 632 (3.093) | 632 (3.093) | 606 (3.030) |
| Mixed, n (%) | 303 (1.510) | 318 (1.556) | 318 (1.556) | 303 (1.515) |
| Other, n (%) | 226 (1.126) | 237 (1.160) | 237 (1.160) | 226 (1.130) |
| Employment | ||||
| Full time, n (%) | 8914 (44.426) | 9041 (72.689) | 9041 (72.689) | 8898 (44.483) |
| Part-time, n (%) | 3336 (16.626) | 3397 (27.311) | 3397 (27.311) | 3328 (16.638) |
| Not in employment, n (%) | 7815 (38.948) | 7997 (39.134) | 7997 (39.134) | 7777 (38.879) |
| Education | ||||
| University first degree or above, n (%) | 7735 (38.548) | 7859 (38.459) | 7859 (38.459) | 7711 (38.549) |
| Any other qualification, n (%) | 9900 (49.340) | 10075 (49.303) | 10075 (49.303) | 9873 (49.358) |
| No qualification, n (%) | 2430 (12.110) | 2501 (12.239) | 2501 (12.239) | 2419 (12.093) |
| Predictors at baseline | ||||
| Total sleep | ||||
| <6 h, n (%) | 2354 (11.732) | 2401 (11.749) | 2401 (11.749) | 2340 (11.698) |
| 6–8 h, n (%) | 15445 (76.975) | 15710 (76.878) | 15710 (76.878) | 15405 (77.013) |
| >8 h, n (%) | 2266 (11.293) | 2324 (11.373) | 2324 (11.373) | 2258 (11.288) |
| Sleep quality | ||||
| Very bad, n (%) | 761 (3.793) | 780 (3.817) | 780 (3.817) | 755 (3.774) |
| Fairly bad, n (%) | 3648 (18.181) | 3722 (18.214) | 3722 (18.214) | 3639 (18.192) |
| Fairly good, n (%) | 10780 (53.725) | 10965 (53.658) | 10965 (53.658) | 10752 (53.752) |
| Very good, n (%) | 4876 (24.301) | 4968 (24.311) | 4968 (24.311) | 4857 (24.281) |
| Sleep medication use | ||||
| Not during the past month, n (%) | 16876 (84.107) | 17173 (84.037) | 17173 (84.037) | 16827 (84.122) |
| Less than once a week, n (%) | 901 (4.490) | 922 (4.512) | 922 (4.512) | 900 (4.499) |
| Once or twice a week, n (%) | 523 (2.607) | 531 (2.598) | 531 (2.598) | 521 (2.605) |
| Three or more times a week, n (%) | 1765 (8.796) | 1809 (8.852) | 1809 (8.852) | 1755 (8.774) |
| Outcomes at baseline | ||||
| GHQ, mean (SD) | 10.899 (5.108) | — | — | 10.899 (5.107) |
| MCS, mean (SD) | — | 51.084 (9.517) | — | 51.113 (9.482) |
| PCS, mean (SD) | — | — | 50.385 (10.562) | 50.430 (10.521) |
BMI = body mass index; GHQ = General Health Questionnaire; MCS = SF-12 mental component summary; PCS = SF-12 physical component summary. Summary statistics are restricted to the complete cases for Wave 1 and Wave 4 measurements as well as information on the confounders. The complete case analysis presented in the final column applies the restriction to all outcomes, confounders, and predictors.
At baseline, most of the participants reported an average sleep duration of 6–8 hours per night (77.0%). The remainder of the participants were split evenly into two camps, with 11.7% reported sleeping less than 6 hours and 11.3% more than 8 hours a night. While the majority considered their sleep quality to be fairly (53.8%) or very good (24.3%), a fifth of the participants regarded their sleep quality fairly (18.2%) or very bad (3.8%). Nearly 16% of the participants reported sleep medication use in the past month, with 8.8% taking sleep medications more than three times a week. Values of mean scores on the GHQ-12 (10.9), MCS (51.1), and PCS (50.4) were within the normative range.30,32
Changes in sleep quantity, sleep quality, and use of sleep medications were observed over the 4-year period, although stability in these parameters appeared to be the default (Supplementary Tables 1–3). Twice as many participants reported a decrease (18.9%) than an increase (9.4%) in sleep quantity. Change in sleep quality was split between both directions, with 24.5% noting better sleep quality and 21.2% noting worse sleep quality over time. The number of participants reporting a reduction in sleep medication use (13.4%) was nearly three times higher than those reporting an increase (5%).
Effect of Sleep Changes on Wave 4 GHQ-12
Table 2 presents the parameter estimates of all predictors included in the regression models. Adjusted for the Wave 1 GHQ-12 score and all potential confounders, both an increase and a decrease in sleep quantity were found to be independent predictors of Wave 4 GHQ-12 score and yielded an effect size of f2 = 0.014. A decrease in sleep quantity was associated with a higher subsequent GHQ-12 score (β = 1.913, 95% confidence interval [CI] = [1.682, 2.144]), suggestive of more psychiatric symptoms, whereas an increase in sleep quantity was associated with a lower GHQ-12 score (β = −1.031, 95% CI = [−1.328, −0.734]). Changes in sleep quality yielded an effect size of f2 = 0.090, and worse sleep quality was associated with a higher GHQ-12 score (β = 2.348, 95% CI = [2.157, 2.538]) and better sleep quality was associated with a lower GHQ-12 score (β = −2.031, 95% CI = [−2.218, −1.844]). The same pattern of findings was also observed for changes in sleep medication use, which yielded an effect size of f2 = 0.019; an increase in sleep medication use was associated with a higher Wave 4 GHQ-12 score (β = 2.595, 95% CI = [2.240, 2.949]) and a decrease in sleep medication use a lower GHQ-12 score at Wave 4 (β = −1.929, 95% CI = [−2.400, −1.459]).
Predictors of Wave 4 GHQ Score by Wave 1 GHQ Score, Potential Confounders at Baseline, and Changes in Sleep Parameters Across the Two Assessment Points.
| Predictors/confounders | Model 1: Wave 1 GHQ + confounders + change in sleep quantity (n = 20259) | Model 2: Wave 1 GHQ + confounders + change in sleep quality (n = 20894) | Model 3: Wave 1 GHQ + confounders + change in sleep medication (n = 21045) |
|---|---|---|---|
| Wave 1 GHQ | 0.448 (0.433, 0.463) | 0.394 (0.378, 0.411) | 0.449 (0.432, 0.462) |
| Male | −0.736 (−0.890, −0.582) | −0.626 (−0.774, −0.479) | −0.706 (−0.859, −0.553) |
| Age | −0.023 (−0.028, −0.018) | −0.019 (−0.024, −0.015) | −0.024 (−0.029, −0.019) |
| Asian | 0.505 (0.155, 0.854) | 0.791 (0.459, 1.124) | 0.721 (0.376, 1.067) |
| Black | −0.945 (−1.541, −0.349) | −0.553 (−1.111, 0.004) | −0.552 (−1.135, 0.032) |
| Mixed | −0.896 (−1.598, −0.195) | −1.044 (−1.707, −0.380) | −0.959 (−1.649, −0.269) |
| Other | 0.420 (−0.358, 1.199) | 0.560 (−0.169, 1.289) | 0.361 (−0.393, 1.114) |
| BMI | 0.027 (0.023, 0.054) | 0.030 (0.016, 0.045) | 0.044 (0.029, 0.059) |
| Any other qualification | 0.098 (−0.068, 0.264) | 0.110 (−0.049, 0.270) | 0.183 (0.019, 0.349) |
| No qualification | 0.094 (−0.162, 0.350) | 0.085 (−0.156, 0.326) | 0.139 (−0.112, 0.390) |
| Part-time employment | −0.197 (−0.424, 0.030) | −0.185 (−0.402, 0.032) | −0.227 (−0.451, −0.003) |
| Not in employment | 0.456 (0.271, 0.642) | 0.433 (0.259, 0.608) | 0.414 (0.233, 0.594) |
| Sleep quantity—decrease | 1.913 (1.682, 2.144) | ||
| Sleep quantity—increase | −1.031 (−1.328, −0.734) | ||
| Sleep quality—worse | 2.348 (2.157, 2.538) | ||
| Sleep quality—better | −2.031 (−2.218, −1.844) | ||
| Sleep medication use—increase | 2.595 (2.240, 2.949) | ||
| Sleep medication use—decrease | −1.929 (−2.400, −1.459) |
BMI = body mass index; CI = confidence interval; GHQ = General Health Questionnaire; UKLHS = UK Household Longitudinal Survey. Model parameter estimates (95% CI) for each of the considered models. Confounders included Wave 1 GHQ, age, sex, ethnicity, education and employment status, BMI, and baseline predictors of the sleep variables. For the confounders, the reference group for sex was “female,” race was “white,” employment status was “full time,” and education was “university first degree or above.” For each of the key sleep-change parameters, the reference group was “no change.” For each of the key sleep parameters, the reference group was “no change.” For the UKLHS, the GHQ score range was 0–3 instead of 1–4 for each individual item. A higher GHQ score indicates more distress. Risk factors are marked by positive estimates and protective factors by negative estimates. Findings of more elaborated models with area of residence, urban/rural settlement, and monthly income as additional confounders are available on request.
Effect of Sleep Changes on Wave 4 MCS
Table 3 summarizes the results of the same analyses carried out with Wave 4 MCS score as the outcome variable. Adjusted for the Wave 1 MCS score and all potential confounders, changes in sleep quantity were found to be independent predictors of Wave 4 MCS score and yielded an effect size of f2 = 0.016. A decrease in sleep quantity was associated with a lower subsequent MCS score (β = −2.628, 95% CI = [−3.038, −2.217]), suggestive of poorer mental health, whereas an increase in sleep quantity was associated with a higher MCS score (β = 1.531, 95% CI = [1.006, 2.055]). As for changes in sleep quality, which yielded an effect size of f2 = 0.081, there were associations between worse sleep quality and a lower MCS score (β = −3.514, 95% CI = [−3.855, −3.173]) and between better sleep quality and a higher MCS score (β = 3.027, 95% CI = [2.692, 3.361]). Changes in sleep medication use yielded an effect size of f2 = 0.024, and an increase in sleep medication use was associated with a lower MCS score (β = −4.567, 95% CI = [−5.193, −3.940]) and a decrease in sleep medication use a higher MCS score at Wave 4 (β = 3.106, 95% CI = [2.279, 3.933]).
Predictors of Wave 4 MCS Score by Wave 1 MCS Score, Potential Confounders at Baseline, and Changes in Sleep Parameters Across the Two Assessment Points.
| Predictors/confounders | Model 1: Wave 1 MCS + confounders + change in sleep quantity (n = 20650) | Model 2: Wave 1 MCS + confounders + change in sleep quality (n = 21448) | Model 3: Wave 1 MCS + confounders + change in sleep medication (n = 21286) |
|---|---|---|---|
| Wave 1 MCS | −0.572 (−0.587, −0.558) | −0.640 (−0.655, −0.625) | −0.581 (−0.595, −0.567) |
| Male | 1.158 (0.884, 1.433) | 0.954 (0.691, 1.218) | 1.068 (0.797, 1.340) |
| Age | 0.092 (0.084, 0.101) | 0.087 (0.079, 0.095) | 0.095 (0.087, 0.104) |
| Asian | −0.932 (−1.545, −0.319) | −1.425 (−2.011, −0.838) | −1.152 (−1.757, −0.548) |
| Black | 1.330 (0.284, 2.376) | 0.656 (−0.327, 1.640) | 0.814 (−0.207, 1.835) |
| Mixed | 0.193 (−1.046, 1.433) | 0.592 (−0.585, 1.770) | 0.795 (0.421, 2.010) |
| Other | −0.466 (−1.837, 0.905) | −0.851 (−2.136, 0.435) | −0.382 (−1.700, 0.936) |
| BMI | −0.037 (−0.064, −0.010) | −0.014 (−0.040, 0.011) | −0.044 (−0.070, −0.017) |
| Any other qualification | 0.141 (−0.155, 0.436) | 0.140 (−0.145, 0.425) | 0.028 (−0.264, 0.321) |
| No qualification | −0.446 (−0.899, 0.007) | −0.502 (−0.930, −0.074) | −0.515 (−0.957, −0.072) |
| Part-time employment | 0.500 (0.097, 0.903) | 0.551 (0.163, 0.938) | 0.534 (0.136, 0.932) |
| Not in employment | −0.805 (−1.134, −0.476) | −0.772 (−1.083, −0.461) | −0.784 (−1.104, −0.465) |
| Sleep quantity—decrease | −2.628 (−3.038, −2.217) | ||
| Sleep quantity—increase | 1.531 (1.006, 2.055) | ||
| Sleep quality—worse | −3.514 (−3.855, −3.173) | ||
| Sleep quality—better | 3.027 (2.692, 3.361) | ||
| Sleep medication use—increase | −4.567 (−5.193, −3.940) | ||
| Sleep medication use—decrease | 3.106 (2.279, 3.933) |
BMI = body mass index; CI = confidence interval; MCS = SF-12 mental component summary; UKLHS = UK Household Longitudinal Survey. Model parameter estimates (95% CI) for each of the considered models. Confounders included Wave 1 MCS, age, sex, ethnicity, education and employment status, BMI, and baseline predictors of the sleep variables. For the confounders, the reference group for sex was “female,” race was “white,” employment status was “full time,” and education was “university first degree or above.” For each of the key sleep-change parameters, the reference group was “no change.” For each of the key sleep parameters, the reference group was “no change.” A higher MCS score indicates better mental health/functioning. Protective factors are marked by positive estimates and risk factors by positive estimates. Findings of more elaborated models with area of residence, urban/rural settlement, and monthly income as additional confounders are available on request.
Effects of Sleep Changes on Wave 4 PCS
Table 4 presents the results of the same analyses with Wave 4 PCS score as the outcome variables. Adjusted for Wave 1 PCS score and all potential confounders, changes in sleep quantity yielded an effect size of f2 = 0.009, and a decrease in sleep quantity was associated with a lower subsequent PCS score (β = −1.526, 95% CI = [−1.909, −1.143]), suggestive of poorer physical health, but no effect was found for an increase in sleep quantity (β = −0.071, 95% CI = [−0.419, 0.560]). Changes in sleep quality yielded an effect size of f2 = 0.023, and worse sleep quality was associated with a lower PCS score (β = −1.867, 95% CI = [−2.194, −1.539]) and better sleep quality a higher PCS score (β = 0.924, 95% CI = [0.604, 1.245]). Likewise, an increase in sleep medication use was associated with a lower PCS score (β = −3.024, 95% CI = [−3.610, −2.438]) and a decrease in sleep medication use a higher PCS score at Wave 4 (β = 2.633, 95% CI = [1.860, 3.406]), and changes in sleep medication use yielded an effect size of f2 = 0.015.
Predictors of Wave 4 PCS Score by Wave 1 PCS Score, Potential Confounders at Baseline, and Changes in Sleep Parameters Across the Two Assessment Points.
| Predictors/confounders | Model 1: Wave 1 PCS + confounders + change in sleep quantity (n = 20650) | Model 2: Wave 1 PCS + confounders + change in sleep quality (n = 21448) | Model 3: Wave 1 PCS + confounders + change in sleep medication (n = 21286) |
|---|---|---|---|
| Wave 1 PCS | −0.414 (−0.427, −0.401) | −0.424 (−0.437, −0.411) | −0.417 (−0.430, −0.404) |
| Male | 0.122 (−1.33, 0.377) | −0.035 (−0.287, 0.217) | 0.022 (−0.230, 0.275) |
| Age | −0.098 (−0.106, −0.090) | −0.104 (−0.112, −0.096) | −0.095 (−0.103, −0.087) |
| Asian | −1.744 (−2.316, −1.172) | −1.963 (−2.525, −1.401) | −1.894 (−2.460, −1.329) |
| Black | −0.701 (−1.676, 0.275) | −1.243 (−2.185, −0.301) | −1.314 (−2.269, −0.359) |
| Mixed | −0.935 (−2.091, 0.220) | −1.272 (−2.400, −0.144) | −1.137 (−2.274, −0.001) |
| Other | −0.303 (−1.581, 0.976) | −0.822 (−2.054, 0.409) | −0.607 (−1.840, 0.625) |
| BMI | −0.117 (−0.142, −0.091) | −0.117 (−0.142, −0.092) | −0.129 (−0.154, −0.104) |
| Any other qualification | −0.859 (−1.135, −0.583) | −0.932 (−1.205, −0.658) | −0.971 (−1.245, −0.697) |
| No qualification | −1.816 (−2.240, −1.391) | −1.792 (−2.204, −1.379) | −1.847 (−2.263, −1.431) |
| Part-time employment | −0.437 (−0.813, −0.061) | −0.477 (−0.849, −0.106) | −0.449 (−0.821, −0.077) |
| Not in employment | −2.013 (−2.325, −1.702) | −2.027 (−2.330, −1.725) | −2.001 (−2.263, −1.431) |
| Sleep quantity—decrease | −1.526 (−1.909, −1.143) | ||
| Sleep quantity—increase | −0.071 (−0.419, 0.560) | ||
| Sleep quality—worse | −1.867 (−2.194, −1.539) | ||
| Sleep quality—better | 0.924 (0.604, 1.245) | ||
| Sleep medication use—increase | −3.024 (−3.610, −2.438) | ||
| Sleep medication use—decrease | 2.633 (1.860, 3.406) |
BMI = body mass index; CI = confidence interval; PCS = SF-12 physical component summary. Model parameter estimates (95% CI) for each of the considered models. Confounders included Wave 1 PCS, age, sex, ethnicity, education and employment status, BMI, and baseline predictors of the sleep variables. For the confounders, the reference group for sex was “female,” race was “white,” employment status was “full time,” and education was “university first degree or above.” For each of the key sleep-change parameters, the reference group was “no change.” For each of the key sleep parameters, the reference group was “no change.” A higher PCS score indicates better physical health/functioning. Protective factors are marked by positive estimates and risk factors by positive estimates. Findings of more elaborated models with area of residence, urban/rural settlement, and monthly income as additional confounders are available on request.
Sensitivity Analysis
We performed our analysis on each of the imputed data sets to investigate the sensitivity of our conclusions relative to the complete case analysis. The conclusions drawn from our analyses did not differ using the imputed data sets.
DISCUSSION
Changes in all sleep parameters were associated with subsequent measures of health and well-being. There was a high level of consistency across the findings from different analyses by outcome, indicating that poorer outcomes were predicted by a reduction in sleep duration, a decrease in sleep quality, and an increase in sleep medication use. Better outcomes on the other hand were predicted by an increase in sleep duration, an improvement in quality, and a reduction in sleep medication use. Importantly, effects of these sleep parameters were independent of baseline health status and a number of known confounders.
Of all predictors, effects on health and well-being were largest for changes in sleep quality (f2 = 0.021−0.086), followed by changes in sleep medication use (f2 = 0.014−0.021) and then changes in sleep quantity (f2 = 0.008−0.014) (see Figure 2). While negative changes in sleep generally had larger effects on health and well-being, positive changes in sleep were associated with an up to 2-point reduction on the GHQ-12 and a 3-point increase on the MCS and PCS. These levels of change on the MCS and PCS translate to “some less” to “a lot less” physical and mental role limitations according to the SF-12 scoring and interpretation manual.27 Changes on the GHQ are comparable with those seen in mental health professionals completing a 8-week program of mindfulness-based cognitive therapy designed to improve psychological well-being (1.6-point reduction at 20-week follow-up).25 They are also comparable with the average improvement in well-being (1.4-point reduction) shown by UK BHPS lottery winners 2 years after a medium-sized (£1000–£120000 in 1998 money) lottery win.26
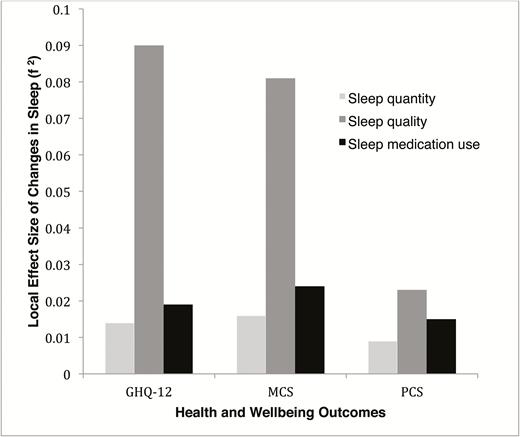
A visual summary of the local effect sizes of changes in sleep quantity, sleep quality, and sleep medication use between Wave 1 and Wave 4 assessments, by health and well-being outcomes at Wave 4. The local effect sizes shown above quantify the proportion of variance explained by adding a sleep-change predictor to the model with confounders alone.
These findings were largely consistent with our hypotheses, except for two unexpected observations. First, while an increase in sleep duration was associated with better MCS score, it was not associated with better PCS score at 4 years. This suggests that benefits of longer sleep do not necessarily emerge at the same speed or magnitude across different health domains. Benefits of longer sleep on physical health may take longer to emerge and may only be apparent in subgroups of short sleepers clocking <6 hours of sleep per night (n = 2867; 12% of the current sample at baseline). Second, changes in sleep quality were associated with subsequent health and well-being. This contrasts with the comparisons derived from a previous Finnish study, in which no effect on mortality was found for changes in sleep quality but consistent effects were observed for both changes in sleep quantity and an increase in sleep medication use.22 Arguably, mortality is a much broader and more distant measure of health and well-being. Differences in findings may also be explained by differences in sample constitution (Finnish vs. British) and length of follow-up (22 vs. 4 years). That said, the current finding challenges the predominant focus on sleep quantity in some of the public health messages.28 Sleep may be better understood as a multidimensional experience, whereby quality of sleep is just as important as quantity.
The current study benefited from the methodological strengths of UKHLS, which included its large sample size, representativeness of the sample, repeated assessments of the same individuals over multiple points, derived weights to account for sample attrition, and the use of well-validated health outcome measures.24 However, the assessment of sleep was relatively coarse, and each of the sleep parameter was measured with individual items derived from the PSQI. Objective measurement of sleep was not available; self-report data on sleep were arguably vulnerable to recall and reporting biases. We did not have information about the dose, frequency, and duration of the sleep medication used. We also did not have information about the presence of any clinical sleep disorders (e.g., sleep apnea) and thus were unable to control these potential confounds in our analysis. However, we understand that the UKHLS did collect self-reported information on chronic medical conditions that may be linked to sleep (e.g., diabetes, asthma, cancer, epilepsy, depression, coronary heart disease etc.). It is possible for future research to run subgroup analysis to fine-tune our understanding of the sleep and health and well-being link as moderated by preexisting medical conditions.
We specifically examined the effect of changes in sleep and its impact on overall health and well-being over time, as this approach allowed us to establish temporal precedence between sleep improvement/disruptions and subsequent outcomes. Although conclusions concerning the causality between sleep improvement and better health cannot be drawn, integration of extant evidence from observational, experimental, and clinical studies suggests that the pathway from sleep changes to health can be both direct and indirect, through their effects on the circadian, homeostatic, metabolic, immune, pain, endocrine, cardiovascular, emotions, and memory systems and on the brain structures involved in the regulation of these overlapping systems.13,19,39–46 Analyses reported in this study were not designed to uncover the possible triggers of changes in sleep. There are many possible triggers, including the natural process of aging and intentional and unintentional changes in health, diet, medication/substance use, lifestyle, exercise patterns, work conditions, and life circumstances (e.g., divorce, unemployment). It would be a challenge for future research to provide a comprehensive list of these triggers and elucidate the neurophysiological mechanisms through which changes in these factors translate into sleep disruption or improvement. That said, the public health benefits of identifying what constitutes an effective avenue for protecting and improving sleep at the population level would be considerable. An excellent example is found in the body of work examining the association between sleep deprivation and medical errors, which has generated credible evidence suggesting that sleep deprivation as a result of long shift hours can increase daytime fatigue, clinical performance deficit, and medical errors among hospital residents.47–50 Recent intervention studies have shown that these undesirable consequences can be prevented or significantly reduced with innovations in shift scheduling that aims to eliminate extended shift and reduce work hours51 and work policies that aim to safeguard a protected sleep period (of 5 hours) during extended (up to 30 hours) overnight in-hospital duty hours.52
In raising the public’s awareness of sleep and health, although the emphasis on protecting a critical amount of sleep is important, the focus of the message should be broadened to include the importance of getting sleep of good quality and of reducing dependence on sleep medication. On the latter point, the current study found that at baseline 16% of the sample reported use of sleep medication in the past month, with 8.8% taking sleep medication three or more times a week. This level of prevalence is higher than that reported in France (10%; 6.17% on a chronic and frequent basis)53 and the estimated level of prescribed hypnotic use in the United States (4%).54 Of relevance, those who increased their use of sleep medication over time reported worse outcomes despite the intended purpose of the medication to improve sleep and overall health and well-being. These findings align with work by Kripke et al.55 and Sivertsen et al.,56 revealing a dose–response relationship of hypnotic prescriptions with hazards of cancer and even death.
Overall, the current study has provided fresh evidence in support of a temporal effect of sleep changes on health and well-being. This relationship applies to both negative and positive changes in sleep duration, sleep quality, and use of sleep medication. Sleep is therefore a logical and feasible target for preventative health intervention.
SUPPLEMENTARY MATERIAL
Supplementary data are available at SLEEP online.
DISCLOSURE STATEMENT
None declared.
REFERENCES
Author notes
Address correspondence to: Nicole K. Y. Tang, DPhil, CPsych, Department of Psychology, University of Warwick, Gibbet Hill Road, Coventry CV4 7AL, UK. Telephone: 44(0)2476-150556; Email: n.tang@warwick.ac.uk


Comments