


Abstract
Previous studies have shown that coffee consumption may suppress the production of melatonin in pinealocytes through competitive inhibition of adenosine A2 receptors by caffeine. We investigated the impact of lifetime coffee consumption on pineal gland volume and the resulting effects on sleep quality.
We enrolled 162 cognitively normal elderly individuals among the participants in the Korean Longitudinal Study on Cognitive Aging and Dementia. We evaluated the patterns and amounts of coffee consumption using a study-specific standardized interview and assessed sleep quality using the Pittsburgh Sleep Quality Index. We measured the volume of pineal parenchyma (VPP) by manually segmenting the pineal gland on high-resolution three-dimensional T1-weighted magnetic resonance images. We examined the impact of lifetime coffee consumption on the VPP and the resulting effects on sleep quality using analysis of covariance, multiple linear regression, and mediation analyses.
We found that smaller VPP was associated with higher cumulative lifetime coffee consumption. Participants who consumed more than 60 cup-years of coffee had VPPs that were smaller by about 20% than individuals who consumed less than 60 cup-years of coffee. The VPP mediated the association between lifetime coffee consumption and sleep efficiency and quality.
Our findings suggest that high lifetime coffee consumption may reduce VPP, and that this reduction in VPP may impair the quality of sleep in late life.
Increasing evidence supports a link between coffee consumption and the circadian system and sleep. This study adds new information showing that the pineal gland volume decreased as the amount of lifetime coffee consumption increased in humans. The decrease of pineal volume due to high lifetime coffee consumption was associated with poor sleep efficiency and quality. These findings improve our understanding of the impact of coffee consumption on the human pineal gland and provide insight into the relationship between pineal gland volume and sleep.
Introduction
The pineal gland is a small neuroendocrine organ located in the midline of the brain [1]. Its primary function is the synthesis and secretion of N-acetyl-5-methoxytryptamine (melatonin), which is a key metabolic regulator of circadian rhythm and sleep [2]. In humans, the pineal gland is fully developed at around the age of 2 years, and its size and weight do not seem to change later in life [3–5]. About 80% of the pineal gland consists of melatonin-producing pinealocytes [1], and the volume of pineal gland (VPG) has been shown to be positively correlated with melatonin levels in normal individuals [6, 7]. Recent studies have reported that physiological or pathological conditions related to changes in melatonin secretion altered the VPG in humans [8, 9].
An increasing number of studies have investigated the impact of coffee consumption on the circadian system in both animals and humans at the cellular and behavioral levels [10–13]. Coffee is one of the most consumed caffeine-containing beverages in the world [14], and caffeine (1,3,7-trimethylxanthine) is a nonselective antagonist of all adenosine receptor subtypes [15]. Adenosine increases melatonin production in the pineal gland in a dose-dependent manner [16] by activating adenosine A2 (AA2) receptors in pinealocytes [17, 18]. Activation of AA2 receptors increases the levels of intracellular cyclic adenosine monophosphate and arylalkylamine N-acetyltransferase, which is the rate-limiting enzyme in melatonin synthesis [19, 20]. Therefore, caffeine may suppress the production of melatonin in pinealocytes through competitive inhibition of the AA2 receptor [15, 21]. Compared to consumption of decaffeinated coffee, caffeinated coffee consumption has been shown to decrease the levels of 6-sulfatoxymelatonin, which is a major metabolite of melatonin, by over 50% in urine [22]. Healthy participants who consume caffeine have been shown to have lower nighttime melatonin levels than placebo-consuming controls [23, 24]. A recent systematic review reported that coffee has deleterious effects on human sleep such as prolongation of sleep latency, reduction of total sleep time and efficiency, and worsening of perceived sleep quality [25], and middle-aged adults were more sensitive to the deleterious effects of caffeine on sleep than young adults [26]. Therefore, given that positive association between melatonin levels and VPG, chronic coffee consumption may reduce VPG by prolonged suppression of melatonin production, which may worsen sleep quality in later life.
However, the cumulative effects of lifetime coffee consumption on the pineal gland have never been investigated in humans. Although the association between VPG and sleep quality has been studied in humans [7], whether the impact of lifetime coffee consumption on the VPG mediates its effects on human sleep has never been studied. In this study, we investigated the impact of the amount of lifetime coffee consumption (ALCC) on VPG and the resulting effects on sleep quality in cognitively normal elderly individuals.
Methods
Participants
We examined 162 community-dwelling and cognitively normal elderly residents of Seongnam, Korea. The present samples comprised 85 men and 77 women aged 60–94 years, and mean age of 72.25 ± 6.73 years old, and were Koreans (Table 1). These participants had participated in the Korean Longitudinal Study on Cognitive Aging and Dementia (KLOSCAD), which is a nationwide population-based prospective elderly cohort study on cognitive aging and dementia that was launched in 2009. To construct a representative cohort of elderly Koreans, KLOSCAD researchers randomly sampled 30 villages or towns in 13 selected districts across South Korea and then used residential rosters to randomly select 10% of the residents older than 60 years in urban areas and 20% of the residents older than 60 years in rural areas. A total of 6818 participants participated in the baseline KLOSCAD assessment, which was conducted from November 2011 to September 2012. These participants have been examined every 2 years [27]. All participants were fully informed regarding study participation and written informed consent was obtained from the participants or their legal guardians. The study was approved by the Institutional Review Board of the Seoul National University Bundang Hospital (SNUBH).
Demographic and clinical characteristics of participants stratified according to the ALCC
| Total (N = 162) | ALCC-L* (N = 54) | ALCC-M† (N = 54) | ALCC-H‡ (N = 54) | Statistics | ||
|---|---|---|---|---|---|---|
| p | Post hoc§ | |||||
| Age (years, mean ± SD)|| | 72.25 (6.73) | 72.59 (7.24) | 70.83 (5.40) | 73.33 (7.25) | 0.140 | - |
| Men, no. (%)¶ | 85 (52.47) | 17 (31.48) | 27 (50.00) | 41 (75.93) | <0.001 | - |
| Education (years, mean ± SD)|| | 11.33 (5.07) | 9.56 (4.93) | 11.52 (5.00) | 12.93 (4.78) | 0.002 | 1 < 3 |
| BMI (kg/m2, mean ± SD)|| | 24.11 (2.67) | 23.68 (2.52) | 23.93 (2.79) | 24.73 (2.65) | 0.102 | - |
| Age at onset of coffee consumption (years, mean ± SD)|| | 37.00 (16.64) | 56.47 (15.90) | 34.39 (13.04) | 27.35 (8.02) | <0.001 | 3 < 2 < 1 |
| Age at end of coffee consumption (years, mean ± SD)|| | 72.22 (9.65) | 73.83 (10.93) | 66.90 (10.29) | 76.00 (5.97) | 0.005 | 2 < 3 |
| DLCC (years, mean ± SD)|| | 29.53 (19.30) | 8.33 (11.32) | 34.44 (12.17) | 45.81 (10.11) | <0.001 | 1 < 2 < 3 |
| ADCC (cups/day, mean ± SD)|| | 1.67 (1.52) | 0.64 (0.71) | 1.30 (0.59) | 3.06 (1.72) | <0.001 | 1 < 2 < 3 |
| Current ADCC (cups/day, mean ± SD)|| | 1.44 (1.39) | 0.64 (0.77) | 1.29 (0.88) | 2.40 (1.39) | <0.001 | 1 < 2 < 3 |
| ALAC (standard unit-years, mean ± SD)|| | 27.35 (52.47) | 24.39 (66.91) | 25.89 (38.51) | 31.75 (48.71) | 0.764 | - |
| ALS (pack-years, mean ± SD)|| | 11.74 (19.82) | 5.21 (12.99) | 8.73 (15.53) | 21.28 (25.27) | <0.001 | 1, 2 < 3 |
| CIRS (points, mean ± SD)|| | 5.21 (2.81) | 5.15 (2.90) | 5.09 (2.72) | 5.39 (2.86) | 0.846 | - |
| PSQI (points, mean ± SD)|| | 6.03 (2.92) | 6.70 (2.97) | 4.94 (2.80) | 6.44 (2.72) | 0.003 | 2 < 1, 3 |
| Geriatric Depression Scale (points, mean ± SD)|| | 7.03 (5.05) | 7.54 (5.29) | 7.28 (5.41) | 6.28 (4.40) | 0.394 | - |
| Mini-Mental State Examination (points, mean ± SD)|| | 27.15 (2.33) | 26.52 (2.77) | 27.46 (2.04) | 27.42 (1.99) | 0.058 | - |
| VPP (mm3, mean ± SD)|| | 83.61 (26.85) | 90.46 (31.09) | 90.37 (22.75) | 70.00 (20.56) | <0.001 | 3 < 1, 2 |
| VPG (mm3, mean ± SD)|| | 90.10 (29.26) | 94.91 (33.64) | 96.69 (25.61) | 78.22 (24.79) | 0.002 | 3 < 1, 2 |
| logVPP (mean ± SD)|| | 4.38 (0.32) | 4.45 (0.33) | 4.47 (0.26) | 4.20 (0.31) | <0.001 | 3 < 1, 2 |
| Log-transformed VPG (mean ± SD)|| | 4.45 (0.33) | 4.49 (0.35) | 4.53 (0.28) | 4.31 (0.33) | 0.001 | 3 < 1, 2 |
*ALCC-L, low ALCC tertile group.
†ALCC-M, middle ALCC tertile group.
‡ALCC-H, high ALCC tertile group.
§Bonferroni post hoc comparisons.
||One-way analysis of variance.
¶Chi-square test.
Assessments of clinical characteristics and diagnosis
Geriatric psychiatrists with expertise in dementia research administered face-to-face standardized diagnostic interviews; physical and neurological examinations; laboratory tests, including complete blood cell counts, chemistry profiles, and serological tests for syphilis; echocardiography; and chest X-rays using the Korean version of the Consortium to Establish a Registry for Alzheimer’s Disease Assessment Packet (CERAD-K) Clinical Assessment Battery [28] and the Korean version of the Mini International Neuropsychiatric Interview [29]. A research neuropsychologist or trained research nurse administered the CERAD-K Neuropsychological Assessment Battery [28, 30], Digit Span Test [31], and Frontal Assessment Battery [32] to each participant. All participants performed -1.0 SD of the age-, gender-, and education-adjusted norms of elderly Koreans on the Mini-Mental State Examination [33]. We conducted brain computed tomography or magnetic resonance imaging (MRI) (T1-weighted, T2-weighted, and fluid-attenuated inversion recovery) if a participant was suspected to have a cognitive disorder. A panel of four research geriatric psychiatrists confirmed the final diagnosis for each participant. We diagnosed dementia and other Axis I mental disorders according to the diagnostic criteria of the Diagnostic and Statistical Manual of Mental Disorders, Fourth Edition for dementia [34] and mild cognitive impairment (MCI) according to the consensus criteria proposed by the International Working Group on MCI [35]. Participants were considered cognitively normal if they did not exhibit any evidence of cognitive impairment that altered daily activities and were functioning independently in the community.
We excluded participants with any of the following conditions: cognitive disorders, such as dementia and MCI; major psychiatric or neurologic disorders that affect cognitive function; alcohol abuse or dependence; any history of a brain tumor, traumatic brain injury, or exogenous melatonin use; medical disorders that affect the structure and/or function of the pineal gland; or abnormalities in pineal gland morphology, such as an extremely large cystic gland (diameter greater than 15.0 mm) [36, 37].
Assessment of coffee consumption
We evaluated the patterns and amounts of coffee consumption using a study-specific standardized interview that examined the average amount of daily coffee consumption (ADCC, cups/day) and ages at the start and end of coffee drinking (years). We calculated the duration of lifetime coffee consumption (DLCC, years) by subtracting the age at which coffee drinking started from the age at which coffee drinking ended. We estimated the ALCC (cup-years) by multiplying the ADCC by the DLCC. We then divided the participants according to their ALCC values into the following three groups: less than 21 cup-years (lowest-tertile group [ALCC-L], n = 54), 21–60 cup-years (middle-tertile group [ALCC-M], n = 54), and over 60 cup-years (highest-tertile group [ALCC-H], n = 54). We assumed that the participants did not change their coffee consumption habits during their lifetime.
Segmentation of the pineal gland
We acquired three-dimensional (3D) structural T1-weighted spoiled gradient echo MR images of the participants in Digital Imaging and Communications in Medicine format using a 3.0 Tesla GE SIGNA Scanner (GE Healthcare; Milwaukee, WI) within 3 months of the clinical assessments with the following parameters: acquired voxel size = 1.0 × 0.5 × 0.5 mm3, 1.0 mm sagittal slices with no inter-slice gap, echo time = 3.68 ms, repetition time = 25.0 ms, number of excitations = 1, flip angle = 90°, field of view = 240 × 240 mm, and 175 × 240 × 240 matrix in the x-, y-, and z- dimensions. We implemented a bias field correction to remove intensity inhomogeneity artifacts using Statistical Parametric Mapping software (version 8, SPM8; Wellcome Trust Centre for Neuroimaging, London; http://www.fil.ion.ucl.ac.uk/spm). We resliced the MR images into isotropic voxels (1.0 × 1.0 × 1.0 mm3). To adjust for interindividual variations in brain volume, we measured the intracranial volume (ICV) using Freesurfer software (version 5.3.0; http://surfer.nmr.mgh.harvard.edu). No abnormalities were found in visual analyses of the MR images by research geropsychiatrists or in formal reports made by neuroradiologists of the SNUBH.
Trained researchers who were blind to the demographics, clinical characteristics, and coffee consumption data constructed a 3D mask of each pineal gland by manually segmenting the pineal gland slice-by-slice on the resliced T1-weighted MR images using ITK-SNAP (version 3.4.0; http://www.itksnap.org) volumetric imaging software [38]. We segmented the pineal glands primarily on the sagittal planes and corroborated the results on the axial and coronal planes. We identified the pineal gland using the following structures as guides: the quadrigeminal cisterna, posterior part of the third ventricle, superior colliculus, and habenula. Except for the part connected to the habenula, the boundaries of the pineal gland were clear because it is surrounded by cerebrospinal fluid. We carefully differentiated the pineal gland from the adjacent vascular structures, especially the paired internal cerebral veins and the vein of Galen. We defined a pineal cyst as an area of homogenous intensity that was isointense to cerebrospinal fluid in T1 sequence images [39, 40] with a diameter of 2.0 mm or greater [39]. We could not correct for the volume of pineal calcification because additional brain computed tomography scans or high-resolution T2-weighted MR imaging were not available. We measured the VPG and volume of pineal cysts (VPC). We estimated the volume of pineal parenchyma (VPP) by subtracting VPC from VPG.
To determine inter-rater reliability, we calculated the intraclass correlation coefficient (ICC) for 30 participants who were randomly selected from the 162 participants. The ICCs were 0.957 (95% confidence interval [CI] = 0.910, 0.980) for the VPG and 0.970 (95% CI = 0.936, 0.986) for the VPC. The VPG was strongly correlated with the VPP (r = 0.918, p < 0.001) and the VPC (r = 0.398, p < 0.001).
Assessment of sleep quality and confounding factors
We evaluated the sleep quality of the participants using the Pittsburgh Sleep Quality Index (PSQI) [41]. This self-report questionnaire assesses the self-reported sleep quality during the past month, and the global PSQI score ranges from 0 to 21, with higher scores indicate poorer sleep quality. We estimated sleep efficiency (%) by dividing the self-reported actual sleep duration by the total time spent in bed.
We also evaluated the following potentially confounding factors for the associations among coffee consumption, VPG, and sleep in the face-to-face interviews and physical examinations: age, body mass index (BMI), amount of lifetime alcohol consumption (ALAC, standard unit-years), amount of lifetime smoking (ALS, pack-years), and comorbid diseases as assessed using the Cumulative Illness Rating Scale (CIRS) [42].
Statistical analysis
We compared continuous variables using one-way analyses of variance and categorical variables using chi-square tests between groups. Since Shapiro-Wilk test found that the distribution of VPP values were not normal, we employed log-transformed volume of pineal parenchyma (logVPP) in the analyses. We examined the effect of ALCC on logVPP using a multiple linear regression model adjusted for the following potential confounding factors: age, BMI, ICV, ALAC, ALS, CIRS score, and global PSQI score. In examining the effects of ADCC and DLCC on logVPP, we also conducted a multiple linear regression analysis that computed ADCC and DLCC as independent variables (IVs) and age, BMI, ICV, ALAC, ALS, CIRS score, and global PSQI score as covariates. We then compared logVPP among participants in the ALCC tertile groups (ALCC-L, ALCC-M, and ALCC-H) using analysis of covariance with Bonferroni post hoc comparisons. In these analyses, we adjusted for the covariates of age, BMI, ICV, ALAC, ALS, CIRS score, and global PSQI score. We assessed the homogeneity of variance using Levene’s test. We examined the association between logVPP and sleep quality using multiple linear regression analyses. In these analyses, we adjusted for age, sex, BMI, ICV, ALAC, ALS, CIRS score, and current ADCC, and assessed multicollinearity using collinearity statistical tests (tolerance and variance inflation factor).
For all analyses, a two-sided p-value less than 0.05 was considered statistically significant, and Bonferroni corrections were employed in multiple comparisons. We performed all statistical analyses using the Statistical Package for the Social Sciences (SPSS) for Windows (version 20.0; IBM Corporation; Armonk, NY).
To determine the mediation effects of the logVPP on the association between ALCC and sleep quality, we used the bootstrapping method utilizing the PROCESS macro developed for SPSS [43], which allows for the examination of mediation effects while adjusting for confounding factors (age, sex, BMI, ICV, ALAC, ALS, and CIRS score) in the model. Bootstrapping provides an estimate of the indirect effect of the IV on the dependent variable (DV), through the mediator variable (MV) based on the distributions of resampled datasets. In the present study, path a represents the effect of the IV (ALCC) on the MV (logVPP) and path b represents the effect of the MV on the DV (sleep efficiency or sleep quality). Path c represents the total effect of the IV (not controlling for the MV) on the DV, while path c’ indicates the direct effect of the IV (controlling for the MV) on the DV. Each of analyses was based on 5000 bootstrap samples with a bias-corrected 95% CI to calculate the contribution of the MV (indirect effect, path a × b). In this toolbox, the indirect effect is considered significant at a p-value less than 0.05 when the provided CI does not include the value of 0 [43].
Results
The logVPP was inversely associated with ALCC (adjusted R2 = 0.122, β = −0.273, p = 0.002). LogVPP decreased by 0.096 mm3 as the cup-years of coffee consumption increased. When we computed DLCC and ADCC instead of ALCC, logVPP was inversely associated with DLCC (adjusted R2 = 0.130, β = −0.199, p = 0.017) but not with ADCC (adjusted R2 = 0.119, β = −0.102, p = 0.258) (Figure 1). When we divided the participants into three groups according to ALCC tertiles, the VPPs of the highest-tertile group were about 20% smaller than those of the middle- and lowest-tertile groups (F2,159 = 11.806, p < 0.001) (Table 1). These differences remained statistically significant after adjusting for confounding factors, such as age, BMI, ICV, ALAC, ALS, CIRS score, and PSQI score (Figure 2). In the analysis of covariance, the assumption of equal variances among the groups was found (p > 0.05).
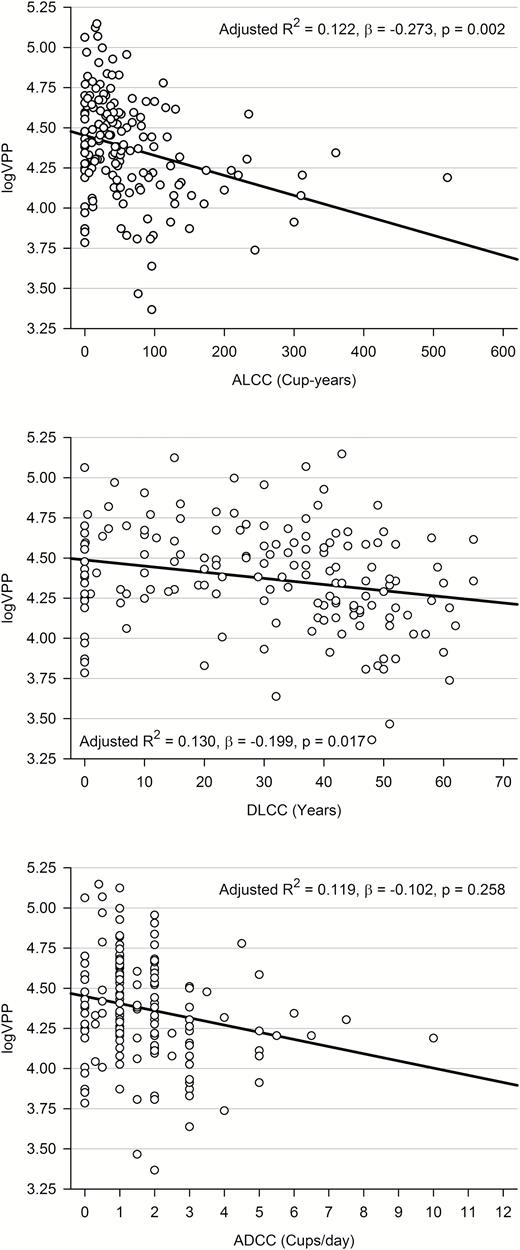
Associations between logVPP and patterns and amounts of coffee consumption: ALCCa, DLCCb, and ADCCc. aMultiple linear regression analysis adjusted for age, BMI, ICV, ALAC, ALS, CIRS, and PSQI. bMultiple linear regression analysis adjusted for age, BMI, ICV, ALAC, ALS, CIRS, PSQI, and current ADCC. cMultiple linear regression analysis adjusted for age, BMI, ICV, ALAC, ALS, CIRS, PSQI, and DLCC.
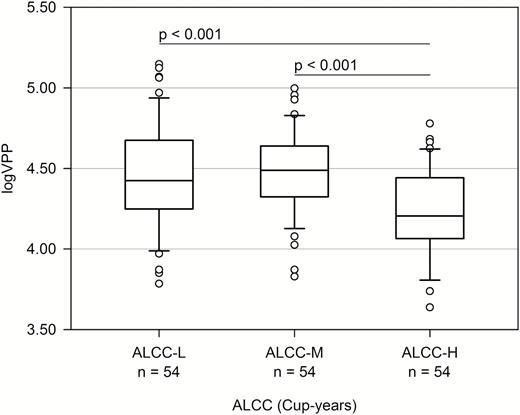
Comparisons of logVPP between the tertile groups of the ALCCa. aAnalysis of covariance adjusted for age, BMI, ICV, ALAC, ALS, CIRS, and PSQI.
As summarized in Table 2, logVPP was inversely associated with global PSQI score (adjusted R2 = 0.131, β = −0.214, p = 0.008), indicating that smaller VPPs may be associated with poorer sleep quality. logVPP was associated with sleep efficiency (adjusted R2 = 0.068, β = 0.204, p = 0.014), indicating that smaller VPPs may be associated with lower sleep efficiency. Global PSQI scores increased by 0.023 points and sleep efficiency decreased by 0.091% for each 1-mm3 decrease in VPP. In the multiple linear regression models, the variance inflation factors were below 2.0. When we reran the analyses after excluding one outlier, the results were not changed. The outlier had the amounts of coffee consumption beyond 3 SDs from the mean (ADCC = 10 cups/day, DLCC = 52 years, and ALCC = 520 cup-years).
Associations between the logVPP and sleep efficiency and quality*
| logVPP (N = 162) | ||
|---|---|---|
| β† | p | |
| Sleep efficiency (%) | 0.204 | 0.014 |
| PSQI score (points) | −0.214 | 0.008 |
| logVPP (N = 162) | ||
|---|---|---|
| β† | p | |
| Sleep efficiency (%) | 0.204 | 0.014 |
| PSQI score (points) | −0.214 | 0.008 |
*Multiple linear regression analyses adjusted for age, sex, BMI, ICV, ALAC, ALS, CIRS, and current ADCC.
†Standardized partial regression coefficient.
We performed mediation analysis to determine whether logVPP mediated the association between the ALCC and sleep efficiency and quality. As shown in Table 3, models A and B revealed a significant mediating role of logVPP on the association between ALCC and either sleep efficiency (indirect effect = −0.0091, standard error [SE] = 0.0049, bias-corrected 95% CI = −0.0217, −0.0019) or sleep quality (indirect effect = 0.0022, SE = 0.0011, bias-corrected 95% CI = 0.0005, 0.0046). The mediator (path a × b) explained 76% of the total effect (path c) of the ALCC on sleep efficiency and 63% of its effect on sleep quality. The reported coefficients are unstandardized. These results indicated that the association between greater ALCC and lower sleep efficiency and quality in late life may be partly mediated by the reduction in VPP.
Mediation models for the effects of the ALCC on sleep efficiency and quality through logVPP*
| Coefficient ± SE (mediation, %) | t | p | Bias corrected 95% CI | |
|---|---|---|---|---|
| Model A (N = 162) | ||||
| a (ALCC – logVPP) | −0.0012 ± 0.0004 | −3.2000 | 0.0017 | - |
| b (logVPP – sleep efficiency) | 7.7011 ± 3.1253 | 2.4641 | 0.0149 | - |
| c ([ALCC – sleep efficiency], not controlled for logVPP) | −0.0119 ± 0.0145 | −0.8223 | 0.4122 | - |
| c’ ([ALCC – sleep efficiency], controlled for logVPP) | −0.0028 ± 0.0148 | −0.1920 | 0.8480 | - |
| a × b (ALCC – logVPP – sleep efficiency) | −0.0091 ± 0.0049 (76) | - | - | −0.0217, −0.0019 |
| Model B (N = 162) | ||||
| a (ALCC – logVPP) | −0.0012 ± 0.0004 | −3.2000 | 0.0017 | - |
| b (logVPP – sleep quality) | −1.8174 ± 0.7296 | −2.4910 | 0.0138 | - |
| c ([ALCC – sleep quality], not controlled for logVPP) | 0.0034 ± 0.0034 | 1.0103 | 0.3140 | - |
| c’ ([ALCC – sleep quality], controlled for logVPP) | 0.0013 ± 0.0034 | 0.3707 | 0.7114 | - |
| a × b (ALCC – logVPP – sleep quality) | 0.0022 ± 0.0011 (63) | - | - | 0.0005, 0.0046 |
*Mediation analyses adjusted for age, sex, BMI, ICV, ALAC, ALS, and CIRS.
Discussion
This is the first study to identify the ALCC as an important dietary factor affecting VPP in humans. Notably, we found that higher ALCC was associated with smaller logVPP. Although three to four cups of coffee per day (300–400 mg caffeine/day) are generally regarded as safe for most healthy adults with no medical issues [14], this study showed that participants who consumed more than 60 cup-years of coffee (e.g. three cups per day for over 20 years) had smaller logVPPs than those who consumed less than 60 cup-years of coffee. Furthermore, the reduction of VPP mediated the effect of ALCC on late-life sleep efficiency and quality.
Higher ALCC may reduce VPP in several ways. First, the high caffeine content of coffee may directly reduce VPP by suppressing the production of melatonin through its competitive antagonism of AA2 receptors [15–20]. A previous in vitro study of isolated rat pineal glands confirmed that caffeine directly reduces the amount of melatonin produced by stimulating adenosine receptors [21]. Given that caffeine decreases melatonin levels [22–24] and the melatonin levels are positively correlated with VPP [6, 7], chronic coffee consumption may reduce VPP by suppressing melatonin production in pinealocytes. Second, caffeine may reduce VPP indirectly. Since adenosine receptors are present in the suprachiasmatic nucleus [44], which acts as the central circadian clock and innervates the pineal gland through multisynaptic connections [45], caffeine may cause desynchronization in various circadian systems that are driven by the suprachiasmatic nucleus [46, 47]. These circadian disruptions have been found to cause or accelerate neurodegenerative processes [48, 49]. Third, coffee is a complex mixture of chemical compounds with different physiological effects [50]. Although caffeine is a major component of coffee [51], bioactive chemicals in coffee other than caffeine may also influence VPP. For example, flavonoids, which are abundant in coffee, have been shown to inhibit the activity of arylalkylamine N-acetyltransferase and decrease the nocturnal serum levels of melatonin in rats [52]. Finally, genetic polymorphisms that may be linked to habitual coffee consumption [53] and the large individual differences in physiological responses to coffee [54] may also influence VPP.
We found that smaller logVPPs were associated with lower sleep efficiency and quality. The mediation analyses indicated that greater ALCC indirectly led to lower sleep efficiency and poor sleep quality through the reduction of logVPP. The effects on the logVPP mediated 63%–76% of the total effect of ALCC on sleep efficiency and quality. To our knowledge, this is the first study to demonstrate the mediating role of VPP on the association between coffee consumption and sleep efficiency and quality in humans. Despite inter-subject variability in melatonin circadian rhythms [55] and the modulating effect of melatonin on sleep-wake control, many studies have linked impaired melatonin production to poor sleep quality and sleep disorders [56–59]. In a recent study on a large sample of community-dwelling elderly individuals, low levels of nocturnal melatonin were shown to be associated with high daytime sleepiness, low sleep efficiency, and short sleep time [60]. Taken together, the results of the current study indicate that high ALCC may contribute to the diminished production of melatonin and decreased VPP, which then result in lower sleep efficiency and poor sleep quality.
When we compared PSQI scores between the ALCC tertile groups, the ALCC-M group showed better sleep quality than the ALCC-L and ALCC-H groups. The Brighton sleep survey also reported this U-shape association between the amount of coffee consumption and sleep quality. In that study, moderate coffee consumers had a shorter sleep latency, fewer awakening, and were more satisfied with their sleep than heavy consumers or those who abstained from caffeine [61]. Although we did not directly investigate why the middle tertile group showed better sleep quality than the low and high tertile groups, we may speculate a couple of factors that may underlie this U-shape association. First, the individuals in the low tertile group might have refrained from coffee due to their sleep problems while those in the high tertile group might have sleep problems due to high coffee consumption. Since the current study was cross-sectional, we could not directly show whether this was the case or not. Second, unknown factors that were not adjusted in the current analysis might have confounded the association of the amount of coffee consumption and sleep quality. The effects of caffeine on sleep can be modulated by inter-individual variances of various factors including genetic predispositions and life styles [25]. Complex interactions between such factors could have resulted in the U-shape association. For example, moderate coffee drinking may be related to the lifestyle that can improve sleep quality. On the other hand, among individuals with low or never drinking coffee, some medical conditions (e.g. vascular risk factors) may be overrepresented and may negatively affect self-reported sleep quality.
There is no consensus regarding normal values for pineal gland volume in humans. In this study, we directly quantified absolute VPP, VPG, and VPC using high-resolution 3D T1-weighted sequences. The mean VPP and VPG in our samples were 83.61 ± 26.85 mm3 and 90.10 ± 29.26 mm3, respectively. Several previous studies have measured pineal gland volume in normal participants using high-resolution 3D MR imaging. In these studies, pineal volume ranged from 94.2 mm3 to 125 mm3 [6, 7, 62, 63]. Discrepancies in the results of these studies might be due to differences in imaging technique, study population, and/or selection criteria (e.g. age, sex, health conditions, and medical history), and/or the highly heterogeneous morphology of the pineal gland. In particular, pineal cysts are potential confounders because they are benign and often asymptomatic lesions of the pineal gland that are commonly detected in autopsy [64] and imaging series [40] in individuals of all ages. We believe that our careful exclusion of pineal cysts increased the accuracy and validity of our VPG and VPP measurements. We measured the VPC to correct for hormonally inactive tissue [6, 65] and excluded individuals with extremely large cystic glands from this study because their inclusion might have biased the estimations of VPP. In our subject sample, the amount of coffee consumption was not associated with VPC, and VPC was not associated with the PSQI component scores.
This study has several limitations. First, other sources of caffeine, such as tea, soft drinks, energy drinks, and chocolate products, were not evaluated, and caffeinated coffee and decaffeinated coffee were not differentiated. However, in Korea, coffee has been identified as a major source of dietary caffeine intake [51], and decaffeinated coffee is not commonly consumed in Korea [66]. Second, since the patterns and amounts of coffee consumption were evaluated based on self-reports, we cannot rule out the possibility of nondifferential misclassification bias that could have over- or underestimate the real amount of coffee consumed. Although self-reports are subject to recall bias, self-reported habitual coffee consumption has been shown to be reliable and a valid way to evaluate the real amount of consumption. In fact, self-reports are commonly used to estimate long-term consumption in most coffee-related studies [67, 68]. In addition, a recent study has shown that habitual patterns of coffee drinking remain relatively stable over time [69]. Moreover, because this study included cognitively normal individuals who were examined only through comprehensive clinical and neuropsychological assessments, it seems unlikely that systematic errors would be made in the reporting of their consumption patterns. Third, we did not measure endogenous melatonin levels. Fourth, conventional MRI sequences such as T1-weighted imaging can be bias by many age-related changes such as myelin or iron content [70], and thus structure delimitation using T1-weighted images can be greatly susceptible to these biases. Sensitive and unbiased acquisition techniques such as quantitative multiparameter mapping are warranted in the future studies. Finally, although the impact of calcification on pineal physiology remains unclear, a previous study reported that the degree of pineal calcification was associated with sleep-related parameters in humans [71]. Furthermore, calcifications can appear hypointense on T1-weighted images, which may lead underestimation of the VPP. However, we could not correct for the volume of pineal calcification since brain CT or high-resolution T2-weighted images were not available. Future studies using more sensitive and unbiased imaging techniques, such as multiparameter mapping or susceptibility-weighted imaging, are needed to clarify this issue.
Conclusion
In conclusion, elderly individuals who consumed 60 cup-years of coffee or more had VPPs that were smaller by about 20% than individuals who consumed less than 60 cup-years of coffee. This reduction in VPP may have a role as a potential mediator, in explaining the association between lifetime coffee consumption and sleep efficiency and quality in elderly individuals. Given the large amount of coffee consumption across the world and the rapid increase in the use of caffeine in children and adolescents over the past 30 years [72], we should be concerned with the potential adverse effects of lifetime coffee consumption.
Funding
This study was supported by a grant from the Korean Health Technology R&D Project, Ministry of Health, Welfare, Republic of Korea (grant no. HI09C1379 [A092077]).
Conflict of interest statement. None declared.
Address where work was conducted: This study was performed at Seoul National University Bundang Hospital, 82 Gumi-ro 173 beon-gil, Bundang-gu, Seongnam-si, Gyeonggi-do, 13620, South Korea.


Comments