


Abstract
To examine the effects of moderate sleep restriction (SR) on body weight, body composition, and metabolic variables in individuals undergoing caloric restriction (CR).
Overweight or obese adults were randomized to an 8 week caloric restriction (CR) regimen alone (n = 15) or combined with sleep restriction (CR + SR) (n = 21). All participants were instructed to restrict daily calorie intake to 95 per cent of their measured resting metabolic rate. Participants in the CR + SR group were also instructed to reduce time in bed on five nights and to sleep ad libitum on the other two nights each week.
The CR + SR group reduced sleep by 57 ± 36 min per day during SR days and increased sleep by 59 ± 38 min per day during ad libitum sleep days, resulting in a sleep reduction of 169 ± 75 min per week. The CR and CR + SR groups lost similar amounts of weight, lean mass, and fat mass. However, the proportion of total mass lost as fat was significantly greater (p = 0.016) in the CR group. This proportion was greater than body fat percentage at baseline for the CR (p = 0.0035), but not the CR + SR group. Resting respiratory quotient was reduced (p = 0.033) only in CR, and fasting leptin concentration was reduced only in CR + SR (p = 0.029).
Approximately 1 hr of SR on five nights a week led to less proportion of fat mass loss in individuals undergoing hypocaloric weight loss, despite similar weight loss. SR may adversely affect changes in body composition and “catch-up” sleep may not completely reverse it.
ClinicalTrials.gov (NCT02413866)
Previous studies suggest that sleep restriction during caloric restriction adversely affects weight-loss outcomes. This study extends previous findings by examining the effects of a much longer duration of intervention (8 weeks) using a randomized controlled trial (caloric restriction alone or combined with sleep restriction). Furthermore, the sleep restriction was moderate, approximated 60 min shorter on the 5 days of restricted sleep each week. Ad libitum sleep was allowed on the other 2 days each week so that the sleep pattern mimicked real life. We found that sleep restriction resulted in less loss of fat but greater loss of lean mass among the total mass lost, despite similar weight loss between the two groups. Other metabolic changes were also observed.
Introduction
Obesity is associated with serious health consequences [1–3] and caloric restriction (CR) is a widely used strategy to treat obesity. Many observational studies support an association between insufficient sleep and greater body weight and body fat [4]. Altered neuroendocrine factors [5–7], energy expenditure [8–12], and energy intake [13–16] have also been reported with restricted sleep. Therefore, sleep restriction (SR) may affect neuroendocrine responses and energy expenditure during CR and reduce the effects of CR on body weight and fat.
A previous study found a positive association between sleep duration and the loss of body fat in individuals who underwent an intervention involving 15–24 weeks of CR [17]. However, that study only determined baseline sleep using self-reported measures, which often differs from objective measures by at least 1 hr [18] and did not have information regarding sleep during CR. In a study involving 14 days of CR, participants lost less fat mass when they spent 5.5 hr in bed per day than when they spent 8.5 hr in bed per day [11]. Additionally, an intervention involving a 4 day controlled diet combined with short sleep (4 hr in bed per day) induced less weight loss compared with habitual sleep (9 hr in bed per day) [19]. These studies suggest that sleep plays a role in the loss of weight and fat mass during CR.
However, the results of these studies were limited to a short duration of intervention. Effects after a longer duration of SR may be different. For example, one study found that body weight was reduced after 1 week of SR but returned to baseline after an additional 2 weeks [20]. It is unknown whether SR during a longer duration of CR affects body weight and fat.
Furthermore, days of short sleep are often interspersed with longer sleep on other days in free-living individuals. A National Sleep Foundation survey showed that more than 40 per cent of the population self-reported that they slept longer during the weekend [21]. A recent cross-sectional study found that adults who “caught up” sleep during weekends had a significantly lower body mass index (BMI) than those who did not “catch up” sleep, and that each additional hour of weekend catch-up sleep was associated with a decrease of 0.12 kg/m2 in BMI [22]. However, different sleep timings and durations between work and free days have been shown to be associated with increased BMI [23]. Thus, the overall effect of catching up sleep following SR on body weight is not clear; it is also unknown whether repeatedly catching up sleep after restricted sleep, over a period of CR, affects the adverse effects of insufficient sleep on body weight and fat suggested by aforementioned studies involving short interventions [11, 19].
Therefore, the purpose of this study was to examine the effects of chronic SR with catch-up sleep on body weight and composition during an 8-week period of CR in overweight or obese adults. The 8-week SR involved 5 days of moderate SR and 2 days of ad libitum sleep per week. Additional outcomes of resting metabolic rate (RMR), respiratory quotient (RQ), and hormones related to appetite regulation were also explored.
Methods
The Weight Outlooks by Restriction of Diet and Sleep study was a randomized trial to examine the effects of SR on weight-loss outcomes in individuals who underwent CR. The study was registered at ClinicalTrials.gov (NCT02413866). The research protocol was approved by the University of South Carolina Institutional Review Board, and all participants provided a signed informed consent.
Participants and screening
Participants from Columbia, South Carolina, and surrounding areas were recruited through local advertisements. All participants were 35–55 years old, overweight or obese (BMI of 25–40 kg·m−2), and weight stable (±3%) during the previous 3 months. Their self-reported 24 hr sleep duration was 6.5–8 hr including naps. The primary exclusion criteria included the following: (1) self-reported medical conditions such as metabolic diseases, cardiovascular diseases, chronic or recurrent respiratory conditions, active cancer, sleeping, eating, or neurological disorders; (2) medications that affect metabolism; (3) use of medications, devices, or hypnotics to assist sleep; (4) psychological issues such as untreated depression; (5) excessive caffeine use (>500 mg/day); (6) shift workers or work requiring long-distance driving or operating heavy equipment; (8) self-reported total nap duration > 90 min/day or excessive daytime sleepiness; and (9) pregnant, lactating, or women who were perimenopausal with irregular menses.
A total of 528 volunteers were initially screened via an online survey which included questions regarding age, height, weight, basic health information, and sleep habits, and 433 were ineligible (Figure 1). The top reasons for being ineligible were BMI (n = 213), age (n = 48), weight not being stable (n = 41), medical issues (n = 40), being perimenopause (n = 37), and issues related to sleep (n = 36). Among the 95 eligible individuals, 62 attended an orientation session and were further screened at our research center. The screening included medical history review, blood pressure, and fasting blood test. Those with signs of serious diseases were excluded. The Center for Epidemiologic Studies Depression Scale (CESD) was used to exclude those with uncontrolled depression (CESD score > 16), and the Epworth Sleepiness Scale (ESS) was used to exclude those with high daytime sleepiness (ESS score > 12).
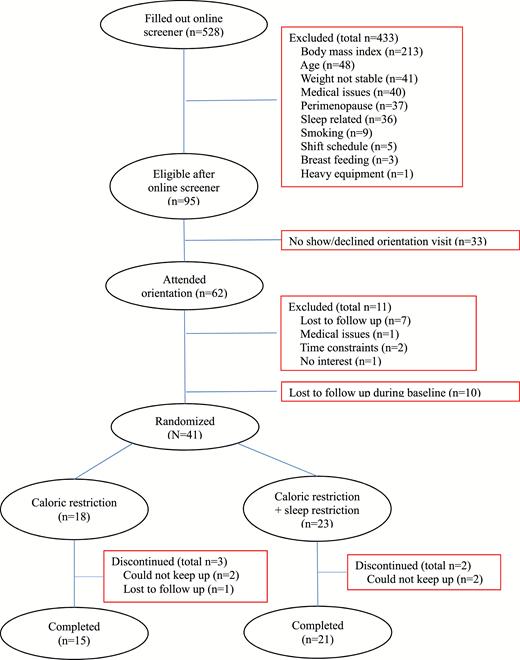
Participant flow chart
Additionally, a 1 week run-in was used to familiarize participants with self-monitoring procedures of the study. During this week, participants were instructed to record the times of going into bed and getting out of bed every night and any naps taken, and to wear an actigraphic monitor (GT3X+, ActiGraph LLC, Pensacola, FL) on their nondominant wrist for the week. An average time in bed (TIB) of <6 or >9 hr was used as further exclusion criteria; however, no additional participants were excluded because of this. All participants were instructed to either use a mobile app “MyFitnessPal” (MyfitnessPal, Inc.) or to record on paper their food and drinks including the type and amount throughout the week. All paper records were entered into the web version of the app by study staff. This app provides total calorie and macronutrient intake for each recorded day. After these procedures, 51 individuals remained eligible in the study.
Interventions
Among the 51 individuals who were eligible for the study, 41 completed all measurements at baseline and were randomized to one of two 8-week interventions: caloric restriction (CR) with or without sleep restriction (SR) (CR: n = 18; CR + SR: n = 23). We used a computer software to generate random group numbers (1 and 2), and each participant, upon finishing baseline measurements, was assigned a number according to the sequence. Different sets of random group numbers were used for men and women. A set of five numbers were generated each time with two numbers for CR and three for CR + SR group. We used this 2:3 ratio of group assignment because we anticipated greater retention rate for the CR group (85–90 per cent) than the CR + SR group (75–80 per cent). During the intervention, five participants dropped out of the study (three in CR and two in CR + SR). Among these individuals, four participants were not able to continue the required recording and visits for the study, and one participant was lost to follow-up for unknown reason. A total of 36 participants completed the study (CR: n = 15; CR + SR: n = 21). During the 8 weeks, all participants were asked to maintain their usual daily activities throughout the study, and not to participate in another interventional study.
Caloric restriction
The planned daily dietary level was approximately 95 per cent of each individual’s RMR measured by indirect calorimetry at baseline. RMR accounts for 60–75 per cent of total energy expenditure. The participants were weight stable at enrollment, so their habitual energy intake equaled total energy expenditure. Therefore, the planned daily dietary level of approximately 95 per cent of each individual’s RMR would be 57–71 per cent of their energy intake at baseline, or 29–43 per cent reduction. The total calories were divided among breakfast (25 per cent), lunch (30 per cent), dinner (35 per cent), and snack (10 per cent), and with approximately 30 per cent of calories from fat, 20 per cent from protein, and 50 per cent from carbohydrate. Lunch and dinner meals were provided for all participants for 4 days each week of their choice and were picked up by participants. Dietary guidelines were given to participants for breakfast and snack and the 3 free days of their choice of the week. A registered dietitian directed the development of meals to be provided, sample meal plans, and the dietary guidelines. All participants were instructed to record whether they consumed the provided meals and any extra food and caloric drink, and to record all breakfast meals, and food and drinks during the 3 free days. Our staff checked their dietary record and discussed any issues with them.
Sleep restriction
For the CR + SR group, participants were instructed to reduce their total TIB by 90 min for 5 days each week according to their preference of going to bed later and/or getting up earlier, and to maintain their usual napping habits. For the other 2 days of the week, they were allowed to sleep ad libitum and the 2 days could be nonconsecutive. They were instructed to maintain a similar sleep–wake timing during the 5 days of reduced TIB and minimize the shift in sleep–wake timing between days. This SR protocol was adopted in order to reduce possible adverse events due to lack of sleep. More importantly, this allowed better mimicking of real life, where many individuals experience insufficient sleep during some days of the week and try to catch up on sleep during other days.
All participants were instructed to record the times they went to bed, got up, and took naps every day, and to wear an actigraphic monitor (ActiGraph GT3X+, ActiGraph, Pensacola, FL) on their nondominant wrist throughout the intervention. The output from the monitors was analyzed using the manufacturer-provided software ActiLife 6.11. The Cole-Kripke algorithm was used to determine minute-by-minute asleep/awake status [24]. Total sleep time (TST) was the total number of minutes scored as “asleep.” Total TIB was the total time from going into bed with lights out attempting sleep to getting up plus any naps during the day recorded by participants. The times recorded on the sleep logs were manually entered into the program to quantify TIB. The GT3X+ provides objective measures of activity counts as well as information on the environment via an ambient light sensor. A standardized approach was used to define TIB [25]. Missing entries on logs and inaccurate recordings of bed/awake times were estimated or adjusted, respectively, based on the hierarchical ranking of inputs (i.e. sleep logs, light intensity, and activity counts) in order to improve the accuracy of the values. Our staff checked the self-reported bed time and actigraphic recording every week and discussed any issues with participants.
Measurements
All outcome measurements were performed at baseline and following the interventions. The measurements included body weight, body composition, RMR, and RQ. Blood samples were also collected. Body weight was additionally measured once a week during the interventions. For 1 week at baseline and throughout the interventions, participants wore the actigraphic monitor and were instructed to record the times of going into bed and getting out of bed every night and any naps taken. They were also instructed to record food intake daily for the same period. Furthermore, participants were instructed to complete the CESD, ESS, Functional Outcomes of Sleepiness (FOSQ), and psychomotor vigilance task (PVT) at baseline and every 2 weeks during the interventions to monitor changes that may be indicative of substantial adverse effects.
Body weight and composition
Participants wore standard scrubs and without shoes or outer garments to have height and weight measured on a digital scale (Health O Meter Professional, Pelstar LLC, McCook, IL) which was calibrated according to manufacturer’s recommendations. At baseline and postintervention, body weights at two visits were averaged. Whole-body total mass, fat mass, lean mass, and percentage body fat were determined using dual-energy x-ray absorptiometry (DXA, enCORE, GE Healthcare model 8743, Waukesha, WI).
Resting metabolic rate and respiratory quotient
RMR was measured via indirect calorimetry using a ventilated hood after an overnight fast of at least 10 hr. A data-collection period of 30 min followed an approximately 15 min rest upon participant’s arrival at the laboratory. The participant remained quiet and still in the supine position throughout the entire procedure and were kept awake with continuous monitoring. The room was maintained in low light, noise was kept at minimum, and the temperature was maintained at a constant 26–30°C. The expired air was collected through a one-way valve and analyzed using a metabolic cart (TrueOne 2400, ParvoMedics, Salt Lake City, UT) which was calibrated on each day of measurement following the manufacturer’s instructions. RMR was calculated from each determination of O2 consumption and CO2 production during the testing period with a constant airflow rate into the hood using Weir’s equation [26]. The first 8 and last 2 min of data were excluded to avoid unstable measurements, and the average value of the middle 20 min was calculated. RQ was calculated using the same time period. All testing procedures took place in the morning between 0600–0800 hr and at least 24 hr after any structured exercise.
Blood sample collection and analysis
Venous blood samples were collected at baseline and postintervention. Participants were instructed to fast (not including water) for at least 12 hr prior to blood draw visits. Serum samples were collected and stored at −80°C degrees until analysis. Before analysis of ghrelin and leptin, serum samples were thawed and recentrifuged at 3000 rpm at 4°C for 20 min to remove any potential particulates. A multiplex immunoassay (Bio-Rad Laboratories, Hercules, CA) was used to quantify concentrations of ghrelin and leptin per manufacturer instructions on a Magpix multiplexing system (Luminex, Austin, TX). All samples were run in duplicates.
Other questionnaires and tests
The CESD, ESS, FOSQ, and PVT were used to evaluate changes in participants’ depressive symptom, sleepiness, daily function, and alertness that may occur during intervention. No participant reported scores indicative of clinical depression (CESD > 16), excessive sleepiness (ESS > 12), or a change of >10 per cent in FOSQ during the intervention; therefore, no one was excluded due to these tests. The PVT was a 2 min online test of neurobehavioral function. It has been shown that a 2-min PVT provided similar trend of deterioration as the standard 10-min PVT across a night of sustained wakefulness [27]. The mean response time during the test period was reported for each test in milliseconds. An increase in response time to >500 ms during the intervention was considered indication of deteriorated response to be excluded from the study. All participants had PVT response time of <500 ms, except one participant who had consistent PVT response time of >500 ms (range: 501–517 ms) during the study and therefore was not advised to stop participating.
Statistics
There were no data available in the literature regarding the effect size of the differences between CR and CR + SR after 8 weeks in the changes in body weight and body fat. The study by Nedeltcheva et al. investigated body composition changes after 14 days [11]; however, it is difficult to estimate changes after 8 weeks based on their data given that different components of body mass are lost at different rates over time [28]. Therefore, sample size was estimated based on detecting an interaction, between the change in fat mass with intervention and group, at standardized effect sizes of small to medium, with 80 per cent power and an α of 0.05. A correlation of 0.8–0.9 between fat mass at baseline and postintervention, as shown in our previous dietary intervention study [29], was used. A total sample size of 30–40 (equal samples sizes in CR and CR + SR) would provide 80 per cent power to detect a small-to-medium effect size of f = 0.125–0.15 for the interaction, at an α of 0.05. This would indicate significantly different changes in fat mass in the two groups.
Descriptive statistics for variables were calculated. Data are presented as mean ± SD or percentage. Medians (interquartile range) are also presented for non-normally distributed data. Chi-square test was used to compare categorical variables between intervention groups at baseline. Analysis of variance (ANOVA) with repeated measures including a time × group interaction was used to determine whether the two groups had different changes in outcome variables. Body weight, composition, and sleep variables before and after the intervention within each group were compared by using paired t-tests. Covariates that were adjusted included baseline body weight, weight change, baseline body fat, fat mass change, sex, and race. Additionally, change values were calculated by subtracting baseline values from postintervention values. They were compared between the CR and CR + SR groups by independent t-test (or Mann–Whitney U-test when normality distribution of data was not met). To determine whether changes in body composition with interventions were proportional to baseline body composition, the amount of body fat lost as a percentage of total mass lost was compared with baseline body fat percentage using paired t-test or Wilcoxon signed-rank test, as appropriate. Other outcomes including RMR, RQ, leptin, and ghrelin were analyzed similarly. Linear regression was used to determine correlations between concentration changes of ghrelin and leptin, and body composition variables.
The primary analyses included participants who completed the study (n = 36). Additional intent-to-treat analyses included all participants who were assigned an intervention group (n = 41) including those who dropped out before postintervention measurements (n = 5). For those who did not complete the study, the last measured body weight was used as postintervention weight. Because body composition, RMR, and RQ were only available at baseline, their baseline values were used as values after intervention. Analyses were conducted in the same manner as the primary analyses. A p-value of <0.05 was considered statistically significant and Bonferroni adjustments were used (p-value of 0.05/number of comparisons) as appropriate, which are indicated below. Data were analyzed using SAS statistical package (version 9.4, Cary, NC).
Results
Baseline characteristics
Participant characteristics at baseline for the 36 participants who completed baseline measurements are shown in Table 1 by assigned groups. The participants were approximately 80 per cent females and 61 per cent African American. The median income was $50,000–$59,000 and 44 per cent were married. There were no differences between the CR and CR + SR groups in age, sex composition, race composition, height, lean body mass, percent body fat, RQ, or average daily TIB and TST. However, body weight, BMI, DXA total mass, fat mass, and RMR were significantly greater in the CR + SR group than the CR group. The five participants who dropped out the study before completion and the 36 participants who completed the study had similar average age, body composition, TIB, and TST at baseline (all p values > 0.05).
Participant characteristics at baseline
| Variables | CR (n = 15) | CR + SR (n = 21) | P |
|---|---|---|---|
| Age, years | 45.0 ± 5.7 | 45.3 ± 6.0 | 0.91 |
| Female, n (%) | 12 (80%) | 17 (81%) | 0.94 |
| Race African American, n (%) Caucasian, n (%) | 10 (66.7%) 5 (33.3%) | 12 (57.1%) 8 (38.1%) | 0.64 |
| Height, cm | 167.9 ± 6.3 | 168.3 ± 6.4 | 0.86 |
| Weight, kg | 88.1 ± 8.8 | 99.0 ± 10.9 | 0.003 |
| Body mass index, kg·m−2 | 31.3 ± 3.3 | 35.1 ± 5.1 | 0.02 |
| DXA total mass, kg | 87.9 ± 8.6 | 99.0 ± 10.6 | 0.003 |
| Fat mass, kg | 34.3 ± 7.9 | 42.7 ± 9.1 | 0.007 |
| Lean body mass, kg | 50.7 ± 7.2 | 53.3 ± 7.3 | 0.29 |
| Body fat, % | 38.9 ± 7.3 | 43.0 ± 6.5 | 0.09 |
| Resting metabolic rate, kcal/day | 1412 ± 203 | 1623 ± 225 | 0.009 |
| Respiratory quotient | 0.80 ± 0.03 | 0.80 ± 0.03 | 0.73 |
| Time in bed, min/day | 443 ± 25 | 448 ± 56 | 0.74 |
| Total sleep time, min/day | 387 ± 31 | 393 ± 53 | 0.73 |
Data are mean ± SD. p-Values are for comparisons between CR and CR + SR groups.
CR = caloric restriction; SR = sleep restriction; DXA = dual-energy x-ray absorptiometry.
Intervention—calorie intake
The self-reported average daily calorie intake for the CR group was 1575 ± 357 kcal/day and for the CR + SR group was 1775 ± 579 kcal/day at baseline before randomization. During the 8 week intervention, 25 (69.4 per cent) of the 36 participants who completed the study provided at least 75 per cent of dietary intake records. The CR group had calorie intake of 1389 ± 328 kcal/day during intervention and 1260 ± 632 kcal/day postintervention. The CR + SR group had calorie intake of 1454 ± 406 kcal/day during intervention and 1488 ± 291 kcal/day postintervention. The calorie intake during intervention was approximately 14 ± 9% and 16 ± 9% lower than baseline values for the CR and CR + SR groups, respectively.
Intervention—time in bed and total sleep time
The mean TIB of each week during intervention for the CR and CR + SR groups is shown in Figure 2, A and B, respectively. For the CR group, the TIB ranged between 428 and 451 min per day throughout the intervention. For the CR + SR group, the TIB range was 371–390 min per day each week for the sleep-restricted days and 494–536 min per day for the ad libitum sleep days. The difference in TIB between the sleep-restricted days and ad libitum days ranged from 112 to as much as 153 min per day each week. Comparing to baseline, the TIB on the days they restricted sleep was 65 ± 38 min per day shorter, and the TIB on the ad libitum sleep days was 65 ± 37 min longer than at baseline (p < 0.001 for both). The total TIB reduced during the intervention was 185 ± 63 min per week.
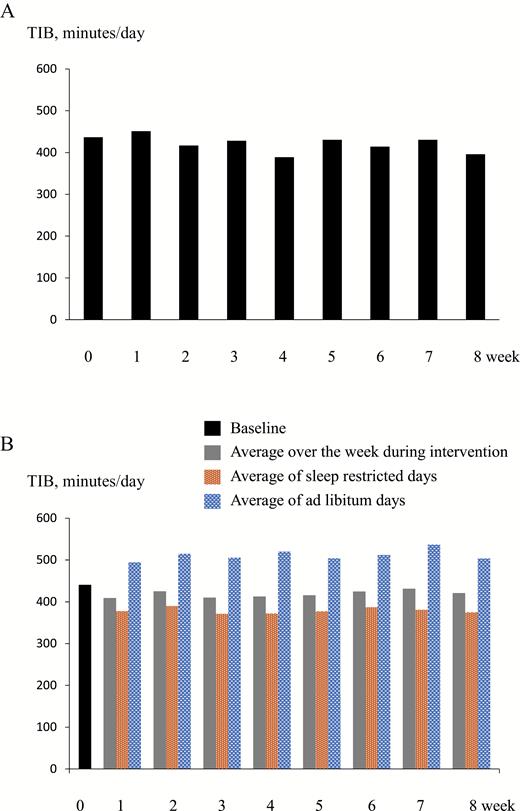
(A) For the CR group, TIB per day averaged over a week at baseline (week 0) and each week during intervention. (B) For the CR + SR group, average TIB per day over a week at baseline (week 0) and each week during intervention, as well as average per day during the sleep-restricted days and ad libitum days each week during intervention.
Similarly, the mean TST values for the CR and CR + SR groups are shown in Figure 3, A and B, respectively. Throughout the 8 weeks, TST ranged between 371 and 397 min per day each week for the CR group, and 324–356 min on restricted sleep days and 438–473 min on ad libitum sleep days for the CR + SR group. For the CR + SR group, the difference in TST between the sleep-restricted days and ad libitum days ranged 102–140 min per day per week. Comparing to baseline, the TST on the days they restricted sleep was 57 ± 36 min shorter per day, and on the ad libitum sleep days it was 59 ± 38 min longer per day (p < 0.001 for both). The total TST reduced during the intervention was 169 ± 75 min per week.
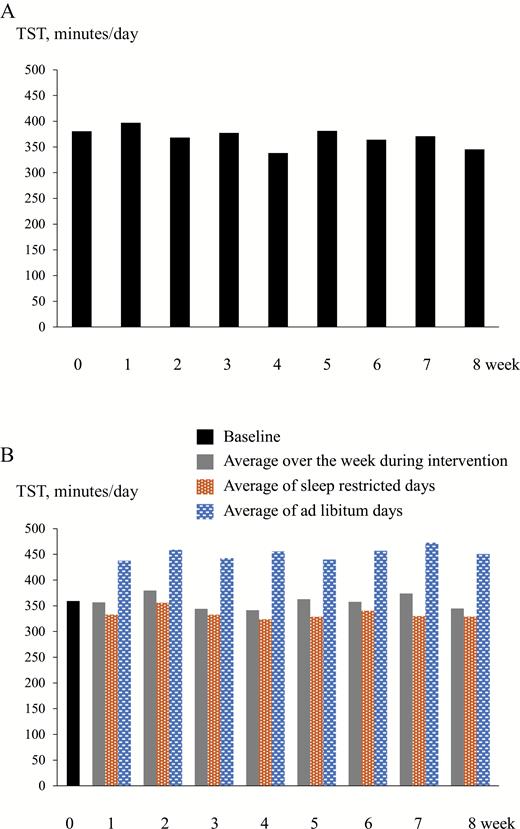
(A) The CR group. TST per day averaged over a week at baseline (week 0) and each week during intervention. (B) The CR + SR group. Average TST per day over a week at baseline (week 0) and each week during intervention, as well as average per day during the sleep-restricted days and ad libitum days each week during intervention.
Interventional effects—body weight, body composition, RMR, and RQ
The CR and CR + SR groups did not have different changes in body weight, body composition, or resting metabolic variables (p > 0.16 for time × group interactions). Table 2 includes the changes in each variable after interventions by group. The fat mass change relative to baseline fat mass and the lean body mass change relative to baseline lean body mass were also similar between the two groups (p = 0.60 and 0.81, respectively).
Changes (Δ) in body weight, body composition, and metabolic variables at rest after interventions by group
| Variables | CR (n = 15) | CR + SR (n = 21) | P |
|---|---|---|---|
| Δ body weight, kg | −3.3 ± 3.2 | −3.2 ± 2.5 | 0.87 |
| Weight loss relative to baseline, % | −3.7 ± 3.3 | −3.1 ± 2.5 | 0.54 |
| Δ DXA total mass, kg | −2.7 ± 2.4 | −2.5 ± 2.4 | 0.86 |
| Δ fat mass, kg | −1.9 ± 2.1 | −1.8 ± 1.7 | 0.85 |
| Δ lean body mass, kg | −0.71 ± 0.93 | −0.72 ± 1.2 | 0.99 |
| Δ percent body fat, % | −0.99 ± 1.4 | −0.82 ± 1.0 | 0.67 |
| Total mass loss as fat mass, % | 80.7 ± 43.3 82.7 (58.6, 111.6)† | 16.9 ± 104.5 58.4 (−12.7, 73.6)† | 0.016‡ |
| Total mass loss as lean mass, % | 17.3 ± 43.1 16.7 (−15.8, 37.8)† | 84.8 ± 110.2 38.6 (27.1, 110.4)† | 0.018‡ |
| Δ resting metabolic rate, kcal/day | 79 ± 152 | −11 ± 193 | 0.16 |
| Δ respiratory exchange ratio | −0.02 ± 0.03 | −0.004 ± 0.06 | 0.35 |
Data are mean ± SD. p-Values are for comparisons between CR and CR + SR groups. These p values are compared with 0.025 to denote statistical significance according to Bonferroni adjustment for multiple comparisons of these variables between groups and races (Table 3). Change values are calculated by subtracting baseline from postintervention values.
CR = caloric restriction; SR = sleep restriction; DXA = dual-energy x-ray absorptiometry.
†Median (interquartile range).
‡Mann–Whitney U-test.
Interestingly, the amount of DXA-assessed fat mass lost as a proportion of total mass lost was greater in the CR than CR + SR group, with median proportions of 83 and 58 per cent, respectively. In contrast, the amount of lean mass lost as a proportion of total mass lost was less in the CR than the CR + SR group, with median proportions of 17 and 39 per cent, respectively. In both groups, body weight, total mass, fat mass, lean body mass, and percent body fat decreased (p < 0.05 for all). RMR did not change in either group (CR: p = 0.074; CR + SR: p = 0.99). A significant reduction in RQ (p = 0.033) was found in the CR but not CR + SR group (p = 0.78).
In addition, in the CR group, the amount of fat lost as a percentage of the total mass lost was greater than baseline percent body fat (p = 0.0035), suggesting body composition changes favoring decreased body fat. However, in the CR + SR group, the amount of fat lost as a percentage of the total mass lost was not different from baseline body fat (Wilcoxon signed-rank test, p = 0.81).
After adjustment for baseline body weight, all the above findings remained unchanged. Similarly, adjustment for sex in the comparisons between CR and CR + SR did not affect any results. After race was added to the model, there were still no differences between CR and CR + SR in the changes in body weight, percent weight loss, total mass, fat mass, percent body fat, RMR, or RQ. However, a significant group × race interaction was found for lean body mass change (p = 0.048), suggesting CR and CR + SR interventions had different effects in African American and Caucasian participants. Further analyses did not show significant differences among the combinations of race and group (p > 0.05 for all).
Additionally, significant racial differences were found for a few outcome variables. African American participants had significantly less loss of total mass and fat mass than Caucasians (Table 3). Because these post hoc tests shown in Table 3 compared the same variables between races as in Table 2 between groups, Bonferroni adjustments were applied in consideration of multiple comparisons (p < 0.05/2 = 0.025). Fat mass loss relative to baseline fat mass was also less in African Americans (p = 0.0048; Caucasian: −7.9 ± 3.2%; African American: −3.4 ± 4.8%). Body weight, fat mass, lean body mass, and percent body fat significant decreased in both African American and Caucasian participants (p < 0.05 for all). The changes in RMR were also different between the two races; RMR increased in African Americans (p = 0.017), but did not change in Caucasians (p = 0.11). RQ did not change in either race (p = 0.067 and 0.36 for Caucasians and African Americans, respectively).
Changes (Δ) in body weight, body composition, and metabolic variables at rest after interventions by race
| Variables | Caucasian (n = 13) | African American (n = 22) | P |
|---|---|---|---|
| Δ body weight, kg | −4.6 ± 2.2 | −2.5 ± 2.8 | 0.037 |
| weight loss relative to baseline, % | −4.7 ± 2.2 | −2.7 ± 2.9 | 0.036 |
| Δ DXA total mass, kg | −3.9 ± 1.7 | −1.9 ± 2.4 | 0.011 |
| Δ fat mass, kg | −3.0 ± 1.1 | −1.3 ± 2.0 | 0.010 |
| Δ lean body mass, kg | −0.99 ± 0.96 | −0.6 ± 1.1 | 0.29 |
| Δ percent body fat, % | −1.5 ± 0.8 | −0.60 ± 1.2 | 0.033 |
| Total mass loss as fat, % | 77.9 ± 20.3 75.1 (63.6, 84.6)† | 31.9 ± 103.6 58.6 (3.6, 81.7)† | 0.15‡ |
| Total mass loss as lean mass, % | 22.0 ± 20.2 27.5 (15.2, 36.4)† | 67.1 ± 107.7 37.3 (18.7, 84.9)† | 0.22‡ |
| Δ resting metabolic rate, kcal/day | −83 ± 173 | 90 ± 155 | 0.005 |
| Δ respiratory exchange ratio | −0.03 ± 0.04 | −0.009 ± 0.04 | 0.29 |
Data are mean ± SD. p-Values are for comparison between Caucasian and African-American participants. These p values are compared with 0.025 to denote statistical significance according to Bonferroni adjustment for multiple comparisons of these variables between groups (Table 2) and races. Change values are calculated by subtracting baseline from postintervention values.
DXA = dual-energy x-ray absorptiometry.
†Median (interquartile range).
‡Mann–Whitney U-test.
Interventional effects—ghrelin and leptin
Serum samples at both baseline and postintervention were available from 12 participants in the CR group (3 males, 5 Caucasians) and 11 in the CR + SR (2 males, 6 Caucasians). The CR and CR + SR groups did not have different changes in serum concentrations of ghrelin and leptin (p > 0.33 for time × group interactions). In the entire sample, ghrelin concentration did not change significantly (p = 0.059), but leptin concentration significantly decreased (p = 0.018).
Table 4 includes serum concentrations of ghrelin and leptin at baseline and absolute changes and changes relative to baseline values by assignment groups. The concentrations at baseline and changes following interventions were similar between CR and CR + SR groups. In the CR group, ghrelin and leptin concentrations did not change following the intervention (p = 0.31 and 0.28, respectively). In the CR + SR group, ghrelin concentration did not increase significantly (p = 0.069) but leptin significantly decreased (p = 0.029).
Fasting plasma ghrelin and leptin concentrations at baseline and changes after interventions by group
| Variables | CR (n = 12) | CR + SR (n = 11) | P |
|---|---|---|---|
| Ghrelin baseline, pg/mL | 427 ± 297 | 406 ± 183 | 0.84 |
| Δ, pg/mL | 59 ± 193 | 74 ± 120 | 0.83 |
| % change | 16.5 ± 35.7% | 26.3 ± 36.8% | 0.53 |
| Leptin baseline, ng/mL | 26.8 ± 19.2 | 46.3 ± 34.7 | 0.11 |
| Δ, ng/mL | −5.6 ± 17.1 | −12.6 ± 16.4 | 0.33 |
| % change | −14.5 ± 37.4% | −24.0 ± 26.7% | 0.49 |
Data are mean ± SD. p-Values are for comparisons between CR and CR + SR groups. Change values are calculated by subtracting baseline from postintervention values.
CR = caloric restriction; SR = sleep restriction.
With adjustment for baseline weight, weight change, baseline fat mass, fat mass change, sex, or race, ghrelin and leptin concentrations at baseline and their changes after interventions were still not different between CR and CR + SR groups (all p values > 0.10). In the entire sample, leptin concentration no longer significantly changed after adjustment for baseline weight, weight change, or baseline fat mass (p = 0.057, 0.43, and 0.15, respectively), but still decreased after adjustment for fat mass change (p = 0.044). In the CR + SR group, leptin was no longer changed after adjustment for baseline weight, weight change, baseline fat mass, or fat mass change (p = 0.057, 0.39, 0.063, 0.11, respectively). Additionally, the changes in ghrelin and leptin were not correlated with changes in body weight or fat mass (without or with adjustment for baseline weight) in the entire sample (p > 0.34 for all).
Intent-to-treat analyses
Results from intent-to-treat analyses were largely the same as the results from participants who completed the study. There were no differences in the two groups in the amount of changes in body weight, percent weight loss, fat mass, lean body mass, percent body fat, RMR, or RQ between CR and CR + SR groups (p values ranged from 0.17 to 0.95). In both groups, body weight, fat mass, lean body mass, and percent body fat decreased (p < 0.05 for all). The weight lost for the CR and CR + SR groups were −2.7 ± 3.2 kg (−3.1 ± 3.4%) and −2.9 ± 2.7 kg (−2.8 ± 2.6%), respectively. A significant reduction in RQ (p = 0.034) was also found in the CR but not CR + SR group (p = 0.78). The proportions of fat and lean mass lost among the total mass lost (by DXA) were not calculated because the change values of fat mass, lean mass, and total mass equaled to 0 for participants who dropped out the study (n = 5) with baseline values used as postintervention values.
Discussion
To the best of our knowledge, this study had the longest intervention among studies that have examined the effects of moderately restricted sleep duration on weight-loss outcomes in the context of hypocaloric diet. We found that there was a similar amount of weight loss, but the total mass lost was composed of a greater percentage of lean mass and less percentage of fat mass in the CR + SR group compared with the CR group. The amount of fat mass as a percentage of total mass lost was greater than body fat percentage at baseline in the CR but not different in the CR + SR group. Also, our exploratory analyses showed RQ decreased only in the CR group, suggesting a shift toward greater fat oxidation at rest, but fasting serum leptin concentration decreased only in the CR + SR group. Additionally, post hoc analyses showed that African-American participants lost less total mass and fat mass than Caucasian participants.
Only a few previous studies have examined the effects of restricted sleep during weight loss on body composition. In a study by Nedeltcheva et al., 10 participants completed a cross-over study involving two 14-day periods of CR conditions, one with 5.5 hr TIB and one with 8.5 hr TIB [11]. The 5.5 hr TIB resulted in less loss of weight as fat (an average of 25 per cent) than the 8.5 hr TIB (56 per cent), but the amount of weight lost was similar. RQ was greater and RMR was lower after 5.5 hr TIB. Our results were consistent with the study of Nedeltcheva et al. in that we also showed less loss of total mass as fat when sleep was shorter. Also consistent with the Nedeltcheva study, the CR group in our study showed a shift toward greater oxidation of fat, but the CR + SR group did not show a change. Therefore, our study extended the findings to a much longer duration of intervention, using a randomized group design. Further, consistent with results from previous weight loss studies without sleep intervention [30, 31], we showed that the CR group lost a greater percentage of fat mass within the total mass lost than the baseline body fat percentage. This was not observed in the CR + SR group. Although these differences between the two groups did not result in different body fat percentages after interventions, this likely was due to the small amount of total mass loss. However, these results support that SR adversely influences body composition changes during CR resulting in less utilization of fat.
In another study of normal weight participants, St-Onge et al. found that 4 days of controlled dietary intake combined with short sleep (4 hr TIB per day) elicited less weight loss than 4 days of controlled diet with habitual sleep (9 hr TIB) (1.7 ± 0.4 vs. 2.2 ± 0.4 lb) [19]. Our study did not find a difference in the amount of weight loss (absolute or relative to baseline weight) between CR and CR + SR groups. The degree of CR over a shorter period may have resulted in their different finding; the CR in the study by St-Onge [19] appeared to be greater than the one by Nedeltcheva et al. [11] and the present study, given the amount of weight loss after 4 days, compared with 14 days and 8 weeks. We cannot determine whether weight loss would be less in the CR + SR group if calories were restricted to a greater degree in our study.
Ghrelin and leptin are two hormones that have been recognized to have a major influence on energy balance [32, 33]. Previous clinical studies involving SR showed inconsistent results as indicated by others [34, 35]. Leptin is a mediator of long-term regulation of energy balance and induces weight loss by suppression of food intake; ghrelin is a fast-acting hormone, functioning as an appetite-stimulating signal [32]. Therefore, the inconsistent results in previous studies may be related to the degree of energy imbalance and the length of intervention. Other factors such as the sensitivity of receptors may also complicate the issue. In the CR + SR group of our study, fasting leptin decreased by 24 per cent and ghrelin showed a trend for increase by 26 per cent, suggesting an energy deficiency state [36] which may reflect a greater energy need, and greater potential to initiate greater energy intake, which would put these individuals at risk for regaining the lost weight. These changes were absent in CR group; the absence of a significant reduction in leptin may in part be due to the small amount of fat mass loss which was not enough for the body to sense energy deficiency. Results of this study, although exploratory in nature, suggest that SR increases the risk for weight regain after weight loss. However, further investigation of the hormonal changes beyond fasting concentrations to include receptor sensitivity, amplitude of change with meals (for ghrelin) with larger sample sizes, is recommended.
Additionally, this study showed that African-American participants lost less total mass and less fat than Caucasian participants. Previous studies have shown similar findings with weight loss interventions [37, 38]. In one study, African-American women lost 3.6 kg less weight than Caucasian women matched for initial body weight during 6 months of weight loss intervention, despite similar adherence to the prescribed CR and physical activity [38]. This study again draws attention to the racial disparity in weight loss with a similar intervention. Despite the differences in the amount of total mass and fat loss, SR resulted in less loss of mass as fat for African-American and Caucasian participants combined. Epidemiological research suggests that short sleep duration is more likely to be associated with being overweight or obese among African Americans than among Caucasians [39]. Our study, however, was underpowered to detect potentially different effects of SR between the two racial groups on body weight and composition.
We cannot explain the statistically significant increase (an average of 6.9 per cent) in RMR in African-American participants. Contrary to our results, previous research found that RMR decreased less in Caucasians than in African Americans [38], and the decrease in RMR was proportional to changes in body weight and composition in Caucasian but not in African-American women [37].
An important strength of this study is the relatively long duration of the intervention (8 weeks). This duration was longer than previous SR studies in the context of dietary weight loss. The objective measurement of sleep using actigraphy throughout the study is another strength of the study. Also, the degree of SR in our study was less than in other studies: TIB on those restricted sleep days were approximately 60 min shorter than at baseline (and the group without SR), and 120 min shorter than that on ad libitum sleep days. When averaged over the week during intervention, the TIB was only 185 min less per week (or 26 min per day). These were in contrast to the 3-hr difference between conditions in one study [11] and 5-hr difference in another study [19]. The amount of SR was less than what we planned initially. This was likely because we did not emphasize to participants the amount of SR during intervention, but only instructed them to reduce TIB by 90 min. On the other hand, this study provided evidence that approximately 60 min of sleep reduction on five nights per week for several weeks was safe and tolerable by individuals who were not long sleepers (TIB ≤ 9 hr).
Another unique aspect of our study was that participants were allowed to sleep ad libitum on 2 days each week. Some evidence indicates that differential sleep duration and timing between days is associated with increased BMI [23]; thus, results of this study may not be completely due to the restricted sleep. On the other hand, other research indicates that adults who caught up sleep during weekends had a significantly lower BMI than those who did not catch up sleep [22]. We conducted post hoc analyses to address the association of change in body weight and composition with total amount of sleep loss and catch-up sleep. Neither average weekly sleep loss (across all 7 days) nor the increase in sleep on ad libitum days versus baseline was significantly correlated with any of the body weight or composition measures. These data suggest that the catch-up sleep in our study neither attenuated nor exacerbated the effects of SR on body weight or fat mass. It is also possible that the extent of the SR was not large enough to hinder weight loss.
Our results demonstrate adverse effects of chronic SR even when weight loss was relatively small; however, these results cannot be directly generalized to greater amount of weight loss. The different body weight and fat mass between groups at baseline were also a limitation. However, this unbalanced weight and fat between groups unlikely affected the findings regarding the intervention effects because the results remained the same when baseline body weight was adjusted, and weight and fat loss relative to baseline values were similar between groups.
Another limitation was that CR was primarily self-directed, which likely resulted in the lower than planned degree of CR. It is possible that SR has affected caloric/macronutrient intake, and the ghrelin and leptin data suggest that participants in the CR + SR group would have been more inclined to eat more. However, self-reported dietary intake did not indicate different caloric intake between the two groups; the degree of CR may have limited our ability to detect small differences in caloric intake. Furthermore, we were not able to accurately determine the actual degree of CR or modification of diet in individuals given the well-known bias of self-reported dietary intake [40]. Nonetheless, providing lunches and dinners on 4 days each week provided meal samples for participants and helped us to reduce the potential effects of SR on modifying diet. Also, meal timing may change with SR which may have metabolic effects; however, we did not ask participants to record timing of each meal. Additionally, the small sample size was a limitation, especially limiting our ability to analyze data by intervention groups and races.
In summary, this study showed that moderate SR, approximately 60 min reduction in sleep on 5 days a week and ad libitum sleep on the other 2 days, resulted in a less proportion of fat loss but a greater proportion of lean mass loss among the total mass lost in overweight and obese adults undergoing moderate CR. Our data also suggested differential changes in appetite regulatory hormones, which suggest the group which had SR may have a greater risk for weight regain. Future studies are recommended to examine whether these body composition results occur with a greater degree of chronic CR, and to further investigate hormonal changes and whether weight regain afterwards would be affected.
Funding
This work was supported by the American Heart Association grant 14BGIA20380706.
Authors’ Contributions
X.W. designed the study, obtained funding, supervised the study, analyzed and interpreted data, and drafted the manuscript; J.R.S. and K.P.B. acquired data, assisted with data analysis, and reviewed the manuscript; S.D.Y. assisted with obtaining funding, provided consultation to the study, and critically reviewed the manuscript. All authors approved the final version.
Notes
Conflict of interest statement. None declared.


Comments