


Abstract
This study examines the associations between overall pre-sleep arousal, its cognitive and somatic subscales and insomnia symptoms. Furthermore, the relative contribution of genetic and environmental influences on overall pre-sleep arousal, cognitive pre-sleep arousal, somatic pre-sleep arousal, and insomnia symptoms and the association between these variables is estimated.
The cross-sectional data came from G1219 (wave 5), a twin/sibling study which comprised 862 individuals (aged 22–32 years, 34% males). Pre-sleep arousal was measured using the pre-sleep arousal scale and insomnia symptoms using the insomnia symptoms questionnaire.
Both cognitive and somatic pre-sleep arousal were significant, independent factors associated with insomnia symptoms. Overall and somatic pre-sleep arousal showed a significant, substantial genetic influence (47% and 49% respectively) and non-shared environmental influence. For cognitive pre-sleep arousal and insomnia symptoms, non-shared environment appeared to be most important (74% and 61% respectively), and familiality was indicated. A strong, significant association of the genetic influences on overall pre-sleep arousal and insomnia symptoms was found (genetic correlation = .88). Strong, significant genetic correlations were found between cognitive pre-sleep arousal, somatic pre-sleep arousal and insomnia symptoms (genetic correlations .93 to 1). Non-shared environmental influences between these three variables were moderately, significantly correlated (non-shared environmental correlation .22 to .41).
The large overlap of genetic influences between pre-sleep arousal and insomnia symptoms provides novel insight into the associations between these variables. The results indicate that those with cognitive and/or somatic pre-sleep arousal may also have a genetic vulnerability to insomnia symptoms.
Theories of insomnia describe the importance of pre-sleep arousal in the development and maintenance of insomnia. Some research indicates that cognitive and somatic pre-sleep arousal are independent factors associated with insomnia symptoms. While plenty of studies have estimated the genetic and environmental influences on insomnia, no research has yet explored the genetic and environmental influences on pre-sleep arousal and its subscales cognitive and somatic pre-sleep arousal. Furthermore, no research to date has yet explored the extent to which genetic and environmental influences play a role in the association between overall pre-sleep arousal (its subscales cognitive and somatic pre-sleep arousal) and insomnia symptoms. The current study attempts to close this gap in our knowledge.
Introduction
Pre-sleep arousal in theories of insomnia
Multiple theories of insomnia posit that pre-sleep arousal plays a crucial role in insomnia. For example, the “microanalytic model” [1, 2] describes how insomnia is maintained as a vicious cycle of sleep disruption, feeding into arousal, negative cognitions, maladaptive behaviors—all of which again cause disturbance of sleep [2, 3]. This theory considers hyperarousal to be a central element in the development and maintenance of insomnia, as arousal (cognitive, emotional as well as somatic arousal) is a crucial factor in regulating wakefulness and sleep. The various factors interact rather than influence each other in a single direction [2].
The “psychobiological inhibition model of insomnia”, also proposes that the inability to de-arouse is the main problem associated with insomnia [4]. The “cognitive model of insomnia” suggests that increased negative cognitive activation leads to somatic arousal, which is one of the factors that causes distorted perception of sleep deficits during the night and distorted daytime functioning (two characteristics of insomnia) [5].
Cognitive and somatic pre-sleep arousal are often differentiated when discussing their role in insomnia [6, 7]. Somatic arousal refers to physical arousal, including symptoms such as increased heart rate, while cognitive arousal relates to the psychological part including, for example, not being able to “shut off” thoughts [8].
Studies considering EEG, autonomous, neuroimaging, neuroendocrine, and neuro-immunological measures of participants with insomnia also support the concept of increased arousal at night as well as during the day [9, 10]. Based on these findings, the “hyperarousal model of insomnia” by Riemann and colleagues [10] suggests that insomnia is a disorder of hyperarousal during both the day and the night. In conjunction with earlier theories of neurobiological mechanisms involved in the regulation of the wake-sleep rhythm [9, 11, 12], it has been argued that these findings support the idea of a genetic predisposition to hyperarousal and imbalance with sleep-inducing mechanisms. This genetic predisposition makes the individual more vulnerable to experiencing insomnia symptoms and stressors can trigger the vicious cycle of developing insomnia [10].
All of these theories of insomnia agree that arousal is a crucial element in the development and maintenance of insomnia. However, they differ to some extent in the way they explain the link between arousal and insomnia symptoms, for example, whether they differentiate between cognitive and somatic pre-sleep arousal.
Previous findings of pre-sleep arousal and insomnia symptoms
Empirical findings support the idea that pre-sleep arousal plays a crucial role in insomnia. In a small study, insomnia was treated by reducing cognitive arousal and, in turn, somatic arousal, which resulted in improved insomnia symptoms [6]. Interestingly, while subjective sleep improved, no objective evidence of an improvement in sleep was found. It is worth noting, an objective-subjective discrepancy is sometimes found in those reporting insomnia. For example, some studies employing polysomnography have not detected any objective indicators of disturbed sleep even though the participants report insomnia subjectively [13]. This may be related to the complexity of the EEG data or that the analysis methods need to be improved in order to better understand the structure of sleep [13].
Overall, the extent to which a person is easy or difficult to arouse seems to be an important factor in the development and maintenance of insomnia [14]. Furthermore, cognitive and somatic aspects of pre-sleep arousal seem to differ in the role they play in insomnia [15].
In addition, it has been shown that it is important to target pre-sleep arousal when treating insomnia [16, 17]. Cognitive and somatic pre-sleep arousal appear to be independent factors associated with sleep disturbances [8, 18], and the results also indicate that cognitive pre-sleep arousal is associated with sleep disturbances to a greater extent than with somatic pre-sleep arousal [18].
Heritability of pre-sleep arousal
Information is mounting about the heritability of insomnia. For adults, the heritability of insomnia-related measures typically falls into a range between .25 and .45 [19, 20]—with some exceptions giving higher estimates [21]. In contrast to what is currently known about insomnia, genetic and environmental influences on overall pre-sleep arousal as well as its subscales (cognitive and somatic pre-sleep arousal) are yet to be explored. Cognitive and somatic pre-sleep arousal may not just differ in their strength of association with insomnia symptoms but may also differ in their etiology (i.e. the extent to which genetic and environmental influences are involved). Furthermore, behavioral genetic research has not yet examined the extent to which genetic and environmental influences are involved in the association between insomnia and pre-sleep arousal. Understanding more about this association strengthens the conceptualization of the development of this common complaint. Indeed, behavioral genetic research that focuses on the associations between insomnia and other risk indicators has proved to be informative. For example, insomnia symptoms and sleep reactivity (which refers to the extent to which sleep disruption is caused by challenges, such as an important meeting the next day—and is distinct from pre-sleep arousal) share some genetic influences [20, 22]. In the current study, we focus on arousal per se, measuring the two subscales—somatic and cognitive pre-sleep arousal [8].
Aims of the current study
The current study considers how cognitive and somatic arousal differ in their association with insomnia symptoms, as well as in their etiology. It offers a novel approach to explaining the origins of pre-sleep arousal by considering the genetic and environmental influences on this trait (and its subscales). Furthermore, it provides an intriguing, alternative explanation for the link between pre-sleep arousal (and its subscales cognitive and somatic arousal) and insomnia symptoms by focusing on a possible shared genetic vulnerability to both, respectively, considering the extent to which the genetic and environmental influences on these traits overlap. The aims of the current study were to:
1) Consider the magnitude of the associations between overall pre-sleep arousal, its cognitive and somatic arousal subscales, and insomnia symptoms. In line with previous work, we expect insomnia symptoms to be associated more strongly with cognitive rather than with somatic pre-sleep arousal.
2) Estimate the relative contribution of genetic and environmental influences on the variance of: (1) overall pre-sleep arousal; (2) cognitive pre-sleep arousal; (3) somatic pre-sleep arousal; and (4) insomnia symptoms.
3) Estimate genetic and environmental influences on the association between overall pre-sleep arousal and insomnia symptoms, as well as on the associations between cognitive pre-sleep arousal, somatic pre-sleep arousal, and insomnia symptoms.
Methods
Sample
Data from wave 5 of the Genesis 12–19 (G1219) longitudinal twin/sibling study was the focus of this study as this is the only wave at which pre-sleep arousal has been measured. Wave 5 included 862 individuals in total. After excluding 17 outliers, data from 223 monozygotic (MZ) twins, 404 dizygotic (DZ) twins, and 218 siblings remained for the analyses [23]. The participants were aged between 22 and 32 (mean age 25) years and 34.3% of them were male [23]. For wave 5 of the data collection, ethical approval was gained from Goldsmiths, University of London.
Pre-sleep arousal
Pre-sleep arousal was measured using the pre-sleep arousal scale (PSAS) [8]. For each item, participants responded on a scale from 1 (“not at all”) to 5 (“extremely”). For the somatic arousal subscale, responses to items 1 to 8 were summed, and the scores have a theoretical range from 8 to 40 (actual range 8 to 33 in the current sample). Somatic arousal includes items such as “Heart racing, pounding or beating irregularly” [8]. The cognitive pre-sleep arousal subscale was calculated by summing responses for items 9 to 16, with a theoretical range from 8 to 40 (the same as the actual range in the current sample). The cognitive PSAS includes items such as “Worry about falling asleep” [8]. The total pre-sleep arousal score is the sum of all responses. The theoretical range is from 16 to 80 (actual range 16 to 69 in this sample), with higher scores indicating more overall pre-sleep arousal. The Cronbach’s alpha in the current sample was .78 for somatic arousal, .91 for cognitive pre-sleep arousal and .91 for the overall score.
Insomnia symptoms
Insomnia symptoms were measured by the insomnia symptoms questionnaire (ISQ [24], using a 6-item version). The first five items are identical to the first five items in the published version of the ISQ. The sixth question is a single item that captures the distress/impairment criterion of insomnia diagnosis, and was used in place of the eight individual distress/impairment items in the original ISQ. Each item of the ISQ was coded 0 to 4 based on frequency response (never/ don’t know = 0; rarely = 1; sometimes = 2; frequently = 3; always = 4). The measure included items such as “difficulty falling asleep” or “frequent awakenings from sleep” [24]. The total scale score is the sum of these responses, ranging from 0 to 24, with higher scores indicating more severe insomnia symptoms. Cronbach’s alpha for the ISQ in the current sample was .87 (as reported in previous studies [25, 26]).
Analysis
Data preparation
The data were prepared using SPSS [27] (version 22). The variable somatic pre-sleep arousal was skewed (skewness = 1.82, SE = .08; kurtosis = 4.16, SE = .17) and therefore it was +1 log10-transformed, which successfully reduced the skewness (skewness = 1.03, SE = .08; kurtosis = .63, SE = .17). For all variables, outliers more than ±3 SDs away from the mean were excluded from the sample (17 cases in total), as has been done in previous studies [25]. All variables were age and sex regressed for the twin analyses, which is standard in genetic model fitting [28, 29]. For the phenotypic analyses, data from one randomly selected twin/sibling from each pair was used to control for nonindependence of observations [26].
Regression analyses
A regression analysis (controlling for nonindependence of observations) was run in Stata [30] (version SE 14.0) to examine whether cognitive and somatic arousal were independently associated with insomnia symptoms, as has been found in previous research [8, 18]. Whether cognitive as compared to somatic pre-sleep arousal was associated to a greater extent with insomnia symptoms was also considered. The covariates age and sex were added to the regression models.
Twin/sibling analyses
Twin and sibling correlations (within traits) as well as cross-twin-cross-trait correlations, were considered. This allowed for a rough estimation of the relative contributions of additive genetic (A), common or shared-environmental (C), and non-shared environmental (E) influences on pre-sleep arousal (and its cognitive and somatic arousal subscales) and insomnia symptoms [26]. Additive genetic influences refer to the cumulative effects of all genes that may influence a phenotype (i.e. versions of a particular gene at one locus in the genome). Shared-environmental influences are environmental factors which make members of the same family more similar to one another, in contrast to non-shared environmental influences which are those that make members of the same family different [26]. Note that E also includes measurement error [31]. The program R (with a package for genetic model fitting, called OpenMX) was utilized for the twin analyses, using maximum-likelihood estimation to compare model fits [32]. Note that 95% confidence intervals which span 0 (e.g. 95% confidence interval = −1 to 1) should be interpreted as indicating nonsignificance [26, 33].
A univariate analysis was run for each variable (using OpenMX version 1, R version 3.0.3 [32], applying maximum-likelihood model fitting analysis to estimate the relative contribution of genetic, shared, and non-shared environmental influence [34]). A bivariate analysis was run to explore the association between overall pre-sleep arousal and insomnia symptoms. A trivariate analysis was used to consider genetic and environmental factors in the association between cognitive pre-sleep arousal, somatic pre-sleep arousal, and insomnia symptoms. Three possible models were considered: the correlated factors solution, the independent pathway model and the common pathway model.
For the correlated factors solution (including A, C, and E), each trait is assumed to have genetic, shared-environmental and non-shared environmental influences. These influences may correlate with the influences on the other traits in the model [33, 35]. For the independent pathway model, it is assumed that common genetic factors, common shared-environmental factors and common non-shared environmental factors influence the traits directly. In addition, specific genetic, shared-environmental, and non-shared environmental factors are also possible contributors to the variance of each phenotype separately [33].
For the common pathway model it is assumed that genetic, shared-environmental, and non-shared environmental influences affect the variables via a higher order latent (estimated) factor. In addition, specific genetic, shared-environmental, and non-shared environmental factors may contribute to each phenotypes' variance independently [26, 33]. The best-fitting model is presented. Note that, for a trivariate analysis, the correlated factors solution and the independent pathway model have the same number of estimated parameters. Two models can only be compared in fit if one model is nested in the other, meaning that the set of parameters of the first model is a subset of parameters of the second (nested) model [33]. Therefore, we expect these two models to have the same fit and will compare them not to each other but to the common pathway model. Sensitivity analyses were performed by re-running analyses on the raw data (untransformed, prior to exclusions). As the results were similar, those using the transformed data (with exclusions) are presented here.
As power was limited due to the small sample size we decided to present the full (ACE) models to provide maximum information. We also compared the ACE to the E model to detect if there was any familial influence indicated for our variables. If the E model fit is significantly worse than the ACE one, there is familial influence (coming from A or C) [26]. We took this approach instead of presenting, for example, the AE model, as we had limited power to disentangle with certainty whether familial influence had come from A or C. Our limited power is also the reason why we focused on the magnitude of effects when discussing our results and not purely on the significance levels reported [26].
Results
Descriptive statistics
Descriptive statistics for each variable are summarized in Table 1. For overall pre-sleep arousal, significant sex differences were found (t(651) = −2.42, p = .02, d = .17); men reported significantly less overall pre-sleep arousal than women. For somatic pre-sleep arousal men also reported significantly less somatic pre-sleep arousal than women (t(655) = −3.33, p < .01, d = .23). For insomnia symptoms men reported significantly fewer insomnia symptoms than women (t(625) = −3.28, p < .01, d = .25).
Means (SD) of raw scores for overall pre-sleep arousal, cognitive arousal, somatic pre-sleep arousal and symptoms of insomnia
| Means (SD) | ||||||
|---|---|---|---|---|---|---|
| Total | Males | Females | MZ | DZ | Siblings | |
| Overall pre-sleep arousal | 28.39 (9.64) | 27.32 (8.96)* | 28.94 (9.94)* | 28.29 (9.08) | 28.78 (10.42) | 27.98 (8.91) |
| Cognitive pre-sleep arousal | 17.09 (6.76) | 16.60 (6.32) | 17.34 (6.98) | 16.96 (6.42) | 17.31 (7.28) | 16.97 (6.25) |
| Somatic pre-sleep arousal | 11.30 (3.84) | 10.72 (3.54)* | 11.60 (3.96)* | 11.33 (3.70) | 11.47 (4.05) | 11.01 (3.67) |
| Insomnia symptoms | 6.48 (5.22) | 5.65 (4.89)* | 6.92 (5.33)* | 6.09 (4.97) | 6.68 (5.38) | 6.61 (5.19) |
Means and SD were obtained from SPSS and are based on the raw data (untransformed, including outliers, etc.); MZ = monozygotic twins; DZ = dizygotic twins; siblings = non-twin sibling pairs; Overall Pre-sleep, Cognitive Pre-sleep and Somatic Pre-sleep Arousal are based on the PSAS, higher scores indicate higher pre-sleep arousal; Insomnia Symptoms are based on the ISQ, higher scores indicate more insomnia symptoms.
*Sex differences were found.
Phenotypic correlations
The phenotypic correlations for all variables are displayed in Table 2. Higher overall pre-sleep arousal was associated with more insomnia symptoms (r = .61, p < .01). Higher cognitive pre-sleep arousal and higher somatic pre-sleep arousal were also associated with more insomnia symptoms (r = .62, p < .01, r = .44, p < .01 respectively). Cognitive and somatic pre-sleep arousal were also highly correlated (r = .60, p < .01). The correlation between cognitive pre-sleep arousal and insomnia symptoms was significantly larger than that between somatic pre-sleep arousal and insomnia symptoms (p < .01; using JavaScript to compare the magnitude of the correlations [36, 37]). These associations were further examined in a regression analysis (see information below).
Phenotypic correlations for overall pre-sleep arousal, cognitive pre-sleep arousal, somatic pre-sleep arousal and symptoms of insomnia
| Overall pre-sleep arousal | Cognitive pre-sleep arousal | Somatic pre-sleep arousal | Insomnia symptoms | |
|---|---|---|---|---|
| Overall pre-sleep arousal | 1 | |||
| Cognitive pre-sleep arousal | .95* | 1 | ||
| Somatic pre-sleep arousal | .81* | .60* | 1 | |
| Insomnia symptoms | .61* | .62* | .44* | 1 |
Correlations were calculated on age- and sex-regressed variables, and after outliers (±3 SD away from the mean) were excluded and data was transformed if necessary, using twin 1 only to control for nonindependence of observations. Overall Pre-sleep, Cognitive Pre-sleep and Somatic Pre-sleep Arousal are based on the PSAS, higher scores indicate higher pre-sleep arousal; Insomnia Symptoms are based on the ISQ, higher scores indicate more insomnia symptoms.
* p < .01.
Regression analyses
In the regression, the overall model was significant F(4,546) = 141.46, p < .01, and explained 38% (adjusted R2 = .38) of the variance of insomnia symptoms in the model. Sex was a significant factor (B(SE) = .77(.30); ß = .07; t = 2.59; p = .01), while age was nonsignificant (B(SE) = .10(.08); ß = .04; t = 1.27; p = .21). Both cognitive (B(SE) = .39(.03); ß = .50; t = 14.46; p < .01) and somatic pre-sleep arousal (B(SE) = .68(.17); ß = .15; t = 3.97; p < .01) were significantly associated with insomnia symptoms.
MZ, DZ, and sibling correlations
The MZ, DZ, and sibling within-trait and cross-trait-cross-twin correlations for all variables are presented in Table 3. The MZ correlations for all variables were greater (although not significantly so, as indicated by overlapping confidence intervals) than the DZ and the sibling correlations, indicating possible genetic influence. The correlations of the MZ twins are substantially less than 1 for all of the traits, highlighting the importance of non-shared environmental influence (E; including error) [26].
Twin/sibling correlations for overall pre-sleep arousal, cognitive arousal, somatic pre-sleep arousal, and insomnia symptoms
| Correlations | |||
|---|---|---|---|
| MZ | DZ | Siblings | |
| Within-trait | |||
| Overall pre-sleep arousal | .42* (.24–.57) | .26* (.10–.40) | .13 (−.10 to .34) |
| Cognitive pre-sleep arousal | .30* (.10–.47) | .25* (.09–.39) | .11 (−.11 to .33) |
| Somatic pre-sleep arousal | .44* (.28–.58) | .20* (.03–.35) | .11 (−.12 to .32) |
| Insomnia symptoms | .37* (.19–.53) | .21* (.05–.36) | .12 (−.13 to .34) |
| Cross-traits-cross-twins | |||
| Cogn. pre-sleep arousal - Som. pre-sleep arousal | .41* (.27–.52) | .09 (−.03 to .21) | .13 (−.12 to .32) |
| Cogn. pre-sleep arousal - Insomnia symptoms | .33* (.18–.46) | .18* (.05–.29) | .19 (−.04 to .38) |
| Som. pre-sleep arousal - Insomnia symptoms | .38* (.26–.48) | .08 (−.05 to .20) | .09 (−.12 to .28) |
The 95% confidence intervals are presented in brackets. MZ = monozygotic twins; DZ = dizygotic twins; Siblings = sibling pairs; Cogn. pre-sleep arousal = cognitive pre-sleep arousal (PSAS subscale), Som. pre-sleep arousal = somatic pre-sleep arousal (PSAS subscale), higher scores indicating higher pre-sleep arousal; Insomnia symptoms = insomnia symptoms (ISQ), higher scores indicating more insomnia symptoms.
*Significant correlations (95% CI not spanning 0).
Twin/sibling analyses
The fit statistics of the univariate models and the results (estimates for A, C, and E with 95% confidence intervals) are shown in Table 4. For somatic pre-sleep arousal, the MZ correlation was more than twice the DZ correlation (somatic pre-sleep arousal: rMZ = .44, rDZ = .20). This suggests possible nonadditive genetic effects, namely dominance (D). Therefore, the ADE model was also tested for this variable, but D was not significant in the model (95% confidence interval overlapping 0). Therefore, the ADE model is not presented here. Overall pre-sleep arousal and somatic pre-sleep arousal showed substantial, significant genetic influence (overall pre-sleep arousal: A = .47, 95% confidence interval = .19–.60; somatic pre-sleep arousal: A = .49, 95% confidence interval = .24–.61). There was no shared-environmental influence, but a high, significant non-shared environmental influence was indicated (overall pre-sleep arousal: E = .53, 95% confidence interval = .40–.70; somatic pre-sleep arousal: E = .51, 95% confidence interval = .39–.67). When the ACE model and the E model were compared for these variables, the fit declined significantly in both cases (χ2 = 6054.39, df = 834, p < .01, Akaike Information Criterion (AIC) = 43836.39 for overall pre-sleep arousal; and χ2 = 2536.12, df = 835, p < .01, AIC = 866.12 for somatic pre-sleep arousal), indicating a significant familial influence. For cognitive pre-sleep arousal and insomnia symptoms, non-shared environment appeared to be most important (cognitive pre-sleep arousal: E = .74, 95% confidence interval = .56–.90; insomnia symptoms: E = .61, 95% confidence interval = .47–.80). The estimate for genetic influence was low to moderate but not significant for both variables (cognitive pre-sleep arousal: A = .13, 95% confidence interval = 0–.44; insomnia symptoms: A = .36, 95% confidence interval = 0–.53), neither were the low estimates for shared-environmental influence significant (cognitive pre-sleep arousal: C = .13, 95% confidence interval = 0–.31; insomnia symptoms: C = .03, 95% confidence interval = 0–.32). However, familiality was indicated in both cases as the fit of the E model was significantly worse compared to the ACE model (χ2 = 5559.70, df = 838, p < .01, AIC = 3883.70 for cognitive pre-sleep arousal and χ2 = 5135.58, df = 837, p < .01, AIC = 3461.58 for insomnia symptoms). Fit statistics for the bivariate and trivariate analyses are presented in Table 5.
Fit statistics of all univariate genetic model fitting analyses and estimates for A, C, and E
| Variable/Model | ep | −2LL | df | AIC | ∆ −2LL | ∆ df | p | Parameter estimates | ||
|---|---|---|---|---|---|---|---|---|---|---|
| A (CI) | C (CI) | E (CI) | ||||||||
| Overall pre-sleep arousal | ||||||||||
| Saturated | 15 | 6006.78 | 821 | 4364.78 | - | - | - | |||
| ACE | 4 | 6028.64 | 832 | 4364.64 | 21.85 | 11 | .03 | .47 (.19–.60) | 0 (0–.17) | .53 (.40–.70) |
| E | 2 | 6054.39 | 834 | 4386.39 | 25.75 | 2 | <.01 | |||
| Cognitive pre-sleep arousal | ||||||||||
| Saturated | 15 | 5529.05 | 825 | 3879.05 | - | - | - | |||
| ACE | 4 | 5547.11 | 836 | 3875.13 | 18.08 | 11 | .08 | .13 (0–.44) | .13 (0–.31) | .74 (.56–.90) |
| E | 2 | 5559.70 | 838 | 3883.70 | 12.57 | 2 | <.01 | |||
| Somatic pre-sleep arousal | ||||||||||
| Saturated | 15 | 2497.20 | 822 | 853.20 | - | - | - | |||
| ACE | 4 | 2505.77 | 833 | 839.77 | 8.56 | 11 | .66 | .49 (.24–.61) | 0 (0–.15) | .51 (.39–.67) |
| E | 2 | 2536.12 | 835 | 866.12 | 30.35 | 2 | <.01 | |||
| Insomnia symptoms | ||||||||||
| Saturated | 15 | 5096.90 | 824 | 3448.90 | - | - | - | |||
| ACE | 4 | 5112.43 | 835 | 3442.43 | 15.53 | 11 | .16 | .36 (0–.53) | .03 (0–.32) | .61 (.47–.80) |
| E | 2 | 5135.58 | 837 | 3461.58 | 23.15 | 2 | <.01 |
All analyses focus on the transformed data, outliers deleted with age and sex regressed out. ep = estimated parameters; −2LL = −2*(log likelihood); df = degrees of freedom; ∆χ2 = change in chi-square statistic; ∆df = change in degrees of freedom; AIC = Akaike’s Information Criterion statistic; Saturated = full model, A = additive genetic, C = shared environmental, E = non-shared environmental, CI = 95% confidence intervals. The fit of the ACE model is relative to saturated model, the fit of the E model relative to ACE model.
Fit statistics for the multivariate genetic model fitting analyses
| ep | −2LL | df | AIC | ∆ −2LL | ∆ df | p | |
|---|---|---|---|---|---|---|---|
| Model: Overall pre-sleep arousal and symptoms of insomnia | |||||||
| Saturated | 42 | 10739.18 | 1633 | 7473.18 | - | - | - |
| ACE | 11 | 10781.59 | 1664 | 7453.59 | 42.41 | 31 | .08 |
| Model: Cognitive pre-sleep arousal, somatic pre-sleep arousal and symptoms of insomnia | |||||||
| Saturated | 81 | 12357.87 | 2435 | 7487.87 | - | - | - |
| ACE Correlated Factors Solution | 21 | 12427.52 | 2495 | 7437.52 | 69.65 | 60 | .18 |
| ACE Independent Pathway | 21 | 12427.52 | 2495 | 7437.52 | 69.65 | 60 | .18 |
| ACE Common Pathway | 18 | 12437.32 | 2499 | 7439.32 | 9.80 | 4 | .04 |
All analyses focus on the transformed data, outliers deleted with age and sex regressed out. ep = estimated parameters; −2LL = −2* (log likelihood); df = degrees of freedom; ∆χ2 = change in chi-square statistic; ∆df = change in degrees of freedom; AIC = Akaike’s Information Criterion statistic; Saturated = full model; A = additive genetic, C = shared environmental, E = non-shared environmental. The fit statistics of the ACE correlated factors model, the ACE independent pathway model are relative to the saturated model. The fit statistic of the ACE common pathway model is relative to the ACE correlated factors model.
The results of the bivariate analyses including overall pre-sleep arousal and insomnia symptoms are presented in Figure 1. There was a high, significant correlation for the genetic influences on overall pre-sleep arousal and insomnia symptoms (rA = .88, 95% confidence interval = .61–1). The correlation for the shared-environmental factors on both traits was not significant, (rC = 1, 95% confidence interval = −1 to 1). Furthermore, there was a moderate, significant overlap in the non-shared environmental influences (rE = .42, 95% confidence interval = .27–.55) for the two traits.
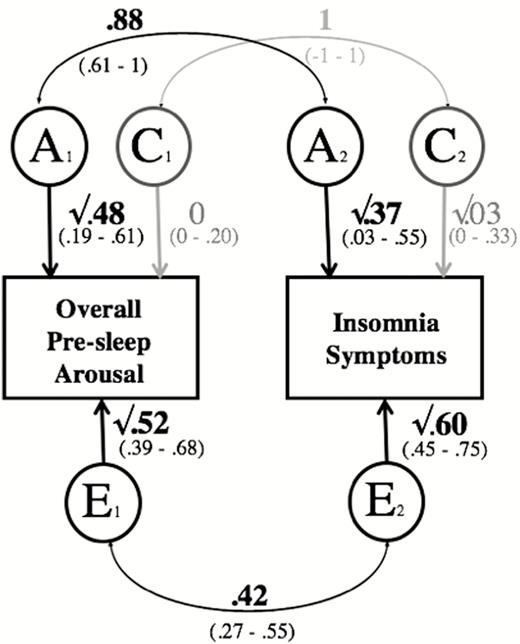
Path diagram of the bivariate analysis, including overall pre-sleep arousal and insomnia symptoms. Note: A = additive genetic; C = shared environmental; E = non-shared environmental. Significant paths are shown in black, see brackets for 95% confidence intervals (CIs). Paths with confidence intervals spanning 0 are depicted in gray. rPh = .61 (95% CI = .55–.66). Overall Pre-Sleep Arousal = overall pre-sleep arousal (PSAS), higher scores indicating higher overall pre-sleep arousal; Somatic Pre-Sleep Arousal = somatic pre-sleep arousal (PSAS subscale), higher scores indicating higher somatic pre-sleep arousal; Insomnia Symptoms = insomnia symptoms (ISQ), higher scores indicating more insomnia symptoms.
For the trivariate analyses including cognitive pre-sleep arousal, somatic pre-sleep arousal and insomnia symptoms, the fit of the correlated factors solution and the independent pathway model (χ2 = 12427.52, df = 2495, p = .18, AIC = 7437.52) were the same. This was to be expected because the two models have the same number of estimated parameters (see explanation above).
The common pathway model was significantly worse than the correlated factors model (χ2 = 12437.32, df = 2499, p = .04, AIC = 7439.32). Therefore, the correlated factor solution and the independent pathway model were the best-fitting models. We decided to present only the correlated factors model (Figure 2, a–c), as it is typically considered to be the most straightforward one to interpret.
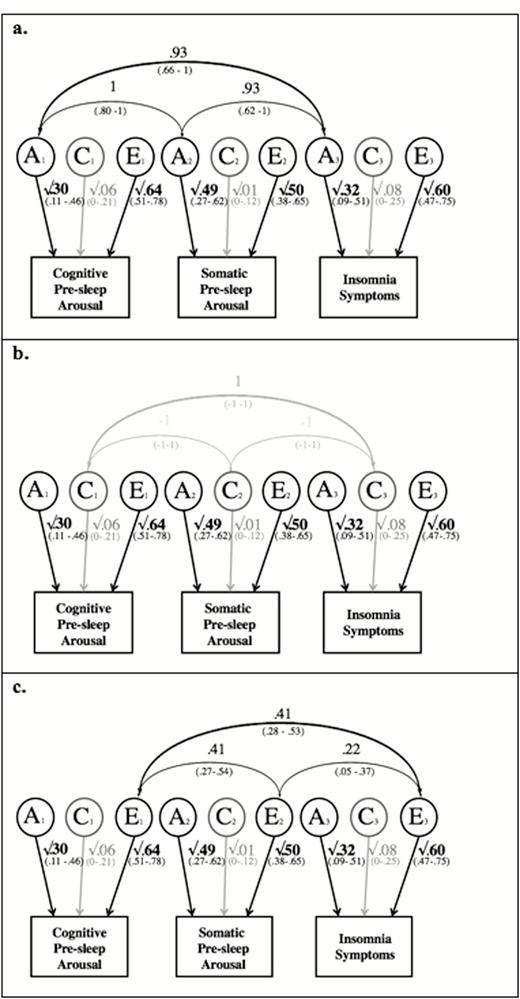
Path diagram of the correlated factors solution, including cognitive pre-sleep arousal, somatic pre-sleep arousal, and insomnia symptoms. Note: A = additive genetic; C = shared environmental; E = non-shared environmental. Significant paths are shown in black. Paths with confidence intervals spanning 0 are depicted in gray. Cognitive Pre-sleep Arousal = cognitive pre-sleep arousal (PSAS subscale), higher scores indicating higher cognitive pre-sleep arousal; Somatic Pre-sleep Arousal = somatic pre-sleep arousal (PSAS subscale), higher scores indicating higher somatic pre-sleep arousal; Insomnia Symptoms = insomnia symptoms (ISQ), higher scores indicating more insomnia symptoms; (a) shows the genetic correlations; (b) shows the shared-environmental correlations; (c) shows the non-shared environmental correlations.
From Figure 2a, we can see that the genetic influences on cognitive pre-sleep arousal, somatic pre-sleep arousal and insomnia symptoms are all highly and significantly correlated (ranging from .93 to 1; 95% confidence intervals ranging from .62–1 to .80–1). The shared-environmental influences between the three traits were indicated not to be significant (1 or −1; 95% confidence intervals all −1 to 1); Figure 2b. As Figure 2c shows, the non-shared environmental influences between cognitive pre-sleep arousal, somatic pre-sleep arousal and insomnia symptoms were moderately, significantly correlated (ranging from .22-.41; 95% confidence intervals ranging from .05-.37 to .28-.53). For further illustration of the results, the relative contributions of A, C, and E to the phenotypic correlations are displayed in Figure 3. As the figure shows, genetic influences are very important in explaining the association between cognitive pre-sleep arousal and somatic pre-sleep arousal, as well as the association between somatic pre-sleep arousal and insomnia symptoms and are most important in explaining the association between cognitive pre-sleep arousal and insomnia symptoms. Non-shared environment was also important in explaining the association between all three variables.
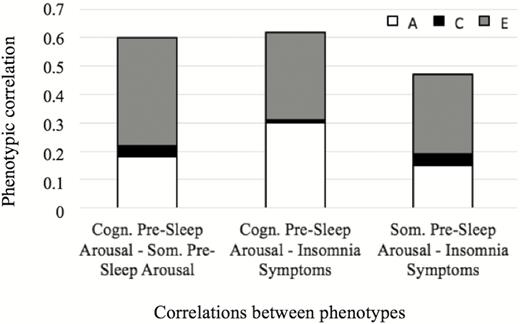
Relative contributions of A, C, and E to the overall phenotypic correlations. Note: A = additive genetic, C = shared environmental, E = non-shared environmental. Cogn. Pre-sleep Arousal = cognitive pre-sleep arousal (PSAS subscale), higher scores indicating higher cognitive pre-sleep arousal; Som. Pre-Sleep Arousal = somatic pre-sleep arousal (PSAS subscale), higher scores indicating higher somatic pre-sleep arousal; Insomnia Symptoms = insomnia symptoms (ISQ), higher scores indicating more insomnia symptoms.
Discussion
The first aim of the current study was to consider the magnitude of the associations between overall pre-sleep arousal, its cognitive and somatic arousal subscales and insomnia symptoms. We examined the extent to which cognitive and somatic pre-sleep arousal were associated with insomnia symptoms and whether cognitive and somatic pre-sleep arousal were independent factors associated with insomnia symptoms. A further aim was to estimate the relative contribution of genetic and environmental influences on overall pre-sleep arousal, cognitive pre-sleep arousal, somatic pre-sleep arousal, and insomnia symptoms. Furthermore, our objective was to estimate the genetic and environmental influences on the associations between the variables.
Association between variables
Overall pre-sleep arousal, as well as cognitive and somatic pre-sleep arousal were found to be associated with insomnia symptoms, which is in line with current theories of insomnia [4, 5, 38, 39]. The correlation between cognitive pre-sleep arousal and insomnia symptoms was significantly greater than that between somatic pre-sleep arousal and insomnia symptoms. The regression analysis further showed that both cognitive and somatic pre-sleep arousal were significant and independently associated with insomnia symptoms (with cognitive arousal being slightly more strongly associated than somatic arousal) which complements previous findings [8, 18].
Familial influences
This was the first study to estimate the heritability of pre-sleep arousal and its subscales. The twin analyses revealed that overall pre-sleep arousal and somatic pre-sleep arousal showed a significant and substantial genetic influence and a high, significant non-shared environmental influence. For cognitive pre-sleep arousal and insomnia symptoms, non-shared environment appeared to be most important but overall familiality was indicated. Finding a substantial genetic influence for somatic pre-sleep arousal but not for cognitive arousal is interesting. It may be that our genes play an important role in helping to explain why one person feels more physically aroused before bedtime than another person. Environmental influences might be key in explaining why one person is more likely than another to have thoughts running through their head in the pre-sleep period. These findings further emphasize that cognitive and somatic pre-sleep arousal do not just differ in their association with insomnia symptoms but they may also differ in terms of their etiology.
There was a high, significant association for the genetic influences in overall pre-sleep arousal and insomnia symptoms, and a moderate yet significant overlap in the non-shared environmental influences for both traits. This adds to our understanding of the current theories of insomnia all of which agree that arousal plays a crucial role in the development and maintenance of insomnia, even though they differ in the way they explain how these two traits are linked [1, 2, 4, 5, 10]. The current results show that genetic factors contribute to both pre-sleep arousal and insomnia symptoms and that non-shared environmental influences may also play a role.
High and significant genetic correlations were found for cognitive pre-sleep arousal, somatic pre-sleep arousal, and insomnia symptoms in a trivariate analysis. The non-shared environmental influences between cognitive pre-sleep arousal, somatic pre-sleep arousal, and insomnia symptoms were significantly, moderately correlated. As cognitive pre-sleep arousal, somatic pre-sleep arousal, and insomnia symptoms showed a high, significant genetic correlation, the findings indicate that this symptom cluster may perhaps also be part of the same genetic cluster (as indicated in previous research, e.g. for sleep disturbances and depression disorders [40]). The findings also show that those experiencing cognitive and/or somatic pre-sleep arousal may also have an increased genetic vulnerability for insomnia symptoms, which is in line with the “hyperarousal model” [10]. The findings are also consistent with the idea that pre-sleep arousal is a maintaining factor for insomnia, as suggested in various theories of insomnia. However, the current findings cannot establish the direction of effects, as was for example suggested in the “cognitive model” [4, 5]. The findings help us to gain a better understanding of the etiology of insomnia and the role that pre-sleep arousal plays in insomnia. The results underline the close links between pre-sleep arousal and insomnia symptoms and may further help us understand why targeting pre-sleep arousal is effective in the treatment of insomnia [16, 17].
Limitations
There are limitations relating to the assumptions made by the twin design [31]. For example, we assume that the environment is equally similar for DZ twins as it is for MZ twins. However, research suggests that this may not always be true. For example, previous work has found that MZ twins share a bedroom more frequently than do DZ twins of the same sex [41]. This could have an effect on sleep both in the short term and over time and could potentially also effect pre-sleep arousal.
A further limitation is that a trait in one twin may influence that in another. For example, if twins share the same bedroom and one has a sleep problem, this may impact upon the sleep of the other sibling [41]. In addition, while results from twin studies are used to draw conclusions about individual differences in the general population, it is possible that twins may not be representative of the wider non-twin population [42]. However, there is evidence indicating that twins do not differ from non-twins in terms of insomnia [43].
Another limitation relates to the use of self-report measures, which may have artificially inflated associations. This was necessary given the scope of the study (i.e. assessing numerous variables in a sample of many hundreds of participants) and this is also considered to be the optimal approach for assessing certain phenotypes (e.g. insomnia symptoms) that are defined by self-report. Nevertheless, future work may benefit from incorporating additional information (e.g. objective measures of sleep and arousal) [26].
A further limitation relates to the sample size of the current study, which was relatively small for a twin study and leads to wide confidence intervals for some of the analyses. This is why we have also taken into account the magnitude of associations and do not exclusively focus on overall significance. While our estimate of genetic influence on insomnia symptoms was not significant (95% confidence interval including 0), the magnitude of our estimate was .36, which is in the middle of the range that we expected (heritability of insomnia-related measures typically falls into a range between .25 and .45 [19, 20]; although there are some exceptions [21]). Furthermore, familiality was evident, meaning that influence was shown to come from A and/or C. The same estimate for the heritability of insomnia has also been reported for the G1219 sample in a previous study [25]. Therefore, our results are largely in line with previous findings but reflect our relatively small sample size. Further work using larger samples would therefore be of value.
Nevertheless, there was significant genetic influence on overall pre-sleep arousal and somatic pre-sleep arousal, and the current findings are largely in line with previous findings. For example, cognitive and somatic pre-sleep arousal were indicated to be independent factors associated with insomnia symptoms and the magnitude of the association with insomnia symptoms was found to be greater for cognitive pre-sleep arousal as opposed to somatic pre-sleep arousal [8, 18].
Conclusion
The current findings are novel and help us to gain a better understanding of pre-sleep arousal, insomnia and the association between those two traits. This research represents a novel understanding of the mechanisms underlying the link between pre-sleep arousal and insomnia symptoms and sheds new light on the principles discussed in the theories of insomnia. Further research into cognitive and somatic pre-sleep arousal within the context of insomnia would be useful as it could potentially help to provide information that could be used to prevent or mitigate the effects of insomnia and to improve the treatment of insomnia as we gradually begin to understand the concept in greater depth.
Acknowledgments
We thank the families for their participation as well as numerous staff and students from the Social, Genetic, Developmental Psychiatry Centre, Institute of Psychiatry, London and Goldsmiths, University of London. A particular thanks goes to Thalia C. Eley—founder of the G1219 study and Rachael O’Leary and Danielle Bream for all of their input at wave 5.
Funding
Waves 1–3 funded by the W T Grant Foundation, the University of London Central Research Fund and a Medical Research Council Training Fellowship (G81/343) and Career Development Award to Thalia C. Eley. Wave 4 supported by the Economic and Social Research Council (RES-000-22-2206) and the Institute of Social Psychiatry (06/07–11) to A.M.G. Wave 5 was supported by funding to A.M.G. by the Department of Psychology, Goldsmiths, University of London.
Conflict of interest statement D.B. is working as a consultant for Bayer, BeHealth Solutions and Emmi Solutions. He is receiving license fees for the Pittsburgh Sleep Quality Index (PSQI), the Daytime Insomnia Symptoms Scale (DISS) and the Brief Behavioral Treatment of Insomnia (BBTI). He is associated with the CME Institute. A.M.G. is an advisor for a project sponsored by Johnson’s Baby. She has written a book Nodding Off (Bloomsbury Sigma, 2018) and has a contract for a second book Sleepy Pebble (Nobrow). She is a regular contributor to BBC Focus magazine and has contributed to other outlets (such as The Conversation, The Guardian and Balance Magazine). She occasionally receives sample products related to sleep (e.g. blue light blocking glasses) and has given a paid talk to a business. M.N.S., D.D., and Y.K. have no conflict of interest.


Comments