


Abstract
This article provides a long-term view on the sources of knowledge flow between developed and developing nations. It relies on patent data to explore three potential sources: R&D collaboration, technology sourcing, and technology transfer. All three sources provide a very consistent message. First, knowledge flows from East Asia, particularly China, are occurring more frequently. Second, knowledge flows are increasingly concentrated in information and communication technologies. Third, the USA and Canada had traditionally larger patenting activity with Asia than Europe, but the share of activity between Europe and Asia has been increasing in recent years. Larger patenting activity between the USA and Canada and Asia implies that North America is more likely to benefit from the reverse knowledge flows than Europe as China progresses toward becoming a technological leader.
1. Introduction
Research and development (R&D) globalization is a defining feature of modern innovation systems and a major driver of productivity growth (Eaton and Kortum 1996; Thomson and de Rassenfosse 2019). Innovating firms set up R&D labs abroad or cooperate with foreign partners to tap into an ever more globally dispersed knowledge frontier and to reduce R&D costs (Harhoff et al. 2014).
From the viewpoint of host countries, policy makers are keen to attract foreign R&D. The knowledge that flows from foreign R&D may be appropriated by local firms and raise their productivity level. If appropriation takes place without local firms contributing to the cost of the research, one talks of ‘knowledge spillovers’. Appropriation can also occur in the context of a transaction on the market for technology (Arora et al. 2004).
The existence of cross-border knowledge flows has been well documented in the academic literature. Most of the literature tracks knowledge flows by means of patent citations, where citations are measured between a citing and a cited country, industry or firm (see, e.g. Jaffe and Trajtenberg 1999; Maruseth and Verspagen 2002; Peri 2005). The vast majority of studies focus on developed economies—literature on developing economies is scarcer (see, e.g. Svensson 2007). For developing countries, attracting foreign knowledge from more developed regions is both crucial and challenging. It is crucial because knowledge flows from the technology frontier are a key source of learning (Griffith et al. 2004; Seliger 2016). It is challenging because developing countries lack the knowledge base and infrastructure to fully benefit from them. From the viewpoint of a developed country, conducting R&D activities in or together with developing countries is also both challenging and crucial. The challenges mainly lie in usually weak intellectual property right regimes and in uncertain political and economic contexts. However, developing countries act as important suppliers of specific technologies and provide human capital necessary for the division of labor (Branstetter et al. 2014; Zhao 2006). In addition, they may have large populations making them attractive markets.
This article contributes to the literature on cross-border knowledge flows in two ways. First, it puts the spotlight on flows between developed and developing economies. Second, it focuses on some potential sources of knowledge flows rather than on documenting their existence. We explore three potential sources: R&D collaboration, technology sourcing, and technology transfer.1 We quantify these sources by means of patent data. In contrast to prior studies that focus on patents filed at selected patent offices in the USA or Europe, our analysis considers fifty-two patent offices in the world.2
Research and development collaboration is measured by looking at patents that are coinvented or coapplied by parties in two different countries. Technology sourcing is measured by patents that are applied by a party in one country but invented in another country. Finally, knowledge transfer is measured using information on the transfers of ownership (i.e. sales) of patents.
We find that there has been a large shift toward R&D collaboration and technology sourcing with Asian countries (especially China) in the last two decades. Today, Asia is the prime place for R&D collaboration and technology sourcing for Western economies. We also find that R&D collaboration and technology sourcing mainly take place in the information and communication technology (ICT) sector and especially in computer technology. Regarding patent transfers, we document an important increase in the last decade, although overall levels remain low. East Asia is the largest recipient region among developing countries. Patent transfers from developing to developed economies also exist, although the volumes are more modest, reaching about a third of the volumes of the opposite direction.
2. Method and data
In contrast to the studies that seek to assess the effect of knowledge flows on the sending or receiving country, this article focuses on the sources of knowledge flows. It is well documented that interpersonal and inter-firm collaborations raise knowledge flows between the parties involved (Agrawal et al. 2006; Gomes-Casseres et al. 2006; Singh 2005). We discuss the three potential sources in turn.
2.1 Measuring R&D collaboration with patent data
Cross-border R&D collaboration occurs when firms from different countries work together on an invention or when inventors from different countries work together. These aspects can be measured by looking at applicant–applicant and inventor–inventor pairs of the patent documents respectively (see Guellec and van Pottelsberghe de la Potterie 2001; Kerr and Kerr 2018; Picci 2010; Picci and Savorelli 2018). In the context of this study, one applicant (inventor) must come from a developed country and the other from a developing country.
Consider, for example, the case of patent application number FR2965057A1 filed on 22 September 2010 at the French patent office. This patent was coapplied by two organizations, namely, the Soils and Fertilizers Research Institute (Vietnam) and the Institut de Recherche pour le Développement (France). This patent was most likely the result of R&D collaboration between these two institutes.
Note that the term ‘collaboration’ is more appropriate for inventor–inventor pairs than for applicant–applicant pairs. The fact that a patent is coapplied does not necessarily imply that applicants are on equal footing. The patent could be fully developed by a subsidiary and coapplied by the subsidiary and the headquarter. Our data do not include ownership information, and thus we are unable to assess whether patents arise from collaboration between two related entities. As we will see, however, insights obtained from applicant–applicant pairs are very similar to the insights obtained from inventor–inventor pairs.3
Most research in the field relies on the count of patents filed at major patent offices, such as the European Patent Office (EPO 2016) or the United States Patent and Trademark Office (USPTO). However, the patenting activity at these offices may not necessarily be representative of the overall situation across the globe.
By contrast, the present analysis exploits the worldwide count of priority filings put forward by de Rassenfosse et al. (2013). This patent count identifies all priority patent applications filed worldwide and assigns them to the country of residence of the applicant and/or inventor. The data come from the EPO’s Worldwide Patent Statistical Database (PATSTAT 2016, autumn edition).4 A priority patent application is the first patent application that is filed to protect an invention anywhere in the world. The implementation of this count is quite challenging because of missing data on the inventors’ and applicants’ countries of residence in PATSTAT. The authors have proposed a technical solution for recovering missing information on countries of residence that involves exploiting patent family information. Briefly, the technical solution involves looking for information on the countries of residence of applicants and inventors in the subsequent patent applications that belong to the same family.5 Subsequent filings are typically made in other jurisdictions (i.e. at other patent offices) than the priority filing but this needs not be the case. The ‘worldwide count of priority filings’ considers fifty-two patent offices and seeks to impute potential missing country information (for more details, see Appendix Section A2).
2.2 Measuring technology sourcing with patent data
We measure technology sourcing by considering patents for which applicants and inventors are located in different countries. In our context, one country needs to be a developed country and the other a developing country. Such patents can indicate R&D offshoring or external R&D contracting. In case of R&D offshoring, the inventor works for a foreign subsidiary whereas the patent is filed by the mother company. In case of R&D contracting, a firm contracts out research to a R&D supplier.
Consider, for example, patent application number DE102011014441A1 filed on 18 March 2011 at the German patent office. The sole applicant was the Germany-based automotive company Daimler AG and the all inventors were located in Pune, India. The Daimler group had an R&D center in Pune, India, and the patent application was therefore the result of R&D offshoring.
The literature usually identifies three main motives for technology sourcing. First, the technology-seeking motive relates to firms tapping into frontier knowledge that is not available in their home country. Second, the market-seeking motive relates to firms seeking to enter new markets, and involves adapting home technology to local specificities. Third, the cost-reduction motive relates to performing R&D tasks in a country with cheaper labor (Chung and Alcácer 2002; Dunning and Lundan 2008). The data at hand do not allow us to distinguish between the various motives but we note that one or more of these motives may be at play.
The count again relies on priority filings with imputed applicant and inventor country information. We exclude patents that were also coapplied (i.e. patent applications that were filed by applicants from both the developing and developed countries). This restriction ensures that we exclude patents arising from technology collaboration and, therefore, we identify more accurately cases of technology sourcing.
2.3 Measuring technology transfer with patent data
We measure technology transfer using detailed information on the transfers of ownership, that is, the sale of patents. We rely on the register of the EPO for patent applications, and on the register of the German Patent Office (DPMA) for granted European patents (EPs). Indeed, once an EP application has been granted by the EPO, it is transformed into a bundle of national patents. This implies that, before grant, a transfer of patent ownership should be registered at the EPO, while after grant the transfer has to be registered in national offices of countries in which the patent has been validated.6 Germany is the country with the largest proportion of validated EPs (95 per cent in 2003). It is therefore the most complete source for post-grant changes of ownership of EPs (Harhoff et al. 2009).
It should be mentioned that registering a transfer of patent ownership is mandatory neither at the EPO nor at the DPMA. There are nevertheless strong incentives for patent purchasers to register patent acquisitions, as the lack of registration may have severe consequences. Indeed, in many European countries, the non-registration of patent transfers considerably hinders the enforcement of patent rights in case of litigation (see Ciaramella et al. 2017 for a more detailed discussion). In comparison with the amounts at stake before courts, the costs of registering a transfer of ownership are negligible.7
Note that the countries of patent protection (in our setting, European countries) and of patent ownership are distinct. For example, it is possible for an EP to be owned by a US firm and transferred to a Chinese firm. Thus, we are able to provide a global view of patent transfers even using EPs alone.
Consider, for example, patent application number EP1905886A1 filed on 2 April 2008 at the EPO. This patent was developed by the Germany-based company AMTEC Wäschereimaschinen GmbH. It was then transferred on 7 July 2010 to Supreme Machinery Manufacturing Co. Ltd. based in Thailand.
Empirical large-scale research investigating the transfers of patent ownership is recent. It started with Serrano (2010), which provides insights on the sale of US patents. Several studies have contributed to this emerging stream of literature, most of them focusing on the market for US patents (e.g. De Marco et al. 2017; Galasso et al. 2013). Literature on EPs is scarcer (see Bösenberg and Egger 2017; Ciaramella et al. 2017 for notable exceptions).
3. Descriptive statistics
In this article, we focus on two regions of developed countries, namely, ‘core Europe’ and ‘USA and Canada’. Appendix Section A1 explains how we allocate countries to groups of developed and developing countries. Section A3 discusses the allocation of patents to technological fields. Appendix Table A.2 shows the number of priority patent filings by applicants in countries of core Europe, the USA and Canada, and in developing countries in 1990, 2000, and 2010. It also shows the number of priority filings for each source of knowledge flow by partner region.8 The number of priority filings has increased tremendously in developing countries (2000: 44,613; 2010: 297,377), but this increase is primarily driven by East Asia (and especially by China). The increase is more modest if we exclude East Asia but nevertheless significant (2000: 22,016; 2010: 35,872).9 The number of priority filings that were coapplied/coinvented (suggestive of R&D collaboration), sourced or transferred is small relative to the number of total priority filings. The most notable pattern concerns the increase in international R&D collaboration. In 1990, about 1.2 per cent of priority filings applied for by European applicants were coapplied in other regions (2.2 per cent for the US and Canadian applicants). This figure reaches about 6.7 per cent in 2010 (16.5 per cent). Interestingly, technology sourcing has experienced almost no increase in relative terms.
3.1 R&D collaboration
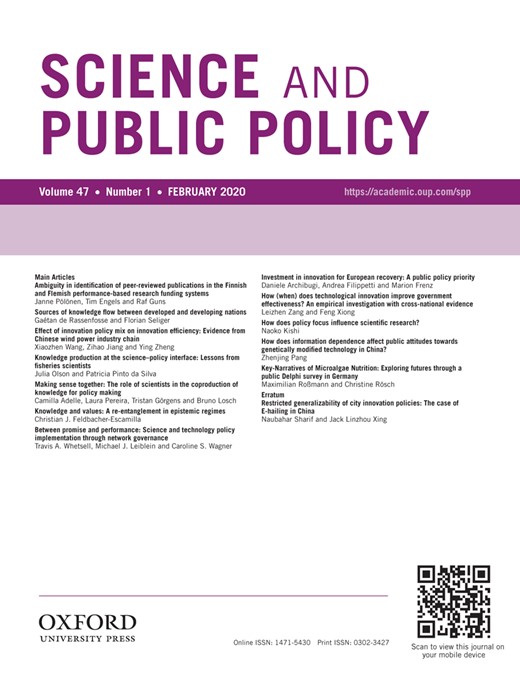
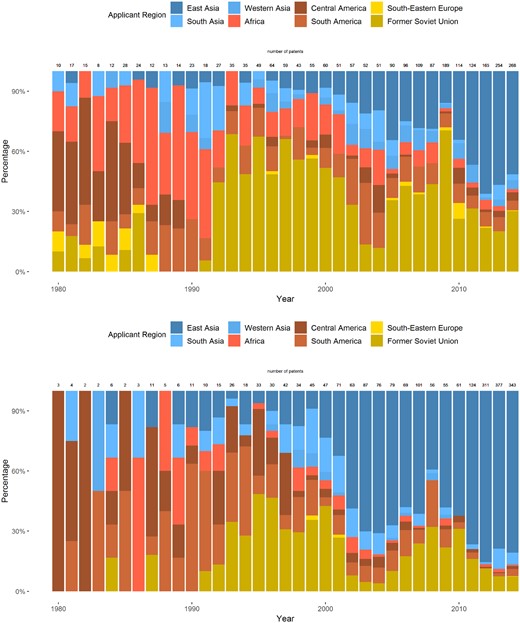
Figure 1 provides an overview of the proportion of patents coapplied by region (Panel A) and technology field (Panel B) between core European applicants and applicants from developing countries. The number of coapplied patents grew from 16 in 1980 to 1,501 in 2010, leading to a compound annual growth rate (CAGR) of 16.3 per cent. To put that figure in perspective, collaboration between core European applicants and the US applicants increased from about 500 patents in 1980 to >5,000 in 2010 and experienced a CAGR of 8 per cent. Thus, from a European perspective, collaboration with developing countries amounts to about one-third of the extent of collaboration with the USA. However, the growth rate has been more than twice as high.
R&D collaboration (applicant criterion) by region and technology. (A) Patents coapplied between core Europe and developing countries, by region (in percentage) and (B) patents coapplied between core Europe and developing countries, by technology field (in percentage). The figures above each bar indicate the total number of patents that were coapplied with developing countries.
Regarding the regional breakdown, most of the growth in collaboration is driven by firms located in East Asia, notably China. Collaboration with Russia and other former Soviet Union countries is low and oscillates around 100 patents since the 2000s. Finally, collaboration with Africa, Central, and South America has increased slightly in total numbers, although it remains at low levels. In relative terms, patents arising from collaboration with non-Asian countries are shrinking fast—it represents a mere 17 per cent in recent years. Asia has now become a dominant collaborating partner among all developing regions. The strategy of China for establishing technological joint ventures and R&D partnerships in selected technologies (including in telecommunications) to benefit from knowledge diffusion and the upgrading of skills is certainly not unrelated to this development (Lema and Lema 2012; Mu and Lee 2005).
A strikingly similar pattern is obtained when looking at patents coapplied between the US and Canadian applicants and applicants from developing countries (not shown), at least for recent years. Here the CAGR is higher than that for Europe, reaching 24 per cent, and the breakdown during the 2010–2014 period is as follows: East Asia (57 per cent); South Asia (33 per cent); Western Asia (<1 per cent); Africa (1 per cent); Central America (1.3 per cent); South America (2.2 per cent); South-East Europe (<1 per cent); and former Soviet Union (5.3 per cent). However, contrary to Europe, the United States & Canada had their main focus on Asian partners already since the 1990s. In addition, although the number of priority filings is smaller for the USA and Canada compared to Europe (67,412 vs. 113,952 in 2010), these countries have a much larger number of coapplications with developing countries (3,829 vs. 1,501). Thus, from a US/Canadian perspective, collaboration with developing countries is almost as important as collaboration with Europe.
Figure 1B breaks down collaboration between core European applicants and applicants from developing countries by technology field. The color scheme allocates technological fields into five technology sectors (see Schmoch 2008): ICT and electrical engineering (blue); instruments (yellow); chemistry and pharmaceuticals (red); mechanical engineering (green); and other fields (orange). Collaboration in ICT accounts for the majority of collaborations with developing countries in recent years (65.6 per cent in 2010). Historically, collaboration occurred mainly in pharmaceuticals and chemistry (58.1 per cent in 1990), but this sector has been marginalized, in relative terms, with the rise of communication and computer technologies. Similar findings emerge for the USA and Canada (not reported). However, the rise in the proportion of ICT patents started earlier (in 2000, USA and Canada: 29 per cent and Europe: 10.7 per cent).
The drastic increase in the share of ICT patents in priority filings could be observed for coapplied or coinvented patents (patents are developed either by a developed region together with developing countries or by two developed regions together). When looking at priority patents filed by East Asian applicants (irrespective of whether they are coapplied or not), only about 14.4 per cent of them could be attributed to ICT in 2010. The majority of patents are found in chemistry and pharmaceuticals. For the USA and Canada as applicant region, the ICT share was higher (25.8 per cent) but still dominated by chemistry and pharmaceuticals (36.2 per cent in 2010). Overall, the concentration in ICT is a special feature of collaborations, which might reflect the cumulative innovation process in this field (Bessen and Maskin 2009), with North American and European companies to target developing countries with a clear focus in this technology.
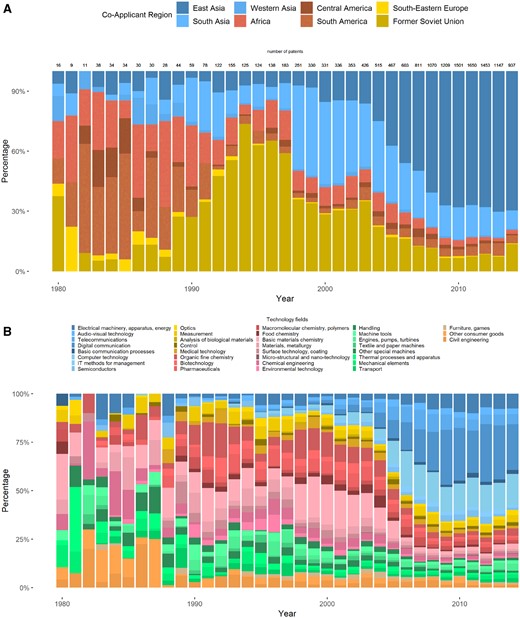
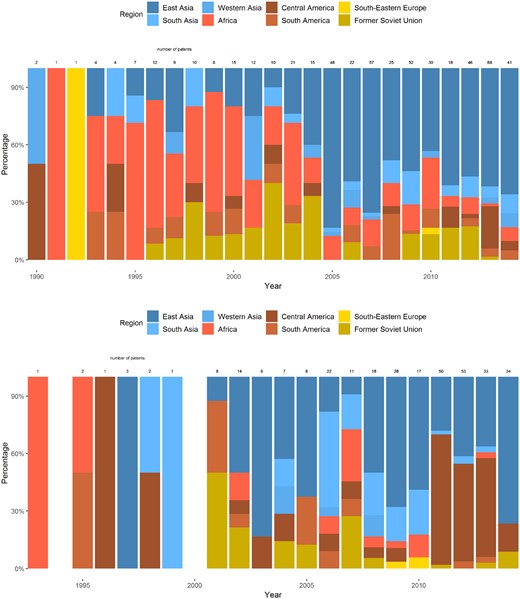
Figure 2 provides an overview of the region-wise proportion of patents coinvented between inventors from developed countries and those from developing countries. Panel A focuses on core European inventors and Panel B focuses on US and Canadian inventors. Cross-border inventor collaboration looks very similar to cross-border firm collaboration over time. A similar pattern between cross-border firm collaboration and cross-border inventor collaboration should not come as a surprise. Indeed, a patent coapplied by firms in two countries very often involves inventors from these two countries.
R&D collaboration (inventor criterion) by region. (A) Patents coinvented between core Europe and developing countries, by region (in percentage) and (B) Patents coinvented between the USA and Canada and developing countries, by region (in percentage). The figures above each bar indicate the total number of patents that were coinvented with developing countries.
Comparing Panel A with Panel B in Figure 2, it seems that European inventors as a whole have a collaboration network that is more geographically dispersed than the USA and Canadian inventors’ network—the latter focuses to a greater extent on Asia. However, similar to coapplications, the share of patents coinvented with Asia among the total number of coinvented patents has also increased strongly in Europe. Looking at technology fields (not reported) suggests a pattern that is very similar to Fig. 1B. The greater reliance of the USA and Canada on Asia translates into a greater share of patents coinvented in ICT.
3.2 Technology sourcing
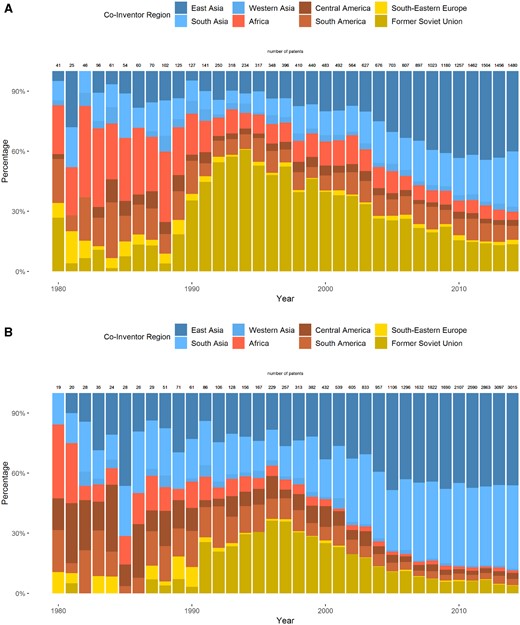
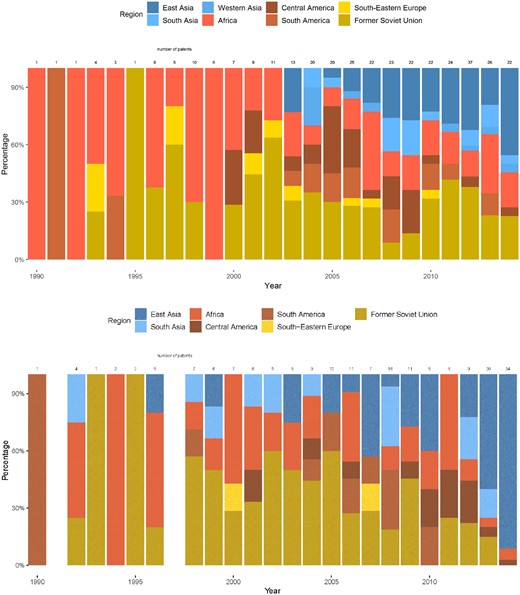
This section looks at the patents sourced internationally. Figure 3 shows patent filings from applicants in core Europe (Panel A) and the USA and Canada (Panel B) that are developed by inventors located in developing countries. The overall pattern is again very similar to the findings in Figs 1 and 2. However, South Asia seems to be a bit more important for technology sourcing activities of northern American applicants compared to East Asia, at least in recent years (in 2014, the share of ‘sourced’ patents was 57 per cent for South Asia compared to 30 per cent for East Asia). Appendix Fig. A.1A provides a complementary view. It shows a Sankey diagram of technology sourcing between developed regions and developing regions for the year 2014.10 We can see that the USA and Canada account for the majority of technology sourcing from developing countries.
Technology sourcing from developing countries. (A) Patents applied by core Europe and invented in developing countries, by region (in percentage) and (B) Patents applied by the USA and Canada and invented in developing countries, by region (in percentage). The figures above each bar indicate the total number of patents that were ‘sourced’ from developing countries.
The numbers of patents sourced by the USA and Canada dropped significantly during the 2008 global financial crisis.11 Comparison of the numbers of patents in Fig. 3B with those in Fig. 2B reveals that technology sourcing was more sensitive to the crisis than R&D collaboration. Firms in the USA and Canada had dramatically reduced their technology sourcing activities during the crisis. One possible explanation is that collaboration projects establish medium- to long-term relationships that are more resilient to changing financial conditions. The number of patents filed by the US and Canadian applicants with inventors in developing countries again increased strongly after the crisis.
As already discussed in the ‘Method and data’ section, the measures exclude coapplied patent filings to capture technology sourcing more accurately. Nevertheless, it is instructive to compare ‘pure’ technology sourcing (excluding coapplications) with technology sourcing, including coapplications (which is suggestive of R&D collaboration). The former has become less common for East Asia relative to the latter. This suggests that firms from developed economies increasingly rely on R&D collaboration in East Asia to tap into local knowledge. In China, for example, finding local collaboration partners helps mitigate political and bureaucratic risks (Gassmann and Han 2004). It is also sometimes a prerequisite imposed by the government to gain access to the Chinese market. In contrast, R&D offshoring to South Asia might still offer a large potential for saving costs.
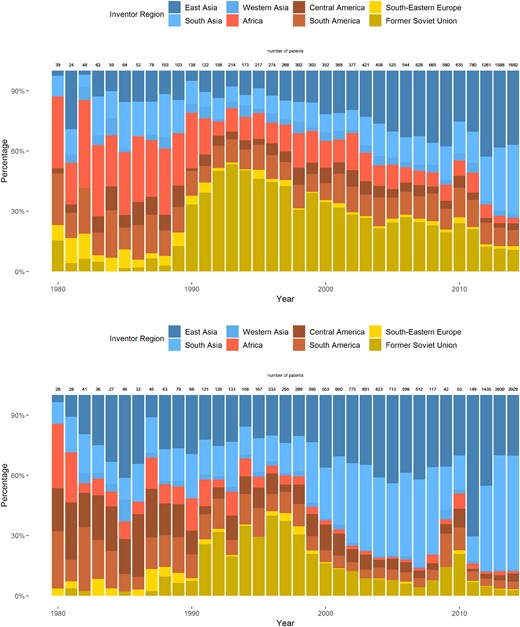
Figure 4 shows technology sourcing by developing countries from developed countries. It presents the number of patents applied by developing countries and invented in developed countries (again excluding coapplied patents). The figures show a dominance of East Asian countries. Regarding the USA and Canada as host countries, the dominance is particularly visible. East Asia is the most active region in terms of sourcing technologies from developed countries, and it mainly does so in the USA. Interestingly, South Asian applicants are not very active when it comes to technology sourcing. Regarding technology sourcing from Europe, former Soviet Union countries still play a significant role. South America, which had a couple of patents with US and Canadian inventors in the past, has been marginalized in relative terms. Appendix Fig. A.1B shows a Sankey diagram of technology sourcing of developing regions from developed regions for the year 2014. It further illustrates the dominance of the link between East Asia and the USA and Canada in terms of technology sourcing.
Technology sourcing from developed countries. (A) Patents invented in core Europe and applied by developing countries, by region (in percentage) and (B) patents invented in the USA and Canada and applied by developing countries, by region (in percentage). The figures above each bar indicate the total number of patents that were ‘sourced’ from developed countries.
Figure 4 illustrates that East Asian companies increasingly source technologies in countries that are at the research frontier. The reverse might not be true, at least in the past: Western companies might source technologies from developing countries for different reasons, for example to reduce R&D costs. However, the fact that developed economies source technologies mainly from East and South Asia, especially ICT and electrical engineering, suggests that Asian regions have developed a comparative advantage in terms of the availability of skills and technological sophistication over other developing regions. Asian regions have certainly learned some of the knowledge brought in by Western firms (Li et al. 2012). The fact that only East Asia, especially China, sources technologies at a larger scale reflects the sheer size of the country. It may also be a consequence of Chinese strategy of building up own R&D capabilities by drawing on knowledge from abroad (see also Hou and Mohnen 2013; Nepelski and De Prato 2015).
3.3 Technology transfer
In this section, we focus on the transfer of ownership, that is the sales of rights of EPs. Figure 5A shows the transfers of EPs from original owners located in core Europe to new owners located in developing countries. Figure 5B follows the same logic. It displays the transfers of EPs from original owners located in the USA and Canada to developing countries.
Technology transfers to developing countries. (A) Patents transferred from core Europe to developing countries, by region (in percentage) and (B) patents transferred from the USA and Canada to developing countries, by region (in percentage). The figures above each bar indicate the total number of patents that were transferred to developing countries. Empty bars indicate that the number is zero in the respective year.
In terms of overall volumes, patents transferred from Europe to developing countries have increased over the last decade. However, the overall activity is rather marginal. In 2013, the largest number of patents was transferred from core European to developing countries, that is, sixty-eight patents changed ownership to developing countries. Transfers from the USA and Canada represent a similar volume to the transfers from core Europe.
In terms of recipient regions, Fig. 5B shows that African countries were the most important destinations for patent transfers originating from core Europe in the late 1990s, attracting around 40 per cent of the transfers.12 The pattern changed in the early 2000s, with the drastic increase in the proportion of East Asian countries as recipients of patents transferred to developing countries. In 2014, 83 per cent of these transfers were made to a new owner located in an East Asian country.
Figure 5B shows the yearly shares of developing regions as recipients of patent transfers originating from the USA and Canada. As with transfers originating from core Europe countries, the share of East Asian countries as recipients of transfers originating from the USA and Canada has increased over the last two decades. Central American countries also have been an important destination in the recent years for patent transfers originating from the USA and Canada.
Figure 6 focuses on developing countries as source of patent transfers. Panel A presents the share of developing regions as countries of origin for patent transfers to core European countries. Africa was a dominant region of origin before 2000, although this result has to be interpreted with caution, as the absolute numbers were very low. In more recent years, the share of transfers is balanced, and there is no absolute dominance of a particular region. East Asia, Central America, Africa, and the former Soviet Union are the most important regions of origin. Taking the average absolute volumes in the entire period, the number of patents transferred from developing countries to core Europe is twice as small as the number of patents transferred from core Europe to developing countries.
Technology transfers from developing countries. (A) Patents transferred from developing countries to core Europe, by Region (in percentage) and (B) patents transferred from developing countries to the USA and Canada, by Region (in percentage). The figures above each bar indicate the total number of patents that were transferred to developed countries. Empty bars indicate that the number is zero in the respective year.
Figure 6B displays the share of developing regions as countries of origin for patent transfers to the USA and Canada. Asian countries account for the bulk of activity, although former Soviet Union countries are also well represented. In terms of absolute volumes, transfers from developing countries to the USA and Canada are more than three times less important than transfers to developing countries from the US and Canadian owners in most recent years.
4. Concluding remarks
This article studied the sources of cross-border knowledge flows through the lens of patent data. The various patent counts presented could be interpreted as proxies for R&D collaboration (coapplications and coinventions), technology sourcing (applicant and inventor from different countries), and technology transfer (patent transferred across countries).
A few caveats must be borne in mind when interpreting these results. First, the analysis is subject to the well-known limitations of patent data (Griliches 1998). Not all inventions are patented, not all patented inventions are useful, and patents widely vary in quality. Second, effective knowledge transfer involves more than codeveloping or transferring patents (e.g. Liu 2019). Third, the majority of transfers occur within developed economies, and some of the trends we have documented may be the consequence of the rising GDP of developing economies and policies such as patent subsidies, which have increased awareness about patents. Finally, lack of data on the ownership structure of firms prevents us from providing a more fine-grained analysis (for instance, by differentiating technology sourcing into R&D offshoring or R&D contracting).
Notwithstanding these limitations, a consistent message emerges across the three indicators. The main findings are that R&D activities and patent transfers have concentrated in recent years. First, at the regional level, East Asia, and to a smaller extent South Asia, has risen as a developing region attracting almost all of the patenting activities from developed regions. Regarding patent transfers, East Asia has become the largest recipient of patents in the last decade among developing countries, with transfers coming from both the USA and Europe. Second, at technological level, ICT has become the dominant sector in which collaborations and technology sourcing are taking place.
In addition, although the developments are quite similar in Europe and the USA and Canada, we see some striking differences. First, the USA and Canada traditionally have larger joint patenting activities with Asia, whereas it is a relatively new phenomenon for Europe. Second, the USA and Canada have been focusing on ICT for a longer period than Europe. Finally, Central American countries remain an important destination for patent transfers originating from the US and Canadian owners (although numbers are admittedly small).
Two additional findings are worth discussing. First, technology sourcing seems to be more sensitive to economic conditions than R&D collaboration. Firms in the USA and Canada dramatically reduced their technology sourcing activities during the global financial crisis but R&D collaboration remained stable. Collaboration projects establish medium- to long-term relationships that are presumably more resilient to changing financial conditions.
Second, we observe more and more ‘reverse’ knowledge flows, whereby firms in developed regions source technologies from developing economies. Here again China is leading the change. We expect that Asian countries that attract foreign patent activities benefit from knowledge flows from more developed countries, thereby raising their own technological base. China has already reached a stage at which it sources technologies largely from developed countries. Given that East Asia will continue to progress toward becoming a technological leader, the US and Canadian firms seem to be in a better position than European firms to benefit from the rising sophistication of East Asia. They have a larger and better-established network of patent applicants and inventors in this region and thus better placed to enjoy potential ‘reverse’ knowledge flows.
The analysis presented in this article offers two policy messages. First, the center of gravity in ICT is shifting to East. Firms from developed countries are increasingly sourcing knowledge from Asia in proportions that exceed the growth in patent numbers. This is the most recurring pattern across all indicators. Given the digital transformation that industries are experiencing, obtaining a competitive edge on enabling tools (e.g. quantum computing, artificial intelligence) may produce high payoff. Policy makers should watch the situation closely.
Second, Africa and Latin America are seemingly missing learning opportunities because of lack of integration with the rest of the world. However, it remains to be seen whether this low integration is due to lack of opportunities or failure to identify such opportunities. At the very least, the type of data used in this article can help government in these regions to figure out where they stand and in which technologies they are best placed to invest resources.13 The data could also help them to identify successful cases of knowledge flow and learn from them, for example, by identifying the set of best practices that have led to international technology sourcing.
5. Acknowledgements
The authors are grateful to Laurie Ciaramella for having provided the data in Figures 5 and 6 as well as for her input on how to interpret them. We also thank one anonymous referee for his valuable feedback. The work was supported by a grant by the Swiss National Science Foundation, "Globalization of R&D: Technology Cluster, Performance and Risk" (SNSF Grant No 100018_169584).
Footnotes
Other sources of knowledge transfer exist, such as the mobility of R&D personnel (e.g., Lenzi 2010). Our analysis is silent on this and other sources.
According to de Rassenfosse et al. (2013), these 52 offices accounted for 98.5 per cent of worldwide priority patent filings in 2005. They comprise offices in the following: all Organization for Economic Cooperation and Development (OECD) countries, all European Patent Convention (EPC) member states (excluding San Marino, Liechtenstein, and Monaco), Brazil, Russia, India, China, and South Africa; the European Patent Office; and the World Intellectual Property Office.
We cannot fully exclude the possibility that co-applications and co-inventions can also comprise R&D contracts where only one party contributed significantly to the invention (see Bergek and Bruzelius 2010).
PATSTAT is maintained by the EPO and contains bibliographical and legal status data for more than 100 patent offices worldwide (de Rassenfosse et al. 2014).
A family of patents is a set of patents that are related to each other through common priority patent applications. The original data in de Rassenfosse et al. (2013) have been recently updated and improved, thanks to the EPFL-ETH Zurich project funded by the Swiss National Science Foundation.
It should be noted that it is still possible to register transaction at the EPO during the nine-month period following the grant of patent.
The cost of registering a transfer of ownership at the EPO is EUR100. There is no cost for registering a transfer of patent ownership at the DPMA since 2002.
For the sake of completeness, we also show numbers for two other developed regions: ‘Japan and South Korea’ and ‘Australia and New Zealand’. We do not show patent transfers in these figures because the database is different from the database on priority filings and a direct comparison is not possible. Even though the focus is on developing countries, we show the numbers for all possible pairs, including between developed regions, for benchmarking.
The Chinese patent explosion is partly driven by increased R&D intensity. Eberhardt et al. (2016), Dang and Motohashi (2015), and Li (2012), show that government subsidies directly play a role in encouraging patent applications.
Sankey diagrams are a specific type of flow diagrams in which the width of arrows is shown proportionally to the flow quantity.
Not only the number of patents with the US applicants and inventors abroad decreased in 2008–2009 but also the number of total patent filings.
The absolute volumes are nevertheless very low.
Lee (2013) tries to explain the reasons for the diverging technological developments between East Asia and Latin America by different amounts of R&D expenses and the availability and integration of skilled engineers and workforce.
References
European Patent Office (EPO) (
International Monetary Fund (
United Nations (
Appendix
A1. Allocation of developed and developing countries to regions
The allocation of developed and developing countries to regions is based on the country classification in the World Economic Situation and Prospects report (United Nations 2018) and per capita nominal GDP figures from the World Economic Outlook Database (International Monetary Fund 2018). The former classifies all countries of the world into developed economies, economies of transition, and developing economies mainly reflecting the basic economic conditions of the whole region. Geographical regions for developing economies are North Africa, Central Africa, East Africa, Southern Africa, West Africa, East Asia, South Asia, Western Asia, the Caribbean, Mexico and Central America, and South America. Economies of transition comprise countries in South-Eastern Europe and from the former Soviet Union (including Russia). For simplicity, we treated transition countries as developing economies.
The country classification is in some respects problematic as some regions of developing countries also comprise high-income countries (e.g. Israel in Western Asia and South Korea and Singapore in East Asia). Therefore, we adapted the country classification and excluded countries from developing regions if they have a per capita nominal GDP that lies above the world average in 2017. In our analysis, we grouped all African regions into ‘Africa’ as the copatenting shares are very small for smaller regions. We also build one group for ‘Central America’, including the Caribbean and Mexico and other countries in Central America.
For the developed economies, we use two groups of countries: ‘Core Europe’ and ‘USA and Canada’. Core Europe comprises all European Union member states (twenty-eight) as well as Iceland, Norway, and Switzerland. Other developed countries (Australia, New Zealand, and Japan) are not considered in the article.
The patent filings are assigned to countries (and to regions) based on the applicants’ and inventors’ country codes in PATSTAT (EPO 2016). As the country codes are missing for many priority filings, we impute them using the method described in Appendix Section A2.
Table A.1 shows the groups of countries we used to allocate patent filings to different world regions.
Groups of countries used in the article.
| Developed countries | Developing countries | |||
|---|---|---|---|---|
| Core Europe | South-Eastern Europe | Egypt | East Asia | Cuba |
| Austria | Albania | Eritrea | China | Dominican Republic |
| Belgium | Bosnia and Herzegovina | Ethiopia | Fiji | El Salvador |
| Bulgaria | Montenegro | Gabon | Indonesia | Guatemala |
| Croatia | Serbia | Gambia | Kiribati | Guyana |
| Cyprus | Macedonia | Ghana | Lao People’s Democratic Republic | Haiti |
| Czech Republic | Former Soviet Union | Guinea | Malaysia | Honduras |
| Denmark | Armenia | Guinea-Bissau | Mongolia | Jamaica |
| Estonia | Azerbaijan | Kenya | Myanmar | Mexico |
| Finland | Belarus | Lesotho | Papua New Guinea | Nicaragua |
| France | Georgia | Liberia | Philippines | Suriname |
| Germany | Kazakhstan | Libya | Samoa | South America |
| Greece | Kyrgyzstan | Madagascar | Solomon Islands | Bolivia |
| Hungary | Republic of Moldova | Malawi | Thailand | Brazil |
| Iceland | Russian Federation | Mali | Timor-Leste | Colombia |
| Ireland | Tajikistan | Mauritania | Vanuatu | Ecuador |
| Italy | Turkmenistan | Mauritius | Vietnam | Paraguay |
| Latvia | Ukraine | Morocco | South Asia | Peru |
| Lithuania | Uzbekistan | Mozambique | Afghanistan | Venezuela |
| Luxembourg | Africa | Namibia | Bangladesh | |
| Malta | Algeria | Niger | Bhutan | |
| Netherlands | Angola | Nigeria | India | |
| Norway | Benin | Rwanda | Iran | |
| Poland | Botswana | Sao Tome and Principe | Nepal | |
| Portugal | Burkina Faso | Senegal | Pakistan | |
| Romania | Burundi | Sierra Leone | Sri Lanka | |
| Slovakia | Cabo Verde | Somalia | Western Asia | |
| Slovenia | Cameroon | South Africa | Iraq | |
| Spain | Central African Republic | Sudan | Jordan | |
| Sweden | Chad | Swaziland | Syrian Arab Republic | |
| Switzerland | Comoros | Togo | Turkey | |
| UK | Congo | Tunisia | Yemen | |
| USA and Canada | Côte d’Ivoire | Uganda | Central America | |
| USA | Democratic Republic of the Congo | United Republic of Tanzania | Belize | |
| Canada | Djibouti | Zambia | ||
| Zimbabwe | ||||
A2. Information on inventors’ and applicants’ countries of residence in priority filings
Patent statistics are based on the so-called priority filings. Priority filings are the first filings within a patent family that might comprise multiple filings in different jurisdictions. We impute missing inventor (applicant) country codes using the method described in de Rassenfosse et al. (2013). Basically, their algorithm looks for equivalents and subsequent filings in the same family (preferring filings that are closer in time to the first filing) and uses the country codes from these filings if the priority filings’ inventor (applicant) country code is missing. Subsequent filings are typically made at other patent offices. The algorithm browses fifty-two patent offices to impute missing information. To be more precise, it first selects all priority filings of a given patent office in a given year, so the first information source is the priority filing itself. For each filing that has missing information on the inventor’s (applicant’s) country of residence, it looks into six additional sources of information. The sources are browsed subsequently to retrieve missing information. The algorithm stops looking into those sources once it has found the country information in one of them. Source 1 is the priority document itself, whereas Sources 2 and 3 exploit family linkages. Sources 4–6 look into country information of applicants, thereby assuming that the applicant’s country is most likely to be identical with the inventor’s country. Source 7 uses the country of priority office for the country of residence of inventor (applicant) if all other sources do not provide information. The following list provides more detailed information on the sources. If the interest lies in the applicant’s country of residence rather than the inventor’s country of residence, the sources are browsed in the same way starting with the applicant’s country of residence in the priority document (as indicated in parentheses for each source).
Source 1: Uses the inventor’s (applicant’s) country of residence from the priority document itself.
Source 2: If no information on the inventor’s (applicant’s) country of residence is available from the priority document, the earliest direct equivalent is browsed. A direct equivalent is a second filing claiming the priority application in Source 1 as sole priority.
Source 3: If no information on the inventor’s (applicant’s) country of residence is available in direct equivalents, the other second filings of the same family are browsed. The second filings considered in this source claim more than the priority document.
Source 4: If no information on the inventor’s (applicant’s) country of residence is available in other subsequent filings, the applicant’s (inventor’s) country of residence from the priority document is used.
Source 5: If no information on the applicant’s (inventor’s) country of residence is available from priority document, the earliest direct equivalent is browsed for this information.
Source 6: If no information on the applicant’s (inventor’s) country of residence is available in direct equivalents, the other second filings of the same family are browsed.
Source 7: If the information is still missing, the country of the priority office is used for the inventor’s (applicant’s) country of residence.
In our context, we are interested in priority filings, including more than one applicant (inventor) country or one applicant and one inventor being located in different countries. Of course, priority filings can have mixed applicant (inventor) teams with applicants (inventors) coming from more than one region of developing countries. These filings are then counted separately for each region. These cases are rare, but we checked the results using fractional counting (by assigning a weight to each developing country taking into account the relative size of the inventor team for each country). The results are very similar to the results reported in the main part of the article.
A3. Allocation of technology fields to patent filings
The International Patent Classification (IPC) that is used to categorize patents according to their technological content provides a good starting point for analysis by technologies. However, the IPC is highly technical with hundreds of subclasses and groups. Therefore, we use more aggregated technology fields that have been assigned to IPC codes of patent filings based on the ‘Concept of a Technology Classification for Country Comparisons’ (Schmoch 2008).
As patent filings usually have several IPC codes that correspond to several technologies, we use weights from PATSTAT. It considers the degree to which a patent belongs to a certain technology field based on its IPC codes. To give an example, patent filing WO2018126352A1 is assigned to IPC Codes C09K9/00, G01K11/16, and H01B13/00. The technology classification uses only the first four digits. Here, C09K corresponds to ‘Basic materials chemistry’, G01K to ‘Measurement’, and H01B to ‘Electrical machinery, apparatus, energy’. This means that the respective filing counts one-third for ‘Basic materials chemistry’, one-third for ‘Measurement’, and one-third for ‘Electrical machinery, apparatus, energy’. The filings’ weights that are calculated in this way can be found in PATSTAT. In our analysis, we sum up these by technology field (and by year and region).
A4. Number of priority filings by applicant region and by different sources of knowledge flows
Number of priority filings by applicant region and partner region.
| Number of priority filings | ||||||||
|---|---|---|---|---|---|---|---|---|
| Partner region | ||||||||
| Year | Applicant | Total number | Knowledge sources | Core Europe | USA and Canada | Australia and New Zealand | Japan and South Korea | Developing countries |
| 1990 | Core Europe | 84,288 | R&D collaboration applicants | 867 | 9 | 66 | 59 | |
| R&D collaboration inventors | 843 | 42 | 213 | 128 | ||||
| Technology sourcing | 516 | 38 | 105 | 141 | ||||
| USA and Canada | 46,644 | R&D collaboration applicants | 867 | 5 | 150 | 20 | ||
| R&D collaboration inventors | 843 | 25 | 256 | 60 | ||||
| Technology sourcing | 1,143 | 39 | 260 | 69 | ||||
| Australia and New Zealand | 675 | R&D collaboration applicants | 9 | 5 | 1 | 0 | ||
| R&D collaboration inventors | 42 | 25 | 4 | 1 | ||||
| Technology sourcing | 7 | 12 | 0 | 2 | ||||
| Japan and South Korea | 316,828 | R&D collaboration applicants | 66 | 150 | 1 | 8 | ||
| R&D collaboration inventors | 213 | 256 | 4 | 14 | ||||
| Technology sourcing | 148 | 211 | 0 | 14 | ||||
| Developing countries | 9,327 | R&D collaboration applicants | 59 | 20 | 0 | 8 | ||
| R&D collaboration inventors | 126 | 60 | 1 | 14 | ||||
| Technology sourcing | 23 | 11 | 0 | 2 | ||||
| 2000 | Core Europe | 108,770 | R&D collaboration applicants | 1,541 | 87 | 316 | 324 | |
| R&D collaboration inventors | 2,692 | 135 | 409 | 477 | ||||
| Technology sourcing | 2,175 | 95 | 187 | 368 | ||||
| USA and Canada | 72,499 | R&D collaboration applicants | 1,541 | 30 | 1,506 | 238 | ||
| R&D collaboration inventors | 2,692 | 85 | 706 | 421 | ||||
| Technology sourcing | 3,616 | 113 | 1,295 | 560 | ||||
| Australia and New Zealand | 1,529 | R&D collaboration applicants | 87 | 30 | 7 | 7 | ||
| R&D collaboration inventors | 135 | 85 | 15 | 12 | ||||
| Technology sourcing | 22 | 8 | 2 | 5 | ||||
| Japan and South Korea | 409,675 | R&D collaboration applicants | 316 | 1,506 | 7 | 46 | ||
| R&D collaboration inventors | 409 | 706 | 15 | 200 | ||||
| Technology sourcing | 260 | 682 | 9 | 176 | ||||
| Developing countries | 44,613 | R&D collaboration applicants | 324 | 238 | 7 | 49 | ||
| R&D collaboration inventors | 477 | 421 | 12 | 200 | ||||
| Technology sourcing | 60 | 47 | 3 | 16 | ||||
| 2010 | Core Europe | 113,952 | R&D collaboration applicants | 5,179 | 127 | 835 | 1,479 | |
| R&D collaboration inventors | 2,640 | 130 | 488 | 1,221 | ||||
| Technology sourcing | 521 | 71 | 136 | 631 | ||||
| USA and Canada | 67,412 | R&D collaboration applicants | 5,179 | 197 | 1,980 | 3,797 | ||
| R&D collaboration inventors | 2,640 | 116 | 1,023 | 2,088 | ||||
| Technology sourcing | 1,575 | 9 | 76 | 68 | ||||
| Australia and New Zealand | 2,054 | R&D collaboration applicants | 127 | 197 | 32 | 62 | ||
| R&D collaboration inventors | 130 | 116 | 39 | 54 | ||||
| Technology sourcing | 4 | 4 | 2 | 5 | ||||
| Japan and South Korea | 342,990 | R&D collaboration applicants | 835 | 1,980 | 32 | 451 | ||
| R&D collaboration inventors | 488 | 1,023 | 39 | 1,165 | ||||
| Technology sourcing | 417 | 536 | 31 | 983 | ||||
| Developing countries | 297,377 | R&D collaboration applicants | 1,479 | 3,797 | 62 | 451 | ||
| R&D collaboration inventors | 1,221 | 2,088 | 54 | 1,165 | ||||
| Technology sourcing | 114 | 61 | 2 | 18 | ||||
Remarks on Table A.2
Table A.2 shows the number of priority filings filed by applicants in different regions of world (‘core Europe’, ‘USA and Canada’, ‘Australia and New Zealand’, ‘Japan and South Korea’, ‘Developing countries’) (Column: ‘Total number’). It also shows the number of priority filings coapplied with, coinvented with, or sourced from other world regions. To give an example, the US and Canadian inventors coinvented 256 patents with Japan or South Korea in 1990 and 60 with developing countries. Please note that numbers can slightly deviate from the numbers mentioned in the main text and displayed on the top of the bars in the figures. For example, in Fig. 1, we display 1,501 as the number of priority filings based on coapplications between ‘core Europe’ and developing countries in 2010. However, in Table A.2, the respective number is 1,479. The difference is due to the fact that we added up the numbers from all developing regions in the figures. In contrast, in Table A.2, we present unique counts, that is, if a patent has applicants in different developing regions, it is counted once only. However, differences are very small as coapplications or coinventions with multiple developing regions are not common.
A5. Sankey diagrams
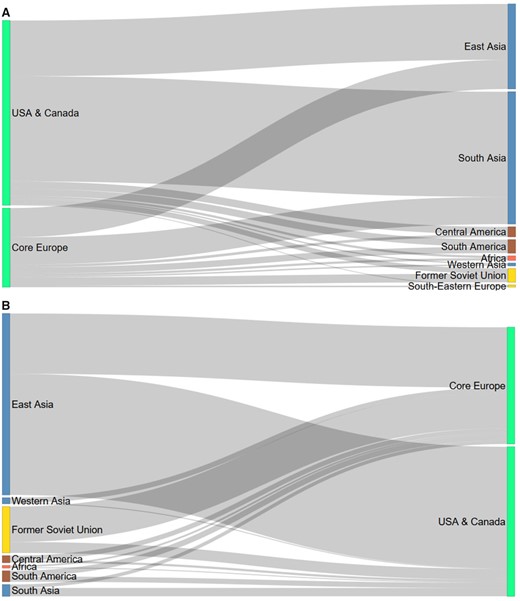
Links between the USA and Canada/core Europe and developing countries. (A) Patents applied by the USA and Canada/core Europe and invented in developing countries by region, priority year 2014. (B) Patents applied by developing countries and invented in the USA and Canada/core Europe by region, priority year 2014.
