


1-20 of 12554

Image
Comparison of B. pubescens evolutionary models—Barplots show the f...
in
Systematic Biology
>
Complex Polyploids: Origins, Genomic Composition, and Role of Introgressed Alleles
Published: 13 April 2024
Figure 4.
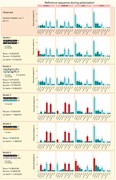
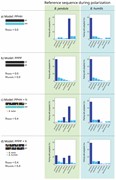
Comparison of B. pubescens evolutionary models—Barplots show the frequency with which the polarized B. pubescens sequence pairs with other birch species, for different evolutionary models and polarization settings, based on phylogenetic analysis of individual gene families using IQ-TREE2. P ,
Image
Phylogenetic topology and MLE of model parameters obtained using fastsimcoa...
in
Systematic Biology
>
Complex Polyploids: Origins, Genomic Composition, and Role of Introgressed Alleles
Published: 13 April 2024
Figure 6.
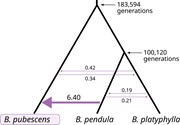
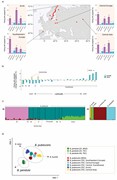
Phylogenetic topology and MLE of model parameters obtained using fastsimcoal2. Mean divergence times (in generations) and number of introgression events (per generation) estimated for migration model with the highest Akaike weight. Only B. pubescens loci containing 4 gene copies of B. pendula an
Image
Abundance profiles for B. pubescens allelic variants of B. nan...
in
Systematic Biology
>
Complex Polyploids: Origins, Genomic Composition, and Role of Introgressed Alleles
Published: 13 April 2024
Figure 7.
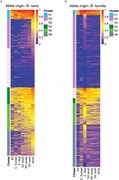
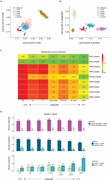
Abundance profiles for B. pubescens allelic variants of B. nana and B. humilis origin—Heatmaps show fraction of B. pubescens individuals in different populations (columns) containing an allele of (a) B. nana or (b) B. humilis origin, for different genes (rows). K-means cluster analysis w
Image
Functional analysis of B. pubescens allelic variants of B. nan...
in
Systematic Biology
>
Complex Polyploids: Origins, Genomic Composition, and Role of Introgressed Alleles
Published: 13 April 2024
Figure 8.
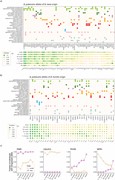
Functional analysis of B. pubescens allelic variants of B. nana and B. humilis origin—Gene ontology (GO) annotation of genes associated with retained allelic variants of (a) B. nana and (b) B. humilis origin. Symbol colors represent broad GO categories (e.g., biotic defense responses are s
Journal Article
Complex Polyploids: Origins, Genomic Composition, and Role of Introgressed Alleles
Systematic Biology, syae012, https://doi.org/10.1093/sysbio/syae012
Published: 13 April 2024
Image
Schematic representation of polyploid pairing patterns for different polypl...
in
Systematic Biology
>
Complex Polyploids: Origins, Genomic Composition, and Role of Introgressed Alleles
Published: 13 April 2024
Figure 1.
Schematic representation of polyploid pairing patterns for different polyploidization and hybridization models—Barplots show the frequency with which B. pubescens is expected to pair with other birch species, across multiple loci, for different evolutionary models and polarization settings. PP and
Image
B. pubescens evolutionary models’ predictive power—Frequency with ...
in
Systematic Biology
>
Complex Polyploids: Origins, Genomic Composition, and Role of Introgressed Alleles
Published: 13 April 2024
Figure 5.
B. pubescens evolutionary models’ predictive power—Frequency with which the polarized B. pubescens sequence pairs with (a) B. nana and B. humilis and (b) B. pendula and B. platyphylla , as predicted by different evolutionary models, based on phylogenetic analysis of individual gene familie
Image
Model testing—Schematic representation of the pipeline used to gen...
in
Systematic Biology
>
Complex Polyploids: Origins, Genomic Composition, and Role of Introgressed Alleles
Published: 13 April 2024
Figure 2.
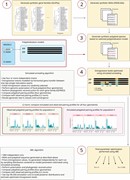
Model testing —Schematic representation of the pipeline used to generate the synthetic data and perform model optimization. Gene families created using SimPhy (step 1) were used to generate synthetic MSAs using INDELible (step 2). The polyploid was generated directly on the MSA by combining nucleoti
Image
Betula pubescens genomic composition and population structure—(a) ...
in
Systematic Biology
>
Complex Polyploids: Origins, Genomic Composition, and Role of Introgressed Alleles
Published: 13 April 2024
Figure 3.
Betula pubescens genomic composition and population structure—(a) Barplots show the frequency with which the polarized B. pubescens sequence pairs with other birch species during phylogenetic inference at 4 different locations across the B. pubescens species range, based on phylogenetic analysi
Journal Article
ACCEPTED MANUSCRIPT
Museum genomics reveals the hybrid origin of an extinct crater lake endemic
Systematic Biology, syae017, https://doi.org/10.1093/sysbio/syae017
Published: 10 April 2024
Journal Article
ACCEPTED MANUSCRIPT
Museum skins enable identification of introgression associated with cytonuclear discordance
Systematic Biology, syae016, https://doi.org/10.1093/sysbio/syae016
Published: 05 April 2024
Image
Example graphical models of individual direct or multiple direct and indire...
in
Systematic Biology
>
The Sequential Direct and Indirect Effects of Mountain Uplift, Climatic Niche, and Floral Trait Evolution on Diversification Dynamics in an Andean Plant Clade
Published: 30 March 2024
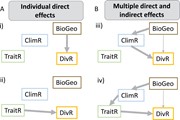
Figure 1.
Example graphical models of individual direct or multiple direct and indirect effects of abiotic and/or biotic factors on diversification dynamics. Arrows denote effects, with the width indicating the magnitude. a) Simplest path analytical models might support i) strong effects of biogeographic regi
Image
Phylo-niche spaces and niche disparity (rarefied to 4 spp/clade) of Meriani...
in
Systematic Biology
>
The Sequential Direct and Indirect Effects of Mountain Uplift, Climatic Niche, and Floral Trait Evolution on Diversification Dynamics in an Andean Plant Clade
Published: 30 March 2024
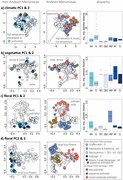
Figure 3.
Phylo-niche spaces and niche disparity (rarefied to 4 spp/clade) of Merianieae. a) Climatic niche space (PC axes 1 and 2 (44.7% and 27.7% variance explained)) shows distinct niches for non-Andean and Andean Merianieae, the first associating with higher temperatures, precipitation, and productivity,
Journal Article
The Sequential Direct and Indirect Effects of Mountain Uplift, Climatic Niche, and Floral Trait Evolution on Diversification Dynamics in an Andean Plant Clade
Systematic Biology, syae011, https://doi.org/10.1093/sysbio/syae011
Published: 30 March 2024
Image
Biogeographical history and diversification dynamics of Merianieae. a) Time...
in
Systematic Biology
>
The Sequential Direct and Indirect Effects of Mountain Uplift, Climatic Niche, and Floral Trait Evolution on Diversification Dynamics in an Andean Plant Clade
Published: 30 March 2024
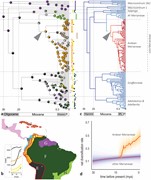
Figure 2.
Biogeographical history and diversification dynamics of Merianieae. a) Time-calibrated molecular phylogeny of Merianieae with present-day biogeographical distribution (tips) and reconstruction of historical biogeography (time-stratified DEC + J model), with colored pies showing historical areas; str
Image
Temporally staggered disparification of climatic, vegetative and floral nic...
in
Systematic Biology
>
The Sequential Direct and Indirect Effects of Mountain Uplift, Climatic Niche, and Floral Trait Evolution on Diversification Dynamics in an Andean Plant Clade
Published: 30 March 2024
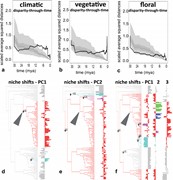
Figure 4.
Temporally staggered disparification of climatic, vegetative and floral niches of Merianieae (a-c) and major niche shifts in response to changes in selection regimes (d–f). a–c) Climatic disparity-through-time increases before (18 mya) vegetative (12 mya) and floral (6 mya) disparity-through-time, i
Image
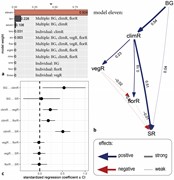
Fit of the 11 path-analytical models and best-fit model (eleven). a) Model ...
in
Systematic Biology
>
The Sequential Direct and Indirect Effects of Mountain Uplift, Climatic Niche, and Floral Trait Evolution on Diversification Dynamics in an Andean Plant Clade
Published: 30 March 2024
Figure 5.
Fit of the 11 path-analytical models and best-fit model (eleven). a) Model eleven, including multiple direct and indirect effects of abiotic and biotic factors resulted as best fit, and was more than two delta CIC better than the next-best-fitting models ten and seven. None of the models with indivi
Image
DateLife results of an analysis of a small sample of 6 bird species within ...
in
Systematic Biology
>
DateLife: Leveraging Databases and Analytical Tools to Reveal the Dated Tree of Life
Published: 20 March 2024
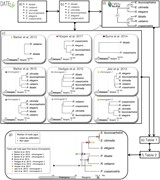
Figure 2
DateLife results of an analysis of a small sample of 6 bird species within the Passeriformes. Input species names (a) were processed (b) and were found across 9 chronograms within 6 independent studies (c; Barker et al. (2012), Barker et al. (2015) , Burns et al. (2014 ), Hedges et al. (2015 ),
Journal Article
DateLife: Leveraging Databases and Analytical Tools to Reveal the Dated Tree of Life
Systematic Biology, syae015, https://doi.org/10.1093/sysbio/syae015
Published: 20 March 2024
Image
Cross validation of results from a DateLife analysis of the family Fringill...
in
Systematic Biology
>
DateLife: Leveraging Databases and Analytical Tools to Reveal the Dated Tree of Life
Published: 20 March 2024
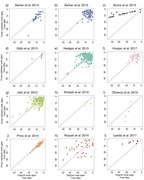
Figure 4
Cross validation of results from a DateLife analysis of the family Fringillidae, shown in Figure 3 and Supplementary Figure S3 . Each plot compares the original node age estimates from an input source study chronogram ( x -axis) with the corresponding cross-validated node age resulting from a dat
