


Abstract
Establishing an accurate evolutionary timescale for green plants (Viridiplantae) is essential to understanding their interaction and coevolution with the Earth’s climate and the many organisms that rely on green plants. Despite being the focus of numerous studies, the timing of the origin of green plants and the divergence of major clades within this group remain highly controversial. Here, we infer the evolutionary timescale of green plants by analyzing 81 protein-coding genes from 99 chloroplast genomes, using a core set of 21 fossil calibrations. We test the sensitivity of our divergence-time estimates to various components of Bayesian molecular dating, including the tree topology, clock models, clock-partitioning schemes, rate priors, and fossil calibrations. We find that the choice of clock model affects date estimation and that the independent-rates model provides a better fit to the data than the autocorrelated-rates model. Varying the rate prior and tree topology had little impact on age estimates, with far greater differences observed among calibration choices and clock-partitioning schemes. Our analyses yield date estimates ranging from the Paleoproterozoic to Mesoproterozoic for crown-group green plants, and from the Ediacaran to Middle Ordovician for crown-group land plants. We present divergence-time estimates of the major groups of green plants that take into account various sources of uncertainty. Our proposed timeline lays the foundation for further investigations into how green plants shaped the global climate and ecosystems, and how embryophytes became dominant in terrestrial environments.
Green plants (Viridiplantae) are one of the most important and dominant groups of organisms in global ecosystems. They are represented by more than 500,000 species in two main subdivisions, Chlorophyta and Streptophyta and have a nearly global distribution (Scotland and Wortley 2003; Lewis and McCourt 2004; Judd et al. 2008; Guiry 2012). Chlorophyta includes ecologically, morphologically, and cytologically diverse green algae living in a wide range of habitats (Graham et al. 2009). Streptophyta contains embryophytic land plants and a small but diverse group of freshwater green algae (Zygnematophyceae, Coleochaetophyceae, Charophyceae, Klebsormidiophyceae, Chloroky bophyceae, and Mesostigmatophyceae) (Becker and Marin 2009). The initial movement of green plants from marine to freshwater environments, followed by the subsequent colonization and domination of terrestrial ecosystems, were major evolutionary steps for biodiversity (Lewis and McCourt 2004; Leliaert et al. 2011). Obtaining a robust estimate for the evolutionary timescale of green plants is critical for understanding the diversification of Chlorophyta and Streptophyta, and for understanding how embryophytes came to dominate terrestrial ecosystems.
Reconstructing the evolutionary history of green plants has proven to be a substantial challenge. Fossils of early green plants, such as green algae, are scarce and often of uncertain taxonomic affinities. For example, Russian acritarchs (|$\sim $|2000–1800 Ma) might be representatives of either Chlorophyta or Streptophyta, or even a common ancestor of these two groups (Teyssèdre 2006). If these fossils belong to the stem lineage of the Viridiplantae, the common ancestor of Viridiplantae and Rhodophyta (red algae) must have lived at least 2000 Ma (Teyssèdre 2007). Green algal fossils of Prasinophyceae, including Tasmanites and Pterospermella, suggest that Chlorophyta and Streptophyta probably diverged long before 1200 Ma (Samuelsson et al. 1999; Teyssèdre 2007). The oldest records of possible embryophyte spores are from the Middle Cambrian Bright Angel Shale (509–507.2 Ma, Strother and Beck 2000). In the absence of corroborating evidence from mesofossils, however, it remains unclear whether these are actually from embryophytes or algae (Steemans and Wellman 2003; Wellman 2003). The second-oldest records of possible land plants are cryptospores from the middle Dapingian (472–468 Ma, Rubinstein et al. 2010; Wellman 2010). These cryptospores possess a dyad configuration that is not found in any extant seed plants, suggesting that they are most likely from stem land plants (Wellman 2010). The oldest unambiguous fossil records of land plants are trilete spores from the Katian in the late Ordovician (454–449 Ma, Steemans et al. 2009; Magallón et al. 2013). Trilete spores have been argued to be a synapomorphy of tracheophytes (Steemans et al. 2009), but some living bryophytes are also known to produce this spore type (Edwards et al. 2014; Brown et al. 2015). Nevertheless, there is no reason to doubt that trilete spores represent crown-group Embryophyta (Clarke et al. 2011).
Molecular dating represents a powerful complementary method for estimating evolutionary timescales. The past two decades have seen the development of various relaxed molecular clocks that are able to account for some degree of rate variation among lineages (e.g., Thorne et al. 1998; Drummond et al. 2006; Rannala and Yang 2007). Even with these improvements in models of rate heterogeneity, considerable disparities have been observed among estimates of the evolutionary timescale of green plants. For example, previous studies have placed the origin of green plants in the Paleoproterozoic (1700–1600 Ma, Blank 2013; 1693 Ma, Yang et al. 2016), Mesoproterozoic (1061 Ma, Heckman et al. 2001; 1210 Ma, Herron et al. 2009), and Neoproterozoic (729 Ma, Douzery et al. 2004; 968 Ma, Hedges et al. 2004; 725 Ma, Zimmer et al. 2007; 970 Ma, Leliaert et al. 2016). The origin of crown Embryophyta has been variously placed in the Neoproterozoic (748–658 Ma, Heckman et al. 2001; 805–609 Ma, Hedges et al. 2004; 918–815 Ma, Clarke et al. 2011) to the Phanerozoic (490–425 Ma, Sanderson 2003; 477 Ma, Smith et al. 2010; 475 Ma, Magallón et al. 2013; 515–470 Ma, Morris et al. 2018). The large discrepancies in date estimates have led to continued uncertainty about the timing of the origins and diversification of green plants.
The choice of fossil calibrations is one of the most important factors in molecular dating analyses (Sauquet et al. 2012; Duchêne et al. 2014a; dos Reis et al. 2016). Owing to various environmental factors such as erosion and humidity, fossilization and preservation potential varies among taxa and through time (Holland 2016). Only hard parts of organisms are easily preserved and, therefore, reliable diagnoses of fossils can be difficult to achieve. Some attempts have been made to model or reduce the impacts of uncertainties in fossil calibrations. For example, age uncertainty can be taken into account by using appropriate prior distributions for the ages of calibrating nodes (Ho and Phillips 2009). Parham et al. (2012) proposed a set of criteria for justifying fossil calibrations, including careful consideration of their phylogenetic positions and stratigraphic ages. However, these criteria have not always been applied in studies of the evolutionary timescale of green plants.
In addition to uncertainties in fossil calibrations, Bayesian molecular dating can be influenced by a range of biological and methodological factors (Beaulieu et al. 2015; Bromham et al. 2018). A key challenge lies in modeling evolutionary rate variation across branches, which is the goal of relaxed-clock models. These models can either treat rate variation as being independent across branches (uncorrelated relaxed clock; Drummond et al. 2006; Rannala and Yang 2007) or correlated between neighboring branches (autocorrelated relaxed clock; Thorne et al. 1998). To account for different patterns of rates across subsets of the sequence data, however, multiple clock models might be required. This calls for the comparison of different clock-partitioning schemes (Duchêne and Ho 2014). Additionally, when using a Bayesian approach, prior distributions need to be specified for all of the model parameters, including those of the clock model. The impacts of these choices on divergence-time estimates for early green plants remain unclear. The phylogenetic positions of some lineages of green plants are also contentious (Cooper 2014), and this could have a substantial effect on estimates of divergence times.
In this study, we estimate the timescale of green plant evolution and explore the impacts of different measures to improve the accuracy and precision of our inferred divergence times. Our analysis is based on nucleotide sequences from 81 chloroplast protein-coding genes, along with 21 fossil calibrations. We explore the impacts of the tree topology, clock models, clock-partitioning schemes, rate priors, and fossil calibrations on our inferred ages, thereby accounting for a wide range of factors that potentially affect molecular dating.
Materials and Methods
Data Set
The complete chloroplast genome sequences of 99 taxa were obtained from GenBank (Supplementary Table S1 available on Dryad at http://dx.doi.org/10.5061/dryad.n2r370n). These 99 taxa include 13 angiosperms (Angiospermae), 18 gymnosperms (Acrogymnospermae), 15 monilophytes (Monilophyta), four lycophytes (Lycopodiophyta), 1 hornwort (Anthocerotophyta), 8 mosses (Bryophyta), 3 liverworts (Marchantiophyta), 17 streptophytic algae, and 18 chlorophytic algae (Chlorophyta), along with two red algae (Rhodophyta) as outgroups. For each chloroplast protein-coding gene, sequence data were available for at least 50% of the 99 taxa. The proportions of missing data ranged from 0% for atpE to 37.4% for psaM, with an average of 12.2% missing data across the 99 taxa. The distribution of missing data appeared to be relatively even across taxa.
The nucleotide sequences of each gene were aligned at the amino acid level using MUSCLE (Edgar 2004). Each alignment was checked manually for quality and to ensure that protein-coding genes were in the correct reading frame. Ambiguous portions of the alignments were trimmed using Gblocks (Castresana 2000) with the “codon” model (-t = c), half gaps allowed (b5 = h), and other parameters at their default settings.
Evaluation of the Historical Signal in the Data
The historical signal in sequence data can be eroded by mutational saturation and confounded by compositional heterogeneity among taxa. We investigated the potential effects of these factors in our data set. The sequence data were split into the 1st and 2nd codon positions (CP12) versus the 3rd codon positions (CP3). We used a matched-pairs test of symmetry (Ababneh et al. 2006), as implemented in the software Homo (Rouse et al. 2013), to assess whether the sequences have evolved under stationary, reversible, and time-homogeneous conditions. The test yielded a J-shaped distribution of observed probabilities (Supplementary Fig. S1 available on Dryad), indicating that most sequences in our data sets have evolved under different conditions. Therefore, we considered non-reversible substitution models in our phylogenetic analyses described below.
We used the metric |$S_{ij}$| (Zhang et al. 2007) to evaluate saturation in the CP12 and CP3 data. Saturation plots show the distributions of |$S_{ij}$| for the data with constant sites included (+) or removed (-) from the alignment (Supplementary Fig. S2 available on Dryad). If |$S_{ij}$| is equal to 1, the alignment is considered to exhibit substantial saturation. The range of |$S_{ij}$| values is approximately 0.65 for CP12 data and 0.9 for CP3 data, implying that a higher level of saturation found in CP3 data. Thus, we use the CP12 data (33,160 nucleotides in total) for our main analyses below.
The performance of phylogenetic analysis can be negatively affected by differences in base composition among taxa, especially when the true tree contains short internal branches (Jermiin et al. 2004). However, a recent simulation study found that biases in phylogenetic inference tended to occur only when there were substantial differences in base composition across taxa (Duchêne et al. 2017). Similarly, a phylogenomic study of insects found a negligible impact of base compositional differences on the inferred evolutionary relationships (e.g., Misof et al. 2014). To determine whether heterogeneity in base composition among taxa might affect our inference of the tree topology, we estimated the relationships among taxa using the compositional signal in the sequence data (Lockhart et al. 1994). We calculated Aitchison distances (Aitchison 1986) between the base compositions of the taxa in our data set, and used a least-squares approach to generate trees. We used the path-distance metric (Steel and Penny 1993) to compare the topologies constructed from these Aitchison distances with those estimated in our phylogenetic analysis of the nucleotide sequences. We found that the trees inferred from sequence data had path distances of more than 700 from the trees inferred from compositional differences (Supplementary Table S2 available on Dryad). We compared this distance with a null distribution of the distances among 1000 pairs of random trees (mean 379.2, range 311.3–490.1). In this two-tailed test, the alternative hypotheses suggest more similarity or dissimilarity between our trees than to random trees. Using this approach, we found that trees from sequence alignments are significantly more dissimilar to composition trees than comparisons of random trees (|$P < 0.001$|).
Phylogenetic Inference and the Tree Topology
To identify an optimal model of sequence evolution for phylogenetic inference, we used the option “-m TEST+LM” in ModelFinder (Kalyaanamoorthy et al. 2017) to test all of the widely used reversible substitution models and Lie Markov models. The 12.12+I+|$\Gamma _{4}$| non-reversible Lie Markov model was found to provide the best fit. As we cannot rule out that compositional heterogeneity across the sequences may have biased the phylogenetic inference, we applied two strategies to reduce the effects of base composition among lineages: 1) the removal of the 3rd codon position (CP12 data set); 2) the RY recoding of purines (R) and pyrimidines (Y) on the 3rd codon position (RY-coded data set). We next conducted phylogenetic analyses using maximum-likelihood in IQ-TREE v1.6 (Nguyen et al. 2015). These data sets were analyzed with the 12.12+I+|$\Gamma _{4}$| model and two different partitioning strategies: partitioning by gene (81 data subsets) and partitioning by each codon position within each gene (162 data subsets).
Our molecular dating analyses, described in detail in the next section, were conditioned on a fixed tree topology. However, the phylogenetic relationships among mosses (Bryophyta), liverworts (Marchantiophyta), and hornworts (Anthocerotophyta) have not been resolved with confidence (Nishiyama et al. 2004; Zhong et al. 2013; Cox et al. 2014; Wickett et al. 2014; Puttick et al. 2018). In particular, it remains unclear whether bryophytes are a monophyletic sister group to all other land plants, or whether a particular group of bryophytes is the sister lineage to all other land plants. Therefore, we used topological constraints to assess the effect of alternative phylogenetic hypotheses for the position of bryophytes on our molecular dating analysis (Fig. 1a). We constrained each of the following groups as the sister lineage to all other land plants: 1) liverworts; 2) hornworts; 3) mosses; 4) liverworts + mosses; and 5) a monophyletic group of bryophytes (liverworts + mosses + hornworts). Based on each of these five phylogenetic trees, we also tested two additional topologies for the closest relative of land plants: 1) Zygnematophyceae, or 2) Zygnematophyceae + Coleochaetophyceae.
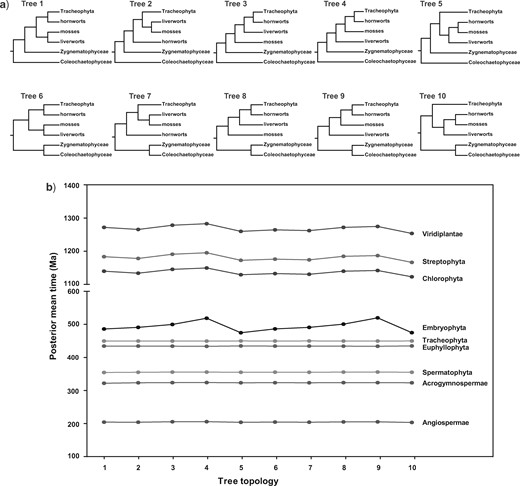
The effect of using different tree topologies on the divergence-time estimates for major groups of green plants. a) Ten trees considered in our dating analyses. b) Posterior mean age estimates of major groups of green plants across the ten tree topologies.
Divergence-Time Estimation
Divergence times were estimated from the CP12 data set using MCMCTREE in PAML v4.9 (Yang 2007) with the approximate-likelihood method (dos Reis and Yang 2011). MCMCTREE does not implement the 12.12+I+|$\Gamma _{4}$| selected in our ModelFinder analysis, so we used the most general model in MCMCTREE (GTR+|$\Gamma _{4})$|. For our main analyses, the parameters of the birth–death tree prior were fixed at birth rate |$\lambda $| = 1, death rate |$\mu $| = 1, and sampling fraction |$\rho $| = 0, which generates a uniform distribution of node ages (Yang and Rannala 1997). The posterior distribution of parameters was estimated using Markov chain Monte Carlo (MCMC) sampling. Except where noted below, samples were taken every 10|$^{3}$| steps over a total of 2 |$\times $| 10|$^{7}$| steps, after a discarded burn-in of 10|$^{6}$| steps. We ran all analyses twice to check for convergence and ensured that the effective sample sizes of all parameters were above 200. To investigate the potential impacts of saturation, we conducted replicate analyses using the CP3 data set.
For comparison, we conducted two additional divergence-time analyses using BEAST v2.4.7 (Bouckaert et al. 2014) with a gamma site model and a relaxed gamma site model. We conditioned the date estimates on a fixed tree topology, as estimated by maximum likelihood using a 162-subset partitioning scheme in IQ-TREE. We used a birth–death tree prior and an uncorrelated lognormal relaxed clock (Drummond et al. 2006). We assigned a gamma prior G(2,0.05) with mean 0.1 for the mean branch rate, along with a prior of G(2,0.04) with mean 0.08 for the standard deviation of branch rates. All fossil calibrations were implemented as uniform priors on node times. The posterior distribution was estimated using MCMC sampling, with samples drawn every 5000 steps over a total of 50 million steps. The first 40% of samples were discarded as burn-in. We checked for convergence by conducting four independent runs, then combined all of the samples to improve the effective sample sizes of the parameters.
Taxon sampling
The mode and density of taxon sampling have the potential to influence estimates of divergence times, particularly when the sampling scheme is not consistent with the assumptions of the tree prior in a Bayesian dating analysis (Beaulieu et al. 2015; but see Foster et al. 2017). To evaluate the impacts of our low-density, representative sampling of green plant lineages, we repeated our dating analyses with several different values for the sampling proportion. Our 97-taxon sample represents 0.019% of the total number of green plant species (|$\sim $|500,000, Scotland and Wortley 2003; Lewis and McCourt 2004; Judd et al. 2008; Guiry 2012). We carried out additional analyses in which the sampling proportion was increased to 0.19%, 1.9%, and 19%.
Clock models and clock-partitioning schemes
We compared the strict-clock model against an unconstrained model using a likelihood-ratio test in PAML. The test strongly rejected a strict molecular clock (|$\Delta $|ln|$L$| = 68,019.7, d.f. = 97, |$P << 0.001$|). Therefore, we analyzed the sequence data using uncorrelated (independent rates) and autocorrelated-rates models. To compare the fit of these two relaxed-clock models, we calculated their marginal likelihoods using thermodynamic integration based on Gaussian quadrature (Rannala and Yang 2017) in MCMCTREE (dos Reis et al. 2018). This requires calculation of the full likelihood; for computational tractability, we analyzed a subset of 11 green plants and assumed that the relative fit of the two clock models was also applicable to the full data set (following Barba-Montoya et al. 2018).
We compared the influence of four clock-partitioning schemes on divergence-time estimation. First, we assigned a separate clock model to each of the 81 genes. This reflects a situation in which each gene is subject to different evolutionary constraints. Second, we assigned separate clock models to the 1st codon positions and to the 2nd codon positions. Third, we used a partitioning scheme in which the 81 genes were grouped according to their degree of among-lineage rate variation. For this purpose, we estimated the coefficient of variation of branch rates using BEAST and used these estimates to partition the genes into three, nine, and 27 groups (ordered by the degree of among-lineage rate variation). Fourth, we partitioned the genes according to their patterns of among-lineage rate variation using ClockstaR v2 (Duchêne et al. 2014b; Duchêne et al. 2016). For this approach, we estimated the branch lengths separately for each gene using RaxML (Stamatakis 2014), with the topology constrained to match that in our analysis using a partitioning scheme with 162 data subsets. In our analyses involving of 27 and 81 clock models, our MCMC analyses were run for 2 |$\times $| 10|$^{5}$| steps.
For each of the clock models, we examined the impact of varying the priors on the model parameters. For the overall rate parameter (|$\mu $|), which represents the mean substitution rate at each locus, we primarily set a gamma prior |$\mu $||$\sim $|G(1,10). This gives an average rate of 0.1 substitutions per site per 10|$^{8}$| years. Then we fixed its shape hyperparameter |$\alpha $||$_{\mu }$| = 1 and changed the scale hyperparameter |$\beta $||$_{\mu }$| by increasing or decreasing it 10-fold to explore the sensitivity of age estimates to this prior. The second clock-model parameter, |$\alpha $|, describes the variability in the overall rate across loci. A higher value of |$\alpha $| means that rates are nearly identical across loci, whereas a lower value means the rates are more variable across loci. We performed dating analyses using three values of the |$\alpha $| parameter: 100, 1, and 0.01. The third clock-model parameter is the rate-drift parameter (|$\sigma $||$^{2})$|, which reflects the degree of rate heterogeneity across branches. We set |$\sigma $||$^{2}\sim $|G(1,12), where 1 represents a diffuse prior and the mean (1/12) represents the reciprocal of the prior mean of the age of the ingroup (in units of 10|$^{8}$| years). To examine the impact of the |$\sigma $||$^{2 }$|parameter, we also used a G(10,12) prior to represent high among-lineage rate variation and a G(0.1,12) prior to represent low among-lineage rate variation.
Fossil calibrations
We used 21 fossil calibrations in our molecular dating analyses, comprising a total of 36 age constraints. These were applied as paired minimum and maximum bounds on 15 nodes, minimum bounds on five nodes, and a maximum bound on one node (Table 1). Fossil calibrations were chosen according to the criteria proposed by Parham et al. (2012). All minimum bounds are derived from the oldest unequivocal fossil records for the corresponding groups. Maximum bounds are controversial because they cannot be explicitly derived from the fossil record, so we tested the impact of different maximum constraints on four critical nodes. The first three nodes are Anthocerotophyta-Tracheophyta, Bryophyta-Marchantiophyta, and crown Embryophyta, and all share the same maximum age constraint. We changed this constraint from the age of the Torridon Group sediment devoid of plant-like spores (1042 Ma) to the oldest records of possible embryophyte spores (509 Ma). The fourth node is the root and represents the most recent common ancestor of green plants and red algae. The fossil record for this ancient part of the green plant phylogeny is largely absent. We changed this constraint from 2000 Ma (the age of Russian acritarchs; Teyssèdre 2007) to 3500 Ma (the age of the first known fossils; Westall et al. 2001; Schopf et al. 2002; Herron et al. 2009).
Comparison of molecular estimates of divergence times against fossil-based age constraints
| Node/Clade | Estimated age (Ma) | Fossil calibration (Ma) | References | |
|---|---|---|---|---|
| Mean (95% CI) | Minimum bound | Maximum bound | ||
| Rhodophyta-Chlorophyta | 1642.1 (1387.4–1942.6) | — | 3500 (first known fossil) | Westall et al. (2001) |
| Rhodophyta | 1265.4 (1008.6–1557.3) | 1174 (Bangiomorpha) | — | Butterfield (2000) |
| Prasinophyceae | 1032.2 (870.1–1201.4) | 1200 (Pterospermella) | — | Samuelsson et al. (1999) |
| Chlorophyceae | 669.3 (561.3–771.6) | 750 (Palaeastrum) | — | Butterfield et al. (1994) |
| Charophyceae | 408.4 (334.4–503.1) | 405 (Trochiliscus sp.) | — | Wang et al. (2003) |
| Zygnemataceae | 552.3 (477.5–636.0) | 345 (Tetraporina) | — | Mullins and Servais (2008) |
| Embryophyta | 486.1 (463.8–511.4) | 449 (trilete spores) | 1042 (Precambrian sediments of the Torridon Group in which land plants could flourish) | Steemans et al. (2009) and Strother et al. (2011) |
| Liverworts-Mosses | 452.1 (401.4–492.8) | 381.1 (Metzgeriothallus sharonae sp. nov.) | ” | Hernick et al. (2008) |
| Hornworts-Tracheophyta | 472.8 (452.4–494.3) | 420.4 (Cooksonia) | ” | Edwards and Feehan (1980) and Edwards et al. (1983) |
| Tracheophyta | 449.7 (438.3–457.6) | 416 (Zosterophyllum sp.) | 454 (trilete spores) | Kenrick and Crane (1997) and Steemans et al. (2009) |
| Euphyllophyta | 434.3 (419.5–446.1) | 388.2 (Ibyka and Rellimia) | ” | Skog and Banks (1973) |
| Spermatophyta | 354.5 (335.4–369.0) | 306.2 (Cordaixylon iowensis) | 366.8 (first records of seeds in VCo biozone) | Trivett (1992) and Prestianni (2005) |
| Acrogymnospermae | 322.1 (304.6–340.4) | ” | ” | ” |
| Ginkgo-Cycas | 271.5 (222.1–316.9) | 264.7 (Crossozamia) | ” | Gao and Thomas (1989) |
| Conifers | 285.9 (261.7–310.8) | 147 (Araucaria mirabilis) | 309.5 (sediments containing Cordaixylon iowensis) | Stockey (1975) and Trivett (1992) |
| Angiospermae | 204.3 (174.4–238.2) | 124 (tricolpate pollen) | 248.4 (sediments below the oldest occurrence of angiosperm-like pollen that are devoid of such pollen) | Hughes and McDougall (1987) and Hochuli and Feist-Burkhardt (2004) |
| Austrobaileyales-Mesangiospermae | 176.4 (151.7–205.9) | ” | ” | ” |
| Mesangiospermae | 157.1 (135.9–183.2) | ” | ” | ” |
| Chloranthaceae-Monocotyledoneae+ Eudicotyledoneae | 151.4 (130.6–176.9) | ” | ” | ” |
| Monocotyledoneae-Eudicotyledoneae | 135.2 (117.9–157.8) | ” | ” | ” |
| Malvidae-Fabidae | 94.6 (80.6–114.4) | 82.8 (Paleoclusia chevalieri and Dressiantha bicarpellata) | 127.2 (oldest records of tricolpate pollen) | Gandolfo et al. (1998) and Crepet and Nixon (1998) |
Note: Divergence times were estimated from our CP12 data set using MCMCTREE. Dating analyses were done on Tree 1 (liverworts-mosses as sister lineage to all other land plants). Separate GTR+ |$\Gamma _{4}$| substitution models and independent-rates clock models were assigned to each of the two codon positions. The priors on the parameters of the clock models were set to intermediate values, and Cauchy distributions with long tails (|$p $|= 0.1, |$c $|= 1) were used for the fossil calibration priors.
Although Precambrian fossils provide evidence of marine algae, these early records are sparse and uncertain. To evaluate the influence of the Precambrian calibration constraints in our study, we performed additional analyses in which we further excluded 1) the oldest Precambrian fossil Pterospermella (20 calibrations); 2) two Precambrian fossils Pterospermella and Bangiomorpha (19 calibrations); and 3) all three Precambrian fossils Pterospermella, Palaeastrum, and Bangiomorpha (18 calibrations).
In addition to the choice of fossils, the choice of prior probability densities for the fossil calibrations can have an impact on divergence-time estimates. The 15 calibrations with minimum and maximum bounds were represented as uniform distributions with soft bounds, allowing 2.5% of the probability beyond each bound. The five calibrations with only minimum bounds available were each assigned a truncated Cauchy distribution. The Cauchy distribution is described by a location parameter |$p$| and scale parameter c. It has been suggested that the |$c$| parameter has a greater impact on date estimates (Inoue et al. 2010), so we kept |$p$| constant and varied |$c$| from 1 (a long tail) to 0.5 (a medium tail) and 0.2 (a short tail) for the Cauchy distribution. The maximum constraint on the age of the root node was also treated as a soft bound by allowing a 2.5% probability of older ages. We compared these user-specified calibration priors with the marginal priors on node times by running the MCMC analyses without sequence data (Supplementary Figs. S3 and S4 available on Dryad).
Results and Discussion
Phylogenetic Relationships
Our four phylogenetic analyses, each using 81 chloroplast protein-coding genes from 97 green plants and two red algae (outgroups), yielded similar tree topologies with high bootstrap support (Supplementary Figs. S5–S8 available on Dryad). The inferred phylogenies were consistent with those from previous studies of green plants (Ruhfel et al. 2014; Wickett et al. 2014; Puttick et al. 2018). Although the relationships among the major clades of green plants are well defined, the positions of some clades remain uncertain. For example, there is continuing debate about the relationships among three bryophyte lineages (mosses, liverworts, and hornworts), representing the closest relatives to all other land plants (Cox et al. 2014; Liu et al. 2014). For the CP12 data set, the relationship ((liverworts, mosses), (hornworts, vascular plants)) was supported using the non-reversible 12.12+I+|$\Gamma _{4}$| substitution model with two partitioning strategies (Supplementary Figs. S5 and S6 available on Dryad). The relationship (liverworts, (mosses, (hornworts, vascular plants))) was inferred based on the RY-coded data set with two partitioning strategies (Supplementary Figs. S7 and S8 available on Dryad).
There has also been uncertainty surrounding the sister group of land plants. Our analyses place Zygnematophyceae as the sister group to land plants, a result that is congruent with the relationships inferred in recent phylogenetic analyses of transcriptome data (Zhong et al. 2013; Wickett et al. 2014; Puttick et al. 2018). However, a few studies have found alternative support for a clade containing Zygnematophyceae and Coleochaetales as the sister lineage to land plants (Laurin-Lemay et al. 2012; Springer and Gatesy 2014).
Factors Affecting the Estimated Divergence Times of Green Plants
Estimates of the evolutionary timescale of green plants have the potential to be influenced by a range of factors, including the choice of Bayesian dating method, taxon sampling, molecular data, tree topology, clock model, clock-partitioning scheme, rate prior, and fossil calibrations. The divergence times of major embryophyte clades were highly congruent between our MCMCTREE and BEAST analyses, although some of the ancient nodes (e.g., Streptophyta, Chlorophyta, and Viridiplantae; Supplementary Table S3 available on Dryad) were found to be older using BEAST. This is possibly due to differences in the construction of node-age priors in MCMCTREE and BEAST. In MCMCTREE, a conditional construction is used to combine the calibration densities with the birth–death process model. However, BEAST uses a multiplicative construction to combine the relative node times from the birth–death prior with the user-specified calibration densities. Varying the sampling proportion for the birth–death tree prior did not affect the age estimates for green plants (Supplementary Fig. S9 available on Dryad). We discuss the impact of other components of the analyses in turn, then present estimates of key divergence times that take the various sources of uncertainty into consideration.
Our Bayesian dating analysis of the CP3 data set, which showed strong evidence of saturation, produced generally far older inferred ages than the CP12 data set (Table 2). An exception to this pattern was seen for several of the shallower nodes in the tree (e.g., Angiospermae, Acrogymnospermae, Spermatophyta, Euphyllophyta, Tracheophyta; Table 2). Overall, this result is consistent with the idea that saturation at third codon positions can lead to biased estimates of the lengths of deep branches in the tree (Phillips 2009).
Comparison of posterior divergence times of major green plants across analyses using different data sets and relaxed-clock models
| Node/Clade | Mean age (95% CI) (Ma) | ||
|---|---|---|---|
| CP3, IR | CP12, IR | CP12, AR | |
| Angiospermae | 207.2 (170.3–248.2) | 204.3 (174.4–238.2) | 218.6 (196.4–241.0) |
| Acrogymnospermae | 318.2 (302.7–339.8) | 322.1 (304.6–340.4) | 323.0 (305.7–339.1) |
| Spermatophyta | 348.5 (325.9–367.8) | 354.5 (335.4–369.0) | 352.6 (337.1–367.4) |
| Euphyllophyta | 421.2 (397.2–442.8) | 434.3 (419.5–446.1) | 436.9 (426.5–445.9) |
| Tracheophyta | 445.6 (427.7–457.1) | 449.7 (438.3–457.6) | 450.4 (440.0–457.4) |
| Embryophyta | 602.3 (500.1–717.3) | 486.1 (463.8–511.4) | 482.4 (466.6–498.2) |
| Streptophyta | 1575.0 (1310.3–1837.8) | 1183.6 (1015.2–1358.4) | 1115.1 (937.7–1309.3) |
| Chlorophyta | 1428.3 (1218.6–1665.7) | 1139.9 (985.1–1313.1) | 1065.8 (889.6–1246.0) |
| Viridiplantae | 1738.2 (1481.8–1979.9) | 1271.9 (1098.5–1453.0) | 1162.9 (969.7–1360.7) |
Note: CP3 and CP12 refer to analyses of the 3rd codon position and 1st + 2nd codon positions, respectively. IR and AR refer to analyses using the independent-rates and the autocorrelated-rates clock models, respectively. In all analyses, Tree 1 (see Fig. 1) was used with the GTR+|$\Gamma _{4}$| substitution model. The prior on parameters of the clock model were set to intermediate values: |$\mu \sim $|G(1,10), |$\alpha = 1$|, and |$\sigma^{2} \sim$| G(1,12). Minimum age bounds were specified using Cauchy priors with long tails (|$p = 0.1$|, |$c = 1$|).
To account for uncertainty in the phylogenetic relationships of green plants, we performed dating analyses on a total of 10 different trees (Fig. 1a). These accounted for alternative phylogenetic relationships among mosses (Bryophyta), liverworts (Marchantiophyta), and hornworts (Anthocerotophyta), and uncertainty in the sister lineage to land plants. Our results show that differences in tree topology had only small effects on the estimated ages of nodes that were well calibrated and/or where the local parts of the phylogeny were well accepted, such as crown Angiospermae, Acrogymnospermae, Spermatophyta, Euphyllophyta, and Tracheophyta (Fig. 1b). In contrast, some deep nodes for which fossil calibrations were scarce (e.g., Streptophyta, Chlorophyta, and Viridiplantae) showed greater variation in estimated ages.
We observed particularly high levels of variation in the estimated ages of crown Embryophyta when the relationships among bryophytes were altered. For example, in Tree 4 (liverworts–mosses–hornworts, Fig. 1a), the mean age of crown Embryophyta was 519.9 Ma (553.4–486.5 Ma). This was considerably older than when bryophytes were constrained to be monophyletic (Tree 5, Fig. 1a). In this analysis, the mean age of crown Embryophyta was inferred to be 474.5 Ma (497.9–454.3 Ma). This suggests that the uncertainty in the relationships among bryophytes has a considerable effect on the estimated age of crown Embryophyta. Obtaining a reliable estimate of the relationships among bryophytes enables us to bracket the age of crown Embryophyta more accurately. Moving the phylogenetic placement of charophytes close to the land plants did not have an impact on the age estimates of crown Embryophyta (e.g., 511.4–463.8 Ma for Tree 1; 511.9–464.3 Ma for Tree 6; Fig. 1b).
The impact of clock models and clock-partitioning
The mean estimated ages for the main embryophyte clades (Angiospermae, Acrogymnospermae, Spermatophyta, Euphyllophyta, Tracheophyta, and Embryophyta) were similar between the independent-rates and autocorrelated-rates models (Table 2). For deep nodes in the tree, however, such as the crown groups of Viridiplantae, Streptophyta, and Chlorophyta, the ages inferred with the autocorrelated-rates model were substantially younger than those with the independent-rates model. Based on our analysis of the reduced data set, the independent-rates model had a higher marginal likelihood (ln|$L =-$|170,275.7) than the autocorrelated-rates model (ln|$L $|= -170,277.9), with a posterior model probability of nearly 0.9 (Supplementary Table S4 available on Dryad). The greater fit of the independent-rates model is consistent with the results of recent large-scale analyses of sequence data from plants (Foster et al. 2017; Barba-Montoya et al. 2018), and might reflect the sparse taxonomic sampling in the data set (Ho 2009).
Recent studies have demonstrated that using partitioned clock models can account for rate heterogeneity among genes and lineages, and increasing the degree of clock-partitioning can improve the precision of divergence-time estimates (Zhu et al. 2015; Barba-Montoya et al. 2017; Foster and Ho 2017; Angelis et al. 2018). We employed four clock-partitioning schemes: 1) partitioning by codon position (two clocks), 2) partitioning by gene (81 clocks); 3) partitioning by the degree of rate heterogeneity among lineages (three, nine, and 27 clocks); and 4) partitioning using ClockstaR (one clock). We found large differences in age estimates among clock-partitioning strategies (Supplementary Table S5 available on Dryad). With increasing numbers of clocks, the inferred ages of deep nodes tended to decrease. For example, age estimates for crown-group Viridiplantae varied from 1679.3–1177.2 Ma (1 clock) to 1133.6–1036.9 Ma (81 clocks). However, the age estimates of shallow nodes (e.g., Tracheophyta, Euphyllophyta, and Spermatophyta) varied only slightly across different analyses. An exception is the age of crown angiosperms (252.4–187.6 Ma for one clock; 163.7–147.1 Ma for 81 clocks; Supplementary Table S5 available on Dryad). Similarly, Angelis et al. (2018) inferred younger divergence times for angiosperms as the degree of partitioning increased. These results confirm previous findings that different clock-partitioning strategies can have substantial impacts on divergence-time estimates.
Increasing the number of clocks led to more precise age estimates for green plants, as reflected in the decreasing widths of the 95% credibility intervals (CIs) of the date estimates (Fig. 2). A regression line through the origin has the equation |$w $|= 0.4813|$t$| when a single clock is assumed, meaning that every 1 Myr of time adds 0.48 Myr to the 95% CI width. When implementing 81 clocks, the regression coefficient was reduced to 0.1322, such that every 1 Myr of time adds only 0.13 Myr to the 95% CI width. The correlation was weak in the analyses using only one clock (|$R^{2}$| = 0.4903) and became stronger when increasing the number of clocks (|$R^{2}$| = 0.6172 for 81 clocks; Fig. 2). This is probably because a partitioned-clock model treats each subset of the data as an independent locus, and more sequence information (i.e., a larger number of loci) can help to improve the precision of estimated divergence times (Zhu et al. 2015; Foster and Ho 2017; Angelis et al. 2018).
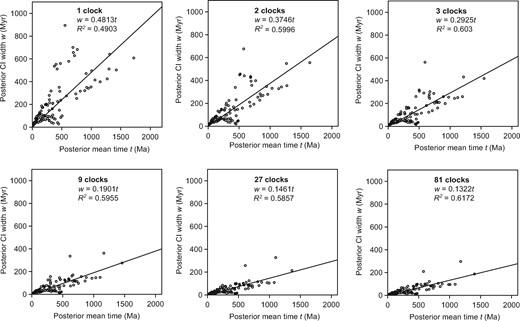
Plots of the 95% credibility interval widths against the posterior mean age estimates, for analyses of divergence times in green plants using different numbers of clocks. The low |$R^{2}$| values indicate that some of the estimation errors can be attributed to the limited amount of sequence data. The regression coefficient (slope) reflects the degree of precision in the fossil calibrations.
We also standardized the precision of estimates based on posterior mean ages, and evaluated the improvements in the precision of node-age estimates to explore the impact of using different clock-partitioning strategies. Our results show that increasing the number of clocks led to further improvement in precision, especially for the age estimates of deep nodes (Supplementary Table S5 available on Dryad). The 95% CI width for the inferred age of crown Viridiplantae was reduced from 502 Myr (one clock) to 96.7 Myr (81 clocks), representing a 74.8% improvement in precision. Increasing the number of clocks from one to 81 led to increases of 71.3% and 76.1% in precision of the age estimates for crown Chlorophyta and Streptophyta, respectively. An improvement in precision with the number of clocks was also observed in the age estimate for crown Embryophyta (82.6% improvement in precision from 1 clock to 81 clocks). Although increasing the number of clocks can lead to an improvement in precision, we should consider whether different clock-partitioning strategies are biologically meaningful, and treat the improvement in precision from clock-partitioning with caution (Zhu et al. 2015; Foster and Ho 2017; Angelis et al. 2018; Jin and Brown 2018). One solution to this conundrum is to use an objective method to determine the optimal number of clock models (Duchêne et al. 2014b; Snir 2014).
Estimates of divergence times were largely robust to variation in the priors chosen for the three parameters of the clock model (Supplementary Fig. S10 available on Dryad). For example, there was little impact on the age estimates for major embryophyte lineages, including Embryophyta, Tracheophyta, Euphyllophyta, Spermatophyta, Acrogymnospermae, and Angiospermae. The mean age estimates for crown Viridiplantae only varied by approximately 17 Myr across all of the different choices of priors for the parameters of the clock model. Our results are consistent with those of previous studies in showing the modest impact of the rate prior on divergence-time estimation (Groussin et al. 2011; dos Reis et al. 2012; Foster et al. 2017; Liu et al. 2017).
The impact of fossil calibrations
We specified calibrations for 21 nodes based on fossil evidence. For the ages of many of these calibrating nodes, the marginal priors differed from the individual user-specified priors but were still quite diffuse (Supplementary Figs. S3 and S4 available on Dryad). The posterior time estimates of most nodes were largely compatible with fossil evidence, with any gaps in age between fossils and molecular estimates being relatively small (Table 1). However, there appear to be some conflicts between fossils and molecular data at two ancient nodes; in neither of these cases was the discrepancy reflected in the marginal prior on the node age. One conflict concerns the origin of Zygnemataceae (Charophytes). The posterior mean age of crown Zygnemataceae, at 552.3 Ma (636.0–477.5 Ma), was much older than the minimum fossil bound of 347 Ma, indicating a large gap between the estimated time and oldest fossil record. This could be at least partly due to an overestimation of the divergence time by molecular dating. Alternatively, the discrepancy in date estimates could be because most ancient streptophytic algae lacked calcification and because records of streptophytic algae are scarce, leading to underestimation of the ages of these groups when the fossil record is interpreted literally (McCourt et al. 2004). The second conflict concerns the origin of Prasinophyceae (Chlorophyta). The mean age of crown Prasinophyceae was inferred to be 1032.2 Ma (1201.4–870.1 Ma), with the lower limit of the 95% CI being far younger than the minimum fossil constraint of 1200 Ma that we applied. This might imply that the Prasinophyceae fossil (Pterospermella) that we chose to calibrate this group was inappropriate and might have been better placed as a stem relative, or that there is a conflict or interaction between fossil calibrations.
The Precambrian fossil records of some ancient lineages (e.g., green algae and red algae) are sparse, and the taxonomic assignment of these Precambrian fossils has been called into question (Teyssèdre 2007). Apparent conflicts between fossils and molecular data in our analyses mainly occurred at the nodes calibrated with Precambrian fossils. We found that the estimated dates of major embryophyte lineages were stable regardless of whether Precambrian fossils were included as calibrations or not (Fig. 3a–c). However, removing Precambrian fossils shifted the estimated ages of ancient nodes towards the present: the estimated age of Viridiplantae was reduced from 1453.0–1098.5 Ma (21 calibrations, including all Precambrian age constraints) to 1336.1–1022.5 Ma (20 calibrations), 1287.4–959.9 Ma (19 calibrations), and 1174.9–881.7 Ma (18 calibrations). Similar trends were found in the estimated ages of crown Chlorophyta and crown Streptophyta (Fig. 3a–c). Nevertheless, we still favor including all three Precambrian fossils for the purposes of calibration. This is because the Precambrian fossils that we chose are widely accepted by paleontologists, and our calibration priors had soft bounds that allowed date estimates to fall outside the specified uniform distribution. It is clear that these fossil constraints are in need of further scrutiny, but are still worth including in molecular dating analyses to allow their impacts on inferred ages to be examined critically.
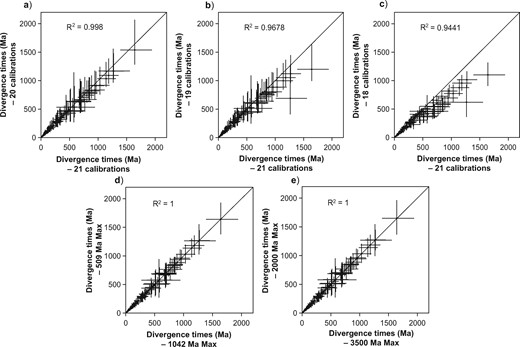
Comparison of divergence-time estimates for green plants, based on different sets of fossil calibrations. a) Divergence times inferred using 20 fossil calibration constraints (the oldest Precambrian fossil excluded), plotted against divergence times inferred using all fossil calibrations (21 calibrations). b) Divergence times inferred using 19 fossil calibrations (two Precambrian fossils excluded), plotted against divergence times inferred using all fossil calibrations. c) Divergence times inferred using 18 fossil calibrations (all three Precambrian fossils excluded), plotted against divergence times inferred using all fossil calibrations. d) Divergence times inferred using a maximum constraint of 509 Ma on three nodes (Anthocerotophyta-Tracheophyta, Bryophyta-Marchantiophyta, and Embryophyta), plotted against divergence times inferred using a maximum constraint of 1042 Ma for the same three nodes. e) Divergence times inferred using a maximum constraint of 2000 Ma for the root node (the split between Viridiplantae and red algae), plotted against divergence times inferred using a maximum constraint of 3500 Ma for the root node.
The maximum age constraint of 1042 Ma that we implemented for the crown nodes of Anthocerotophyta-Tracheophyta, Bryophyta-Marchantiophyta, and Embryophyta is somewhat arbitrary. This constraint was formulated without a firm basis in fossil evidence and only depended on the age of Precambrian sediments in the Torridon Group, representing the beginning of environments in which Embryophyta would have been able to flourish (Strother et al. 2011). As an alternative form of calibration, we selected a much younger maximum constraint of 509 Ma, representing the age of the oldest embryophyte spores exhibiting two synapomorphies of Embryophyta (Strother and Beck 2000; Strother et al. 2004). Altering this maximum constraint had minimal impacts on the age estimates for green plants (Fig. 3d). Similarly, our date estimates were robust to changes in the calibration applied to the root node (Fig. 3e). We calibrated this node either using Russian acritarchs dated to 2000 Ma, which probably represent stem relatives of Chlorophyta and Streptophyta (Teyssèdre 2007), or by the presence of the first known fossil in the early Archean at 3500 Ma (Westall et al. 2001; Schopf et al. 2002; Herron et al. 2009).
Changing the hyperparameters of the calibration prior densities had large effects on the mean age estimates for five ancient nodes. When we increased the scale hyperparameter (|$c)$| of the Cauchy priors for the ages, the specified calibration densities became flatter and the 95% limit of the soft maximum constraints became older (Supplementary Fig. S11 available on Dryad). This led to substantially older prior divergence times (Supplementary Table S6 available on Dryad). In contrast, increasing the scale hyperparameter of the Cauchy priors tended to produce younger posterior estimates of divergence times with wider 95% CIs (Supplementary Table S7 available on Dryad).
Using these different calibration densities yielded similar posterior age estimates for the younger nodes (e.g., major lineages of embryophytes; Fig. 4). However, the estimated ages of nodes that lacked fossil calibrations or were close to the root exhibited dramatic differences among different calibration densities (e.g., Streptophyta, Chlorophyta, and Viridiplantae; Fig. 4). We attribute this to a paucity of paleontological evidence for early green plants, resulting in less informative fossil calibrations. New paleobotanical discoveries and reliable interpretations of the ages of fossil evidence will help to refine estimates of the deep divergence times in the green plant phylogeny.
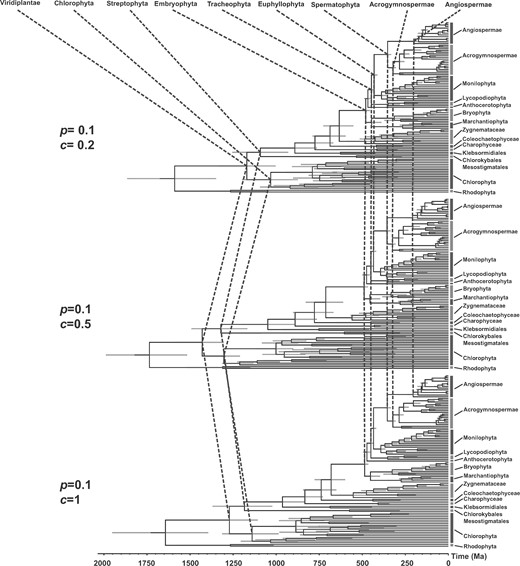
Comparison of time-trees of green plants estimated using different parameterizations of the Cauchy prior for fossil calibrations. The three time-trees were estimated using Cauchy calibration priors with hyperparameters |$p = 0.1$| and |$c = 0.2$| (Cauchy distributions with short tails), |$p = 0.1$| and |$c = 0.5$| (Cauchy distributions with medium tails), and |$p = 0.1$| and |$c = 1$| (Cauchy distributions with long tails).
The Evolutionary Timescale of Green Plants
Overall, our estimate of the evolutionary timescale of green plants is robust to a range of potentially confounding factors in Bayesian molecular dating, including variation in the parameters of the clock model. The divergence-time estimates for green plants, except for the embryophytes, were similar across all of the tree topologies considered in our study. The factors that had the largest influence on our divergence-time estimates for ancient green plants were the choices of clock-partitioning scheme and fossil calibrations. Taking a collective view of the major sources of uncertainty allows us to establish a reliable evolutionary timescale of green plant evolution (Fig. 5).
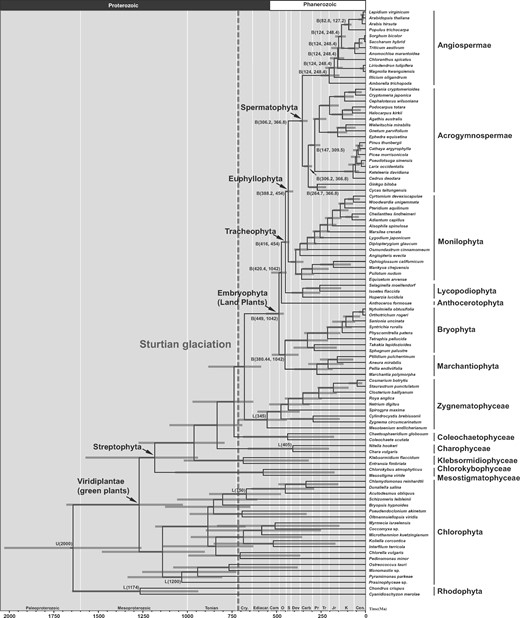
Time-tree of green plants inferred from the 1st and 2nd codon positions of 81 chloroplast protein-coding genes, taking into account two major sources of uncertainty in molecular dating. Three types of fossil calibrations were used: L(t|$_{L})$| denotes a minimum-age bound implemented using a truncated Cauchy distribution; B(t|$_{L}$|, t|$_{U})$| denotes a joint (minimum- and maximum-age) bound implemented using a uniform distribution; and U(t|$_{U})$| denotes a maximum-age bound. Node ages are plotted as the posterior mean based on our analysis of the CP12 data set, using tree topology 1, an independent-rates model, intermediate values for the priors on the clock-model parameters, a clock-partitioning scheme with two clocks, and Cauchy distributions with long tails (|$p = 0.1$|, |$c = 1$|). The node bars are composites of the 95% credibility intervals across the analyses of four clock-partitioning schemes and three types of calibration density. The vertical dashed line indicates the upper limit of Sturtian glaciation (|$\sim $|717 Ma). Cen = Cenozoic; K = Cretaceous; Jr = Jurassic; Tr = Triassic; Pr = Permian; Carb = Carboniferous; Dev = Devonian; S = Silurian; O = Ordovician; Cam = Cambrian; Cry = Cryogenian.
Taking into consideration the 95% CIs of the date estimates across our analyses based on four clock-partitioning schemes and three choices of calibration densities, we estimate the crown age of green plants at 1679.7–1025.6 Ma. This suggests an origin in the Paleoproterozoic-Mesoproterozoic and falls within the range of previous estimates (1700–725 Ma). Morris et al. (2018) estimated a much more recent, Neoproterozoic crown age for green plants at 972.4–669.9 Ma, in their analysis that included land plant lineages and a few green algae. The date estimates that we present here are more conservative because they are not based on a single dating analysis, but instead represent a collective estimate that accounts for various sources of uncertainty. For example, our estimate takes into account three fossil calibration strategies that reflect different interpretations of early plant fossil records, as well as four clock-partitioning schemes to account for various forms of evolutionary rate heterogeneity.
Chlorophyta and Streptophyta (two major subdivisions of the green plants) originated in the Mesoproterozoic–Neoproterozoic (1480.0–902.9 Ma and 1571.8–940.9 Ma). Land plants originated in the Ediacaran to middle Ordovician (559.3–459.9 Ma), an estimate that falls within the range of dates inferred in previous studies. Our estimate is also highly congruent with the timescale of land plant origins inferred by Morris et al. (2018), but with an older 95% CI upper limit. The appearance of the major lineages of embryophytes (Tracheophyta, Euphyllophyta, Spermatophyta, Acrogymnospermae, and Angiospermae) occurred over a period of approximately 313 Myr from the Ordovician to the Jurassic.
Implications for the Snowball Earth Hypothesis
Our molecular-clock analyses place the origin of green plants in a time during which the global environment on earth was stable (Pierrehumbert et al. 2011). This was abruptly ended by three massive glaciation events (“Snowball Earth”) in the Neoproterozoic era, including the Sturtian glaciation (about 717–662 Ma; Rooney et al. 2014), the Marinoan glaciation (about 639–635 Ma; Prave et al. 2016), and the Gaskiers glaciation (about 580 Ma; Pierrehumbert et al. 2011). Most Snowball Earth hypotheses posit geological explanations for Neoproterozoic glaciation (Goddéris et al. 2003; Hoffman and Schrag 2010; Rooney et al. 2014), but do not consider the potential impacts of prehistoric organisms on the formation of glaciers.
Recent studies based on climate model simulations have suggested that an increase in cloud condensation nuclei could have cooled the Earth’s climate and made the Neoproterozoic climate system much more susceptible to glaciations (Feulner et al. 2015). Marine eukaryotic algae are the primary source of cloud condensation nuclei through their production of dimethylsulfoniopropionate (Simó 2001), which has important roles in osmoregulation and cryoprotection (White 1982; Vairavamurthy et al. 1985; Kiene and Linn 2000) and which is the biological precursor of dimethylsulfide. Our results suggest that dimethylsulfide-producing green algae flourished prior to the onset of the Sturtian glaciation (Fig. 5). It is likely that marine dimethylsulfide emissions increased between the late Mesoproterozoic and early Neoproterozoic (|$\sim $|1200–750 Ma). Subsequently, a portion of the dimethylsulfide in the atmosphere was oxidized to sulfate aerosols, which act as cloud condensation nuclei. The rise in concentrations of cloud condensation nuclei might have contributed to dramatic cooling, leading to the Earth entering glaciation cycles during the Neoproterozoic. This supports the hypothesis of snowball cooling after the rise and proliferation of algae (Feulner et al. 2015).
Becker (2013) hypothesized that the Gaskiers glaciation (|$\sim $|580 Ma) was a key driver of land plant evolution. However, the study lacked estimates of the timing of early streptophyte diversification. The Gaskiers glaciation is suggested to have bound large amounts of water, resulting in a globally drier climate. Streptophyte algae present during this period would have had to adapt to severe conditions before eventually conquering dry land. Our analyses have dated the origin of land plants at 559.3–459.9 Ma, suggesting that the earliest land plants colonized dry land after the Gaskiers glaciation. These results further support hypotheses that the Gaskiers glaciation was the trigger for the colonization of land by plants.
Conclusions
Our study provides a comprehensive evaluation of the robustness of Bayesian phylogenetic estimates of the timing of green plant origin and evolution. We find that the choices of fossil calibrations and clock-partitioning schemes had the largest impact on date estimation. By taking into account various sources of uncertainty, we estimate that crown-group green plants originated in the Paleoproterozoic–Mesoproterozoic (1679.7–1025.6 Ma), crown-group Chlorophyta and Streptophyta originated in the Mesoproterozoic–Neoproterozoic (1480.0–902.9 Ma and 1571.8–940.9 Ma), and crown-group land plants originated in the Ediacaran to middle Ordovician (559.3–459.9 Ma).
The importance of fossil calibrations has been confirmed by the results of our analyses. This emphasizes the role of the fossil record in helping to improve the precision of molecular estimates of the evolutionary timescale of green plants (Yang and Rannala 2006; Foster et al. 2017; Barba-Montoya et al. 2018). Reducing the uncertainties in fossil calibrations will partly depend on new fossil discoveries and refinements of the ages of fossil-bearing strata, but also on improving the use of existing fossil information. Our study presents an estimate of the timescale of green plant evolution that provides appropriate recognition of the current uncertainties in the fossil evidence. With improvements in the accuracy and precision of molecular dating, we will be able to make further progress in understanding the formation of Earth’s ecosystems and the emergence of land plants.
Supplementary Material
Data available from the Dryad Digital Repository: http://dx.doi.org/10.5061/dryad.n2r370n.
Funding
This work was supported by the National Natural Science Foundation of China (31570219), the Jiangsu Province Key Project for Scientific Research (16KJA180002), the Young Elite Scientists Sponsorship Program and Qing Lan project of Jiangsu Province, the State Key Laboratory of Paleobiology and Stratigraphy (Nanjing Institute of Geology and Paleontology, CAS), the Priority Academic Program Development of Jiangsu Higher Education Institutions, and the Australian Research Council.
Acknowledgments
The authors thank Ling Fang, Zhenhua Zhang, Lingxiao Yang, Ziheng Yang, Shaoyuan Wu, Mark Puttick, and David Penny for assistance with analyses. Lars Jermiin and anonymous reviewers provided constructive comments on the study.
