


Abstract
Survivorship following major mass extinctions may be associated with a decrease in body size—a phenomenon called the Lilliput Effect. Body size is a strong predictor of many life history traits (LHTs), and is known to influence demography and intrinsic biological processes. Pronounced changes in organismal size throughout Earth history are therefore likely to be associated with concomitant genome-wide changes in evolutionary rates. Here, we report pronounced heterogeneity in rates of molecular evolution (varying up to |$\sim$|20-fold) across a large-scale avian phylogenomic data set and show that nucleotide substitution rates are strongly correlated with body size and metabolic rate. We also identify potential body size reductions associated with the Cretaceous–Paleogene (K-Pg) transition, consistent with a Lilliput Effect in the wake of that mass extinction event. We posit that selection for reduced body size across the K-Pg extinction horizon may have resulted in transient increases in substitution rate along the deepest branches of the extant avian tree of life. This “hidden” rate acceleration may result in both strict and relaxed molecular clocks over-estimating the age of the avian crown group through the relationship between life history and demographic parameters that scale with molecular substitution rate. If reductions in body size (and/or selection for related demographic parameters like short generation times) are a common property of lineages surviving mass extinctions, this phenomenon may help resolve persistent divergence time debates across the tree of life. Furthermore, our results suggest that selection for certain LHTs may be associated with deterministic molecular evolutionary outcomes.
Resolving conflicts between estimates of clade ages derived from molecular divergence time analyses and the known fossil record is a persistent challenge of contemporary systematics. While discrepancies between molecular clock and fossil ages have been identified in many major clades (e.g., Metazoa: Fontanillas et al. 2007; Actinopterygii: Dornburg et al. 2014; Angiospermi: Beaulieu et al. 2015; Mammalia: Phillips 2015) a particularly controversial example involves the age of crown birds (Cracraft et al. 2015; Ksepka and Phillips 2015)—the most recent common ancestor (MRCA) of all living birds, and all of that ancestor’s descendants. This debate is compounded by the absence of fossils assignable to the stem lineages of the two deepest clades within crown birds, Paleognathae and Neognathae. As such, variable assignments of maximum age constraints have generated widely differing estimates for the age of crown birds (varying from <75 Ma (e.g., Prum et al. 2015) to >160 Ma (e.g., Cracraft et al. 2015); notably, more ancient than the |$\sim$|150 Ma stemward avialan Archaeopteryx lithographica). These varying estimates of the avian root age often influence age estimates of more exclusive descendent clades: older root age maxima tend to draw the radiation of the major subclade Neoaves into the Cretaceous (e.g., Jetz et al. 2012), thereby generating uncertainty about the role of the K-Pg mass extinction in shaping extant avian diversity. With little paleontological evidence to support the extensive radiation of crown birds in the Mesozoic, however, these estimates remain highly contentious (Mayr 2009).
While conflicts between “rocks and clocks” may be partially reconciled by many factors (e.g., morphological lag time, taxon sampling, data quality; see Supplementary Appendix S1 available on Dryad at http://dx.doi.org/10.5061/dryad.nr654 for detailed discussion), a mechanistic hypothesis for pervasive discrepancies between avian molecular divergence times and the fossil record is still wanting. Although the Mesozoic avian fossil record may be undersampled with respect to crown birds, this interpretation is unlikely to fully explain existing divergence time discrepancies. The Mesozoic fossil record of crownward stem birds argues against the up to |$\sim$|100 million-year missing fossil record advocated by unconstrained divergence time analyses without a maximum age prior on the root (Benton 1999; Cracraft et al. 2015), and generally supports a much younger estimate for the avian root age. Reconciling molecular divergence time estimates with the known crown bird fossil record thus suggests a hidden acceleration of the avian molecular clock at some point in avian evolutionary history (e.g., Alroy 1999; Benton 1999; Bromham 2003). However, a plausible mechanism for such an acceleration has yet to be articulated, casting doubt on this interpretation (Easteal 1999).
Mass extinction events have been characterized by marked reductions in body size among surviving lineages relative to their pre-extinction antecedents (Twitchett 2007). This phenomenon, known as the “Lilliput Effect” (Urbanek 1993) is difficult to observe directly in many clades (including birds) because it requires an exceptionally well-sampled fossil record immediately before and after an extinction event. The challenge is exaggerated when surviving lineages are predicted to be very small-bodied, and therefore subject to taphonomic bias against their preservation and discovery (Brown et al. 2013). Body size is correlated to a constellation of traits related to life history and demography, including generation length, population size, longevity, and metabolic rate (Simpson 1944; Western and Ssemakula 1982; Brown 1995; Roff 2002). As a result, pronounced changes in body size may be correlated with changes in rates of nucleotide substitution, an expectation that stems from the nearly neutral theory of molecular evolution (Kimura 1968; Ohta 1973; Nabholz et al. 2013; Figuet et al. 2016), as well as the metabolic theory of ecology (e.g., Brown et al. 2004; see Supplementary material available on Dryad for a detailed discussion). Invoking the Lilliput Effect as a hypothesis to explain a hidden period of increased substitution rates in a clade implies two general predictions: (i) that small body sizes are associated with faster substitution rates and (ii) that survivors of a mass extinction are characterized by reduced size relative to their pre-extinction relatives.
Here, we use simulations and ancestral reconstructions to address whether a “Lilliput Effect rate-process” among bird lineages surviving the K-Pg event could be contributing to enduring discrepancies between avian divergence time estimates derived from molecular sequence data and the crown group fossil record. First, we combine paleontological data with ancestral state reconstructions (ASR) to suggest that a pulse of body size reduction may have occurred early in the evolutionary history of the avian crown group, possibly associated with the K-Pg transition. We then re-examine the hypothesis that substitution rate variation in birds is related to life history trait (LHT) evolution (e.g., Nabholz et al. 2016). Drawing on our results, we propose that body size-related changes in LHTs associated with the K-Pg mass extinction led to substitution rate perturbations among surviving lineages. We suggest that observed increases in nucleotide substitution rates could be a result of dwarfing within surviving lineages (thereby inducing lineage-specific rate accelerations), and/or of size-biased extinction affecting the distribution of substitution rates among surviving lineages (thereby generating clade-wide effects).
To our knowledge, the present study is the first to detect significant and potentially independent effects of body size and metabolic rate on avian substitution rate while controlling for other life history variables. We illustrate the impact of our findings on divergence time estimation by demonstrating that the association between body size and LHT evolution can have a pronounced effect on estimates of the antiquity of avian clades. In addition to presenting a new biological hypothesis to reconcile the avian crown age debate, the results we report may have macroevolutionary implications relevant to studies of divergence times and diversification in the wake of mass extinctions in other clades across the tree of life.
Materials and Methods
Life History Correlations
Life history data were obtained from the AnAge senescence database Build 13 (De Magalhães and Costa 2009; Tacutu et al. 2013). We collated the following data: (i) age at sexual maturity (days), (ii) incubation time (days), (iii) number of eggs laid per year, (iv) mass at hatching (grams), (v) growth rate (1/days), (vi), maximum recorded longevity (years), and (vii) total metabolic rate (watts). For genera that were present in both Prum et al. (2015) and the AnAge database, we used average values per genus; otherwise we used family-level averages. Body mass (grams, species average) data were collected from Dunning Jr (1992). This yielded a data matrix with |$\sim$|49% missing data overall (with no missing data for body mass, Supplementary Table S1 available on Dryad).
We investigated correlations among LHTs and overall substitution rate using Coevol 1.4b, a Bayesian MCMC tool that estimates the correlation structure among the rate of molecular evolution and a set of quantitative traits. These parameters are jointly modeled as a multivariate Brownian process that incorporates evolutionary relationships (Lartillot and Poujol 2011; Lartillot and Delsuc 2012). A number of recent studies have investigated substitution rate processes such as dn/ds (e.g., Figuet et al. 2016) and kr/kc (e.g., Weber et al. 2014b), or mitochondrial rates (e.g., Nabholz et al. 2016); our analyses focus on the overall rate of nucleotide substitution in anchored enrichment loci (Lemmon et al. 2012; Prum et al. 2015).
We estimated correlations among log-transformed data in pairwise (i.e., one-to-one or marginal), and partial (i.e., controlling for all covariates) comparisons. We used the time-calibrated tree and sequence data from Prum et al. (2015) with fixed branch lengths, and the 10 data partitions exhibiting the lowest declines in phylogenetic informativeness (PI) (the “top-ten data set” described in Prum et al. (2015), representing a |$\sim$|41 kb sample of largely exonic nuclear sequence data). Using data filtered by PI ensures that results are minimally biased by saturation (Dornburg et al. 2014). The sequence data were modeled as a single concatenated data matrix, as Coevol 1.4b does not allow for the unlinking of data partitions. At least four independent replicates were compared for each analysis, and adequate sampling of the posterior was assessed by ensuring convergence and effective sample size (ESS) values >200.
Body Size Evolution
To investigate body size transitions early in the evolutionary history of crown birds, we compared reconstructions of early crown bird body sizes to end-Cretaceous body sizes of the crownward-most portion of the avian stem. First, we estimated mean body sizes for an assemblage of 18 crownward Cretaceous fossils found within 300 Ka of the K-Pg boundary [latest Maastrichtian (LM)]. These fossils provide a snapshot of avian (sensu lato) diversity immediately before the K-Pg mass extinction event, and constitute one of the most diverse Mesozoic avifaunas known (Longrich et al. 2011). We generated body mass estimates (and associated 95% prediction intervals) for the 18 ornithothoracine fossils comprising the Longrich et al. (2011) data set using updated predictive body mass equations for fossil birds (Field et al. 2013). The most precise osteological correlates of body mass were applied to each fossil, depending on which skeletal elements were preserved (see Supplementary material available on Dryad).
Measures of a clade’s central tendency can sometimes be misleading when used in phylogenetic comparisons (e.g., Felsenstein 1985). However, the relationships among the fragmentary Maastrichtian fossil taxa are largely unresolved (Longrich et al. 2011), which precludes directly incorporating information about their phylogeny into the present analysis. Instead, we used a model comparison approach (see Trait Evolution below). Ancestral body sizes within crown birds were estimated under a Brownian motion (BM) model in fitContinuousMCMC (Harmon et al. 2008) using the time-calibrated avian phylogeny from Prum et al. (2015) and data from sources described in the next section. We also compared these estimates to reconstructions conditioned on inferred rates of molecular evolution using Coevol 1.4b (see Trait Evolution and Fig. 1) that were generated as part of the analyses described in the previous section (e.g., Lartillot and Poujol 2011; Lartillot and Delsuc 2012).
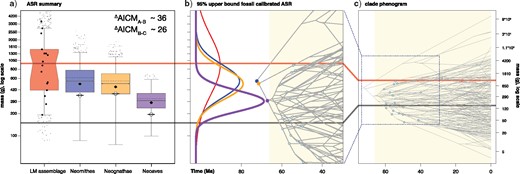
Avian body size evolution in association with the K-Pg boundary. a): Ancestral state reconstructions of body size for the three most inclusive nodes within crown birds, compared to the body size distribution of a fossil avifauna from the latest Maastrichtian (LM assemblage; Longrich et al. 2011). For the LM assemblage, a sample of outliers are indicated from a simulated normal distribution, while large black dots indicate mass point estimates for fossil taxa (Supplemental Fig. S4 available on Dryad). Dashed horizontal lines (black) within boxplots to the right of the LM assemblage indicate median posterior estimates from reconstructions excluding fossil body size priors; these are slightly larger than those from analyses directly incorporating fossils (using 95% upper bound priors; posterior distributions summarized by colored boxplots), suggesting that including fossil information increases the magnitude of inferred changes between the center of the LM assemblage and the reconstructions for early neornithine nodes. Median size estimates using 95% lower bound priors indicated by diamonds. Crossed circles indicate median size estimates conditioned on the correlation between rates of molecular evolution and body size, as inferred in Coevol 1.4b (Lartillot and Poujol 2011). The red horizontal line that passes through panels a–c) indicates the median value of the LM assemblage (|$\sim$|1 kg), and the dark grey horizontal line that passes through panels a–c) indicates the median mass of extant taxa in this data set (|$\sim$|150 g, somewhat larger than the median mass of extant Neornithes, |$\sim$|37 g). The depicted progression of body size reduction represents an improvement of up to 36 AICM units relative to a model that constrains the three deepest nodes to the mean LM estimate (|$^\Delta $|AICM|$_{\text{A-B}}\sim$|36). |$^\Delta $|AICM|$_{\text{B-C}}\sim$|26: an alternative model that enforces the Neornithes constraint. Boxplot colors match curves in panel b). b): Reconstructed body size changes in close association with the K-Pg boundary (Cenozoic indicated in pale yellow). On the left, the red curve indicates a normal distribution fit to the body size distribution of the LM assemblage. Blue, orange, and purple curves trace the posterior distributions estimated for body size of the three most inclusive nodes in the crown avian phylogeny (matched to their respective nodes with colored circles). Right side of panel b): zoomed-in “phenogram” of body size evolution (to compare with the full range of phenotype evolution displayed in panel c)). Pale blue dots indicate Cenozoic nodes calibrated by body size priors in this study.
Influence of Body Size on Divergence Time Estimates
We used multiple approaches to study the effect of body size and life history evolution on divergence time estimates. First, to simulate how different scenarios of size-biased extinction may influence molecular clock estimates of clade age, we performed simple divergence time analyses using BEAST 1.8.3 (Drummond et al. 2012). By using a prior rate estimate, we illustrate scenarios in which both relaxed and strict clocks that are unaware of life history evolution may generate clade age estimates that are systematically over- or underestimated. For these analyses, we generated three topological constraint trees by subsampling taxa from each of the seven major clades identified by Prum et al. (2015) (Paleognathae, Galloanserae, Strisores, Columbaves, Gruiformes, Aequorlitornithes, and Inopinaves). Four taxa were selected from each of these clades in each analysis; the four smallest in the clade, the four largest, and the four closest to median clade body size (Simulation A). We restricted our sampling to four taxa per subclade to minimize the number of overlapping taxa in the three topological constraints, and to ensure that node density artifacts would not bias our estimates of clade age (Hugall and Lee 2007).
We performed divergence time analyses on each of the size-partitioned data sets to generate three estimates of the avian root age. Using the taxon samples and topological constraints described above, we first estimated the age of the avian MRCA using a strict clock (clock.rate parameter) set to the mean rate of 0.0005 s/s/Ma inferred from the Prum et al. (2015) phylogeny, using the standard birth–death tree prior and GTR|$+\Gamma_{\mathrm{8}}$| substitution model. We then performed a similar analysis employing relaxed dating methods under an uncorrelated relaxed lognormal clock (Drummond et al. 2006) to allow for lineage-specific rate variation. The ucld.mean parameter was set to follow a normal distribution with mean of 0.0005 s/s/Ma and standard deviation of 0.0001.
Next, we investigated the sensitivity of molecular clock ages to life history-biased extinction for the major subclade Neoaves (for which the fossil record is consistent with a post K-Pg radiation). We repeated the above analyses for low, median, and heavy taxon partitions within major neoavian subclades. For these analyses, we included all available members from the sequential outgroups to Neoaves (Paleognathae and Galloanserae; Simulation B). This approach held the size–rate relationship constant in the two sister lineages to Neoaves, allowing us to evaluate how different scenarios of life history-biased extinction along the Neoaves stem group (which likely crossed the K-Pg boundary; Jarvis et al. 2014; Claramunt and Cracraft 2015; Prum et al. 2015) may be responsible for biasing previous estimates of the root age of Neoaves. Simulation B yielded median neoavian MRCA age estimates that were virtually identical to those of Simulation A, so they are presented as part of the Supplementary discussion available on Dryad (see Supplementary Fig. S7 available on Dryad).
To test the hypothesis that size reduction within surviving lineages accelerated the rate of molecular evolution along the deepest internodes within the crown bird tree, we sought to estimate avian divergence times while simultaneously accounting for the portion of the molecular clock that may be explained by life history evolution. To reduce the size of branch length parameter space, we set tight uniform priors (2 Ma intervals) derived from the median posterior age estimates from Prum et al. (2015) around the 19 nodes previously used for fossil-informed age constraints by Prum et al. (2015), and performed analyses with a birth-death speciation prior and the autocorrelated relaxed clock in Coevol 1.4b (Lartillot and Poujol 2011; Lartillot and Delsuc 2012). An uninformative gamma prior was applied to the root node (mean |$=$| 1000, SD |$=$| 1000). We performed sets of three analyses: (i) with no size or LHT data, (ii) including body size but no other LHT data, and (iii) including the full body size and LHT data matrix. We ran multiple independent MCMC chains for each comparison. We then compared estimates of the mean posterior age estimates of all nodes both with and without life history data. Despite lengthy attempts to reanalyze the avian evolutionary timescale in Coevol 1.4b to directly test for lineage-specific rate accelerations, these analyses failed to converge (see Supplementary discussion available on Dryad). Nevertheless, our correlational analyses allowed us to generate predictions of evolutionary body size changes across the K-Pg required to accommodate the molecular rate perturbations implied by the Prum et al. (2015) data set (see Trait Evolution).
Trait Evolution
To evaluate the choice of the BM model assumed in Coevol 1.4b (Lartillot and Poujol 2011; Lartillot and Delsuc 2012), we followed Slater et al. (2012) and compared four commonly used models of trait evolution using the “Bayesian fitContinuousMCMC” function in Geiger (Harmon et al. 2008). These models included BM, a single-optimum Ornstein–Uhlenbeck model (called SSP, for single stationary peak, in Geiger), and two variants of the early burst model described in (Harmon et al. 2010). The latter two models accommodate rapid character evolution near the clade MRCA, followed by a linear or exponential decrease in the rate of evolution. To increase the efficiency of the MCMC search, model proposal widths were iteratively tweaked until MCMC acceptance rates were between 25 and 75%. All chains were run until ESS values were >200. We also repeated this analysis using the maximum likelihood function “ace” in ape (Paradis et al. 2004).
To assess support for K-Pg-related body size reduction along the backbone of the crown bird phylogeny, we used an information theoretic approach (using the “fitContinuousMCMC” and “aicm” functions), implemented in Geiger (Harmon et al. 2008) to rank hypotheses of trait evolution using BM. In one model, we applied body size priors (using uniform priors) to the Neornithes, Neognathae, and Neoaves MRCA nodes to match our latest Maastricthian mean body size estimate. This model represents a scenario in which body size did not evolve along the neornithine backbone relative to the latest Maastricthian assemblage (Model A). In another model, we parameterized those nodes to match the median posterior estimates from an unconstrained BM model (Model B, a pseudo “null”). In a third model, we applied body size priors to the Neornithes, Neognathae, and Neoaves MRCA nodes to match the Neornithes MRCA estimate from an unconstrained BM model (Model C).
Integrating information from the fossil record into ASR increases reconstruction accuracy (Slater et al. 2012; Hsiang et al. 2015; Mitchell 2015). To improve our ASRs, we generated body mass priors derived from the set of 19 fossils used for time calibration points in Prum et al. (2015) and applied them to the calibrated nodes from that study. We generated priors by estimating body masses and associated 95% prediction intervals using the most precise osteological correlates of body mass given available measurements (see Supplementary Table S3 available on Dryad, Fig. 1; Field et al. 2013). For each fossil, we derived a mean and standard deviation to use as a normal prior in Geiger, assuming estimated upper or lower 95% prediction bounds are 1.96 standard deviations away from the mean. Because the 95% prediction intervals for these mass estimates are slightly asymmetric around the mean body size estimate (as size estimates cannot go below zero), we performed two alternative analyses using either the upper or lower bound priors, resulting in normal prior distributions (required by Geiger) that were either slightly wider (upper bound), or slightly narrower (lower bound).
Finally, while we acknowledge the well-explored difficulties of inferring accurate ancestral states for continuously varying traits (e.g., Webster and Purvis 2002), the accuracy of ASR has also been suggested to increase with increasing phylogenetic signal (see Fig. 2 in Litsios and Salamin 2012). Thus, we calculated phylogenetic signal (Pagel’s |$\lambda $|, Pagel 1999, Blomberg’s K, Blomberg et al. 2003) for body size using the “phylosig()” function in phytools (Revell 2012) and |$\alpha $| from an Ornstei-Uhlenbeck process (Hansen 1997) modeled using the “fitContinuous” function in Geiger (Harmon et al. 2008).
![Model of the inferred correlation structure among life history traits and overall rate of nucleotide substitution (from Coevol 1.4b, Lartillot and Delsuc 2012). Body mass and metabolic rate remain statistically significant in partial correlations. Each link represents a test of a statistical association between a life history parameter and overall nuclear substitution rate (following Lanfear et al. 2013a). Solid arrows indicate that the relationships are statistically significant (posterior probability $>0.95$ [positive relationship] or $<0.05$ [negative relationship]) in pairwise comparisons, while dashed arrows indicate nonsignificance. Solid borders indicate a significant relationship in a partial correlation (controlling for all other covariates) while dashed borders indicate nonsignificance. The colors range from red to blue, and are scaled by the magnitude of the inferred partial correlation coefficient, $r$ (red $=$ negative, blue $=$ positive). Correlation coefficients and associated posterior probability are reported in Supplementary Table S2 available on Dryad.](https://oup.silverchair-cdn.com/oup/backfile/Content_public/Journal/sysbio/67/1/10.1093_sysbio_syx064/2/m_syx064f2.jpeg?Expires=1716333135&Signature=ACDAoix86pL6WHK9PBF55b77YJEDXSDwlJGiuA~DasZgFXEkxBvDJx6ntYgIxvoP-LxmO5HOUwjN~loRZPpmFHTOEPDvXZucjtUxNoTXAyhO3uAE5QjrvQ8~lvhWwNW1nRmi2G-VCDfHffLBQVm0PD44kyV58L51FjLhYnw7ji2RFB2OtNeN3Y9fZ97kujSURpybn4Buppi997B4LsY-SBXP82eqN4yTRc6nUVJxYEZ50F0Pnuh66z7NiKLCAsfPoAngCCBsjkW5z8BRn0mdxsri3Rr3iKoZTaPLPeVzaJznFZ~PRGYdItvsF-NK2MG8zTGT36wfIwIplKJayYiDaw__&Key-Pair-Id=APKAIE5G5CRDK6RD3PGA)
Model of the inferred correlation structure among life history traits and overall rate of nucleotide substitution (from Coevol 1.4b, Lartillot and Delsuc 2012). Body mass and metabolic rate remain statistically significant in partial correlations. Each link represents a test of a statistical association between a life history parameter and overall nuclear substitution rate (following Lanfear et al. 2013a). Solid arrows indicate that the relationships are statistically significant (posterior probability |$>0.95$| [positive relationship] or |$<0.05$| [negative relationship]) in pairwise comparisons, while dashed arrows indicate nonsignificance. Solid borders indicate a significant relationship in a partial correlation (controlling for all other covariates) while dashed borders indicate nonsignificance. The colors range from red to blue, and are scaled by the magnitude of the inferred partial correlation coefficient, |$r$| (red |$=$| negative, blue |$=$| positive). Correlation coefficients and associated posterior probability are reported in Supplementary Table S2 available on Dryad.
Results
Substitution Rate Variation
For Bayesian uncorrelated-lognormal relaxed clock analyses in BEAST, a coefficient of variation (CoV) is recorded that provides information about how clock-like the underlying sequence data are. The CoV is defined as the clock’s standard deviation divided by the mean clock rate, and values below 0.1 are considered to be strong evidence for a strict clock (Drummond and Bouckaret 2015). Re-examination of the output from Prum et al. (2015) indicates a strong rejection of clock-like evolution (mean: 0.93, 95% HPD: 0.41–2.16), and suggests that, on average, lineages vary by |$\sim$|93% of the clock mean. Supplementary Figure 3 available on Dryad illustrates the median rates estimated for all branches, which vary by a factor of |$\sim$|20 in the Prum et al. (2015) BEAST analysis. While the estimation of uncorrelated clock rates is inherently uncertain (Lartillot et al. 2016), with wide, overlapping HPD (highest posterior density) intervals, examining rates inferred to fall within the fastest 2.5% and slowest 2.5% (dashed lines in Supplementary Fig. S3 available on Dryad) revealed clear body size associations.
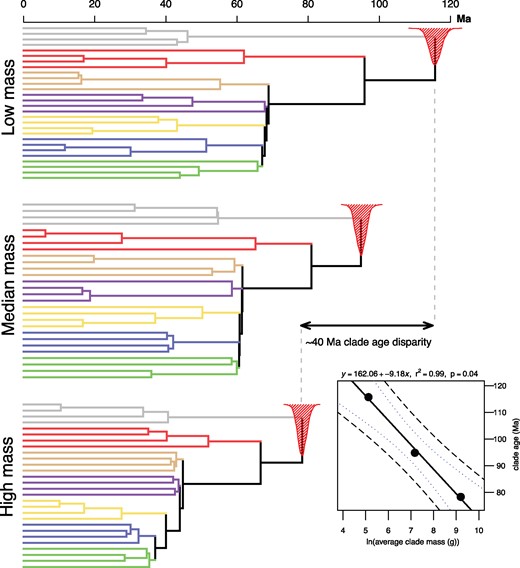
Simulations illustrating the influence of body size bias on molecular divergence time estimates. Strict molecular clock analyses of low mass, median mass, and high mass taxon samples for crown birds reveal that approximately |$\sim$|40 Ma of root age disparity can be explained by differences in substitution rate related to body mass alone (relaxed clock analyses described in the text generated similar results). These analyses imply that extinction of large-bodied taxa can contribute to error in estimates of divergence times by biasing the distribution of substitution rates represented by surviving lineages. The “low mass” taxon partition yields a median root age of 115.7 Ma, while “median” and “heavy” partitions yield estimates of 94.8 Ma and 78.3 Ma, respectively, with narrow, nonoverlapping HPD intervals. Regression analysis (inset) reveals that the relationship may be explained by a simple linear function (|$R^{\mathrm{2}} = 0.99$|, |$n = 3$|, |$P = 0.04$|). The fitted regression line through estimates of the clade MRCA uses the mean clade mass per simulation as a predictor. Also shown are 90% confidence and prediction (dashed lines) intervals. Shading reflects the major clades identified in Prum et al. 2015.
Life History Correlations
When examined in pairwise comparisons, all LHTs, except for total metabolic rate (pp|$\sim$|0.3, Supplementary Table S2 available on Dryad), were significantly correlated with overall substitution rate at almost maximal posterior probability (pp|$\sim$|1.0). Bayesian analyses do not require corrections for multiple hypothesis testing (Gelman et al. 2012). All LHTs were inferred to be correlated to each other at maximal posterior probability (Supplementary Fig. S6 available on Dryad). Including phylogeny in the model slightly reduced the average effect size (average |$R^{\mathrm{2}} = 0.33$|) under the available BM model of evolution, compared to uncorrected linear regressions (average |$R^{\mathrm{2}} = 0.40$|, all significant with Bonferroni correction).
Partial correlations (controlling for all other covariates) detected that substitution rate is inversely correlated with adult body mass, and positively correlated with metabolic rate (|$R^{\mathrm{2\thinspace }}=$| 0.1, pp|$=$| 0.97 and |$R^{\mathrm{2\thinspace }}=$| 0.2, pp|$=$| 0.96, respectively, Supplementary Table S2 available on Dryad). An additional analysis which allowed GC content to vary across lineages (-gc option in Coevol 1.4b; Lartillot and Delsuc 2012), while also controlling for metabolic rate, suggested that adult body mass may explain a substantial portion of the variance in overall substitution rate (partial mass |$R^{\mathrm{2}} = 0.45$|, pp|$=$| 0.99; partial metabolic rate |$R^{\mathrm{2}} = 0.22$|, pp|$=$| 0.91). We suggest this increase in |$R^{\mathrm{2}}$| may indicate that accounting for GC-biased gene conversion (e.g., Romiguier et al. 2010; Weber et al. 2014a) allows life history effects to explain more of the variance in substitution rate. Interestingly, Weber et al. (2014a) and Nabholz et al. (2013) also noted that patterns of GC content evolution in birds are consistent with body size reduction through time.
Body Size Evolution
We estimated mean body sizes for an assemblage of crownward bird fossils found within 300 Ka of the K-Pg boundary (LM). This assemblage constitutes the only described diverse avifauna constrained to sediments closely preceding the end-Cretaceous mass extinction (Longrich et al. 2011). We estimate the median body size within this avifauna to have been |$\sim$|959 g (mean |$=$| 1,380 g, Fig. 1a). This estimate greatly exceeds the mean (|$\sim$|300 g) and median (|$\sim$|37 g) body masses of extant crown group birds (Dunning Jr 1992). With the caveat that this result represents a preliminary effort to address the plausibility of avian body size change across the end-Cretaceous mass extinction event, this pattern is consistent with the hypothesis that crown birds and their closest stem group relatives may have been relatively large immediately preceding the K-Pg mass extinction. The LM fossil assemblage has intrinsic limitations, particularly regarding potential taphonomic and taxonomic biases (see our Supplementary material available on Dryad for a discussion of this topic); however, the apparently strong influence of inferred body size transitions on molecular divergence time analyses (see “Life History Correlations” and “Influence of Body Size on Divergence Time Estimates” below) render these results of interest, and should stimulate continued research on this subject.
For uncalibrated body size reconstructions, BM was preferred over the next best model by |$\sim$|80 AICM units (Raftery et al. 2006), and received 100% model weight (consistent with Harmon et al. 2010). Across models, absolute estimates of body size evolution between the neornithine, neognath, and neoavian MRCAs were nearly identical, suggesting that the observed pattern of size reduction leading to the neoavian MRCA is not driven solely by the assumptions of BM. Analyses that included body size priors based on Cenozoic crown bird fossils yielded very similar results (Fig. 1a). All models detected a trend of substantial size reduction (by almost an order of magnitude) relative to our estimate for the LM avifauna, followed by explosive body size evolution in the Paleocene (Fig. 1b,c).
For calibrated analyses using the set of priors based on the 95% upper bound fossil body mass, BM was again selected as the preferred model (|$^\Delta $|AIC |$\sim$|17, weight |$=$| 99.99%). The reconstructed states for the three deepest nodes within Neornithes were slightly smaller than those in ASR analyses without fossil calibrations, and became smaller still when using the tighter 95% lower bound mass priors (Fig. 1). The Neornithes MRCA (median) was reconstructed as |$\sim$|553 g in the upper bound fossil calibrated analysis (|$\sim$|617 g in uncalibrated), |$\sim$|50% smaller than our median body size estimate for the pre-K-Pg assemblage. The Neognathae MRCA and Neoaves MRCA exhibit additional |$\sim$|10% and |$\sim$|50% reductions in inferred body size from internode to internode (upper-bound fossil calibrated results: 553 g, 299 g, respectively; uncalibrated: 564 g, 339 g, respectively).
Intriguingly, Coevol ASRs, which are in effect calibrated by the inferred correlation between rate of molecular evolution and body mass (in this case, using the examined model with highest explanatory power, included body mass, metabolic rate, and GC variation, |$R^{\mathrm{2}} = 0.45$|, above), generated median posterior estimates of ancestral body masses that were substantially smaller than the LM estimate: Neornithes MRCA (352.75 g), Neognathae MRCA (372.45 g), Neoaves (195 g) (Fig. 1, Supplementary Fig. S8 available on Dryad). These estimates represent predictions of the ancestral body masses that would have been required to accommodate the high rates of molecular evolution implied by the Prum et al. (2015) phylogeny. Notably, the body mass estimate for the Neoaves MRCA is smaller than that inferred for all of the fossil taxa in the LM fossil assemblage, save one (|$\sim$|192 g estimated for Cimolopteryx minima, a crown-grade ornithurine; Longrich et al. 2011). When Coevol detects a statistically significant correlation between a trait and substitution rate, ASRs that do not accommodate this correlation can be statistically rejected (Lartillot, N., personal communication, Supplementary Fig. S8 available on Dryad). Coevol 1.4b, however, cannot combine normally distributed node-based trait priors with rate–trait relationships, so we could not conduct analyses that combined our fossil mass priors with this additional source of information.
Statistical support for body size reduction near the K-Pg boundary is strong across multiple analyses (see Fig. 1). For model A (LM constraint), the AICM |$=$| 1285; for model B (null), AICM |$=$| 1249; for model C (Neornithes constraint), AICM |$=$| 1259. Because the AICM scores for model B |$\ll$| Model C |$\ll$| Model A, we find that a model which accommodates substantial size reduction relative to the latest Maastricthian body size estimate, and size reduction along the neornithine backbone, represents a statistically significant improvement in model fit (|$^\Delta $|AICM|$_{\mathrm{A-B}}$||$\sim$|36, |$^\Delta $|AICM|$_{\mathrm{B-C\thinspace }}$||$\sim$|26 AICM). Trend model support for size reduction along the neornithine backbone was similar (e.g., |$^\Delta $|AICM|$_{\mathrm{B-C}}$||$\sim$|20). Additionally, body size exhibits significant (|$P$||$\ll$| 0.05) and high phylogenetic signal (|$\lambda = 0.93$|, |$K = 1.49$|, |$\alpha = 0.00$|) in our data set, further implying that our data are generally consistent with a BM model of evolution, and are perhaps phylogenetically conservative (|$K > 1$|, Losos 2008; Revell et al. 2008).
Influence of Body Size on Divergence Time Estimates
Simulations of different life history-biased extinction scenarios using sets of low, median, and high mass taxa with a strict clock set to the mean inferred rate of the Prum et al. (2015) analysis reveal that a difference of |$\sim$|37.5 Ma in estimated avian root age can be explained by differences in substitution rate related to body mass (Fig. 3). Our simple approach allowed us to generate three estimates of the neornithine MRCA age that represent the within-clade body size disparity of extant birds. Further, the observed discordance associated with estimates of clade age and average clade mass can be described by a simple linear function (|$n = 3$|, |$R^{\mathrm{2}} = 0.99$|, |$P = 0.04$|, clade age |$=$| 162.06–9.18(ln(average clade mass)). The “low mass” taxon partition yielded a median posterior root age of 115.7 Ma, while “median” and “heavy” partitions yielded estimates of 94.8 and 78.3 Ma, respectively, with narrow, nonoverlapping HPD intervals of 5–10 Ma (Fig. 3). Repeating these analyses with uncorrelated relaxed clocks generated the same pattern of median estimates (low |$=$| 125.3 Ma; median |$=$| 100.8 Ma; high |$=$| 81.6 Ma). As was the case for Neornithes, strict, and relaxed clock estimates for the root age of Neoaves revealed a striking association with body size, (e.g., strict clock: low |$=$| 68.9 Ma, median |$=$| 61.5, heavy |$=$| 44.8 Ma; Fig. 3 and Supplementary Fig. S7 available on Dryad).
In general, we suggest that median mass taxon partitions may represent more accurate estimates of divergence times, insomuch as they may be less likely to be biased by extreme rates of molecular evolution. However, we do not intend that the results (i.e., age estimates) of these analyses be interpreted strictly; they are intended to demonstrate the largely unexplored sensitivity of molecular clock estimates of clade age to evolutionary perturbations in life history traits.
Discussion
Our data strongly support the hypothesis that macroevolutionary fluctuations in avian body size may induce substantial changes in nucleotide substitution rates in birds (Martin and Palumbi 1993; Smith and Donoghue 2008), and confirm the hypothesis that smaller-bodied birds exhibit higher rates of nucleotide sequence evolution (e.g., Figuet et al. 2016; Nabholz et al. 2016). Thus, a hidden period of nucleotide substitution rate acceleration may be partly explained by selection for small body size closely associated with the K-Pg extinction event. We propose a Lilliput-rate-process as a mechanistic hypothesis to explain a portion of the “rocks and clocks” discrepancy in estimates of the avian crown age.
LHT Correlates of Total Substitution Rate in Birds
The present study illustrates how an underappreciated source of molecular clock error—life history’s connection to demography, and ultimately mutation rate—may have deterministic effects on substitution rates. In our analyses, body size and metabolic rate exhibited consistently significant associations with the rate of nucleotide evolution when other LHTs were controlled for. When controlling for body size, metabolic rate (BMR) is a measure of mass-specific metabolic rate, which scales inversely with body size (Reynolds and Lee 1996; McNab 2012), and may be positively and causally associated with mutation rate (Martin and Palumbi 1993; Mindell et al. 1996; Gillooly et al. 2005; 2007). Our analyses detect such a positive association (Fig. 2; see Supplementary material available on Dryad). Smaller bodied birds would also be subject to additive substitution rate effects induced by demographic processes (i.e., shorter generation time, and in the context of the K-Pg, reduced population size). The negative association we observe between substitution rate and body size in partial correlations may be indicative of such a demographic signal. Thus, the present work may represent the first illustration of independent effects of body size and metabolic rate on avian substitution rate. Finally, because the anchored enrichment data used in this analysis may include some sites evolving non-neutrally (Lemmon et al. 2012), we suggest that our results may be conservative, as selection (acting in different directions) affecting the rate of molecular evolution is less clearly correlated with life history evolution (Martin and Palumbi 1993; Smith and Donoghue 2008).
Substitution Rate Variation
Our reanalyses of the Prum et al. (2015) data set suggest that a model with |$\sim 20\times$| rate heterogeneity is required to describe genomic rate variation across the avian tree of life (Supplementary Figs. S1 and S2 available on Dryad; also, see Supplementary discussion available on Dryad on the Niobrara Formation-informed crown prior). Among the branches falling within the fastest 1% are those leading to tinamous (Tinamidae), Neoaves (at least the stem of which likely crosses the K-Pg), swifts (Apodidae), and perching birds (Passeriformes), while those falling within the slowest 1% include the branches leading to Ciconiiformes (storks and kin), Cathartidae (New World vultures), and Procellariiformes (tubenoses). This pattern is consistent with branch length estimates derived from the classic DNA–DNA hybridization studies of Sibley and Ahlquist (1990); the fastest (99th rate percentile) represents lineages that include extant taxa that are generally small and short lived, while the opposite is true for the lineages found in the 1st percentile.
Our analysis also corroborates prior findings (e.g., Baker et al. 2007; Hackett et al. 2008) of an extremely long branch length (extremely fast substitution rate) for the lineage leading to Turnix, the cause of which has yet to be fully understood. The inferred pace of molecular evolution in Turnix is so extreme that it is unlikely to be due to life history evolution alone—this question merits further investigation.
Notably, we infer the stem lineage leading to the generally large-bodied Paleognathae (the sister group to all other birds, which likely crosses the K-Pg boundary), to exhibit a rate falling above the fastest 2.5 percentile of branch rates across the entire avian phylogeny. In the context of the present study, this result implies that the early ancestors of crown Paleognathae that survived the K-Pg extinction were small-bodied (and probably volant, Faux and Field 2017), with molecular evolutionary rates like those of ancestral tinamous or neoavians (this has recently been independently corroborated with paleogenomic approaches, see: Mitchell et al. 2014; Yonezawa et al. 2016).
Yonezawa et al. (2016) report an ancestral paleognath MRCA size of 3.8–5.5 kg; our analyses infer an ancestor that is smaller (Coevol: |$\sim$|2.9 kg, Supplementary Fig. S8 available on Dryad). Notably, Yonezawa et al. (2016) suggest that the young age (|$\sim$|50 Ma) inferred for crown Paleognathae in Prum et al. (2015) relative to other studies may be due to incorrect rooting; instead, we suggest that it may be a result of convergent molecular rate decelerations experienced among large flightless ratites. This result has important implications for the study of Paleognathae macroevolution and biogeography that are beyond the scope of the present work. However, evidence that the paleognath stem lineage may be among the fastest evolving lineages in the avian tree (because of ancestrally small body size) supports the hypothesis that prior molecular clock age estimates for the Neornithes MRCA may be upwardly biased.
Convergent evolution of extremely large size in several paleognath lineages during the Cenozoic (Mitchell et al. 2014; Yonezawa et al. 2016) likely biases ASRs against the hypothesis of a small bodied paleognath ancestor, and will make it difficult to test such hypotheses without presently elusive fossil corroboration. If the ancestral paleognath was indeed small (perhaps even smaller than our estimates), our illustration of size reduction along deep neornithine internodes may be correspondingly inflated. However, such a scenario would still support the underlying hypothesis that lineages evolving at fast rates towards the base of the neornithine phylogeny are at least partly responsible for driving age overestimations. Clearer constraints on the antiquity of the various paleognath subclades—as well as a timeline of independent body size increases among ratites—await the discovery and accurate phylogenetic interpretation of additional paleognath fossils.
Using Molecular Clocks to Estimate the Antiquity of the Avian Crown
Reconciling clade ages estimated from the fossil record and molecular clocks is critical for testing hypotheses linking major events in Earth history with patterns of biological diversification (e.g., Claramunt and Cracraft 2015), as well as any model-based phylogenetic comparative analyses which use branch length information (e.g., Jetz et al. 2012). For example, rejecting an association between the explosive radiation of Neoaves and the mass extinction of nonavian dinosaurs at the K-Pg boundary demands that methodological artifacts cannot explain the discrepancy between molecular clocks and the fossil record. The degree to which size-biased extinction and/or lineage-specific rate accelerations may contribute to clade age overestimations remains an open question. Our linear equation from Figure 3 suggests that a decrease in “average clade size” of |$\sim$|1.3 kg to |$\sim$|250 g along the neornithine backbone could induce a clade age increase of |$\sim$|15 Ma (although we emphasize that this is a rough estimate). Therefore, pulsed selection against large body size in the context of the K-Pg event could explain rate increases among surviving lineages.
Further, the inclusion of appropriately parameterized crown group fossil time-calibrations are predicted to alleviate–but not eliminate–this source of bias, as they are generally applied with hard minimum and (critically) infinite maximum ages that allow age estimates to be pushed farther back in cases of substitution rate accelerations. Worryingly, if strongly elevated substitution rates driven by selection for reduced body size across the K-Pg boundary did indeed take place, even the most sophisticated relaxed clock methods currently available will likely fail to detect them. Further complicating the problem for birds, as previously stated, is the fact that there are presently no fossils that can be used to directly calibrate the minimum ages of the Paleognathae, Neognathae, or Neoaves stem lineages, or the age of the Neornithes MRCA. To accommodate this problem, Prum et al. (2015) employed an informative but soft-bound prior on the root of Neornithes, reflecting the conspicuous absence of avian crown group fossils in the Late Cretaceous Niobrara Formation. This deposit has produced hundreds of crownward stem bird fossils, and reflects the complete absence of any known crown birds from the entirety of the Mesozoic until |$\sim$|67 Ma across all environments and continents. Applying this prior compresses the age of the neornithine MRCA by |$\sim$|30 Ma, and induces high-substitution rates at the base of the tree (see Supplementary discussion available on Dryad).
Phillips (2015) provides an argument in favor of using such “appropriately conservative” priors in the face of pronounced age overestimates relative to the fossil record. We note here as well that such a calibration choice may be justified when three lines of evidence are satisfied: (i) an observation of extreme branch length extension incompatible with the fossil record, (ii) evidence of a correlation between life history and substitution rate, and (iii) evidence of consistent patterns of life history evolution occurring across relevant nodes. We suggest that all three of these points are satisfied in the case of crown group birds. Future investigation of these patterns will require the additional development and refinement of tools for the simultaneous estimation of divergence times, substitution rates, and their relationship with LHTs under different character and relaxed clock models (e.g., Lartillot et al. 2016).
The Lilliput Effect
The pervasiveness of the Lilliput Effect as a macroevolutionary phenomenon associated with mass extinction events has been questioned (Brayard et al. 2010; Huang et al. 2010). However, considering the expected difficulty of directly observing evidence of the Lilliput Effect in crown bird fossils flanking the K-Pg mass extinction boundary, the present lack of fossil evidence directly informing avian body size change cannot be used to reject the possibility of a marked filtering of body sizes among avian survivors of the extinction event. Given the apparently profound influence of the K-Pg mass extinction on crownward representatives of the avian stem group (Longrich et al. 2011), as well as the striking selection against large body size among many surviving lineages (McKinney 1990; Van Valen 1994; Archibald 1996; Wilson 2013), avian survivors may have been subject both to strong ecological selection for reduced body size and marked population size reductions in the immediate wake of the extinction event (e.g., Friedman 2009; Sallan and Galimberti 2015). Increased rates of nucleotide substitution are also predicted to be associated with reduced population size (e.g., Lanfear et al. 2013b). Indeed, the conspicuous rarity of fossil birds in the immediate aftermath of the K-Pg (Mayr 2009) may be jointly explained by reduced population sizes (Hull et al. 2015) and the diminished preservation potential of smaller survivors (Brown et al. 2013).
We suggest that spuriously ancient molecular divergence time estimates may be explained either by the selective extinction of relatively large-bodied taxa across an extinction horizon, and/or by size reduction of surviving lineages following a mass extinction event. We propose that both mechanisms can lead to accelerations in the rate of molecular evolution that manifest as branch length artifacts. The observation of pronounced molecular clock age overestimates relative to the fossil record in the context of the K-Pg mass extinction may therefore indicate a telltale genomic signature of the Lilliput Effect in birds and other extant clades that crossed the K-Pg boundary.
Macrogenetic Evolution
Considering our results, we can speculate that if the K-Pg acted as a LHT filter favoring relatively small survivors, the explosive post-K-Pg diversification of crown Neoaves into newly vacant niche space may have been promoted by high genetic diversity generated by rapid rates of molecular evolution in surviving lineages. Similarly, the net rate of diversification in birds appears to be correlated to rates of molecular evolution (Lanfear et al. 2010). As noted by Jablonski (2008): “...small body sizes might increase sensitivity to geographic barriers and thus promote speciation even as accompanying large population sizes decrease species-extinction probability.” The nature of the relationships among life history strategies, genetic diversity, and evolutionary rates implies that a lineage’s adaptive potential in the face of marked environmental perturbations may be mediated by these interactions (Simpson 1944; Lee et al. 2013; Benson et al. 2014; Romiguier et al. 2014).
Our analyses also suggest that the cataclysmic K-Pg transition may have driven a rapid reduction of body size among ancestral crown bird lineages, following the protracted reduction in body size among progressively crownward dinosaurs throughout the Mesozoic (Brusatte et al. 2014; Lee et al. 2014; Puttick et al. 2014). Historical contingencies resulting in mass extinction and faunal body size change, like the Chicxulub asteroid impact (Alvarez et al. 1980), may therefore lead to deterministic macroevolutionary outcomes, such as pronounced changes in molecular substitution rates via associations with LHTs. Phenotypic convergence (or life history-biased extinction) toward reduced body size among lineages surviving a mass extinction may consequently result in convergent molecular substitution rate accelerations.
As hunting and habitat destruction have disproportionately affected large taxa in the Anthropocene (Duncan et al. 2002; Jablonski 2004), will the impact of human activity parallel the effects of the K-Pg transition on avian evolution? Larger-bodied species have a demonstrably higher risk of extinction than small species (Gaston and Blackburn 1995; Faurby and Svenning 2016), and populations of hundreds of bird species have declined precipitously despite conservation efforts (Barnosky et al. 2011; McLellan et al. 2014). Indeed, the fact that numerous large-bodied avian clades (e.g., Dromornithidae, Teratornithidae, Sylviornithidae, Aptornithidae, Aepyornithidae) have been lost throughout the Holocene implies that the diversity of birds available to sample today is biased toward smaller taxa exhibiting faster average rates of molecular evolution relative to avian diversity merely thousands of years ago. The extent to which selection for demographic and life history traits across mass extinction boundaries influences rates of molecular evolution represents an important area of future macroevolutionary investigation in many clades. Such work may reveal fundamental insights into how, and when, Earth’s modern biodiversity arose.
Supplementary Material
Data available from the Dryad Digital Repository: http://dx.doi.org/10.5061/dryad.nr654.
Funding
This research was supported by a National Science Foundation Graduate Research Fellowship and Doctoral Dissertation Improvement Grant [DGE-1650441, DEB-1700786 to J.S.B.]; National Sciences and Engineering Council of Canada Graduate Scholarship to D.J.F.; and Cornell Laboratory of Ornithology Athena Grant to to J.S.B. DJF is supported by a 50th Anniversary Prize Fellowship at the University of Bath.
Acknowledgments
The research was aided by discussions with I. Lovette, R. O. Prum, J. R. Shipley, L. Campagna, D. Toews, E. Miller, N. Hofmeister, N. Mason, A. Lees, C. Edwards, J. Lewis, J. Gauthier, L. Arcila Hernández, E. Funk, P. Donoghue, R. Benson, A. Farris, A. McCune, A. Agrawal, N. Lartillot, and we are especially thankful to A. Dornburg for helpful comments and analytical suggestions. We are grateful to Simon Ho, Michael S.Y. Lee, and an anonymous reviewer for comments that substantially improved this article. Analyses were performed at the Yale University Biomedical High Performance Computing Center, supported by NIH grants RR19895 and RR029676-01. J.S.B. and D.J.F. designed and performed the research and contributed equally to the article.
References
Author notes
Jacob S. Berv and Daniel J. Field contributed equally to this work.
Associate Editor: Simon Ho
