


Abstract
There is increasing use of transcriptional profiling in hepatotoxicity studies in the rat. Understanding hepatic gene expression changes over time is critical, since tissue collection may occur throughout the day. Furthermore, when comparing results from different data sets, times of dosing and tissue collection may vary. Circadian effects on the mouse hepatic transcriptome have been well documented. However, limited reports exist for the rat. In one study approximately 7% of the hepatic genes showed a diurnal expression pattern in a comparison of rat liver samples collected during the day versus livers collected at night. The results of a second study comparing rat liver samples collected at multiple time points over a circadian day suggest only minimal variation of the hepatic transcriptome. We studied temporal hepatic gene expression in 48 untreated F344/N rats using both approaches employed in these previous studies. Statistical analysis of microarray (SAM) identified differential expression in day/night comparisons, but was less sensitive for liver samples collected at multiple times of day. However, a Fourier analysis identified numerous periodically expressed genes in these samples including period genes, clock genes, clock-controlled genes, and genes involved in metabolic pathways. Furthermore, rhythms in gene expression were identified for several circadian genes not previously reported in the rat liver. Transcript levels for twenty genes involved in circadian and metabolic pathways were confirmed using quantitative RT-PCR. The results of this study demonstrate a prominent circadian rhythm in gene expression in the rat that is a critical factor in planning toxicogenomic experiments.
The existence of a circadian rhythm associated with the light-dark cycle is found across the phylogenetic spectrum from microorganisms to humans (Devlin and Kay, 2001). In mammals the central regulator of the cycle or “master clock” is located in the suprachiasmatic nucleus (SCN) of the hypothalamus and is entrained directly by the light dark/cycle through the retinohypothalmic tract (Devlin and Kay, 2001; Reppert and Weaver, 2001). The functioning of the clock on the molecular level is the result of interacting positive and negative transcriptional–translational feedback loops that govern the cyclic expression of specific clock genes (Meyer-Bernstein and Sehgal, 2001; Reppert and Weaver, 2001). The products of the clock genes are transcription factors that drive the cyclic expression of other “clock-controlled” genes. Since some of the clock-controlled genes also encode transcription factors, the expression of a substantial number of genes may thus be tied to the daily rhythm of the molecular clock.
Many peripheral tissues exhibit tissue-specific rhythms regulated by many of the same clock genes and transcriptional feedback loops as the master clock of the SCN. However, many of the clock-controlled genes are specific to each tissue and, thus, likely linked to the physiological function of the individual tissue.
The daily profile of gene expression in the mouse liver is strongly influenced by the circadian cycle (Akhtar et al., 2002; Duffield, 2003; Panda et al., 2002; Storch et al., 2002; Ueda et al., 2002). The circadian cycling of the rat transcriptome has not been studied as extensively as that of the mouse. In comparing across studies, it is often useful to use circadian time (CT), where CT0 represents light on and CT12 represents light off in a 12-h light-on/12-h light-off study. Kita et al. (2002) compared the transcript profile of the livers of Dahl salt-sensitive rats collected 12 h apart (2 h after light on and 2 h after light off or CT2 and CT14) to maximize the possibility of detecting genes whose transcript levels vary over the circadian interval. They found diurnal differences of expression in approximately 7% of the genes on their microarray (Kita et al., 2002). Many of the transcripts exhibited a ten-fold expression differential between night and day including known period genes (Kita et al., 2002). In contrast, Desai et al. compared the transcript profile of livers from 1-year-old F344 rats sampled at four time points (4 and 9 h after light on [CT4 and CT9] and 3 and 9 h after light off [CT15 and CT21]) to a pooled control consisting of equal portions of transcripts from each of the four collection times. In their analysis, they identified only two genes that exhibited greater than a two-fold difference in expression over the period examined, and for most genes the expression differences were less than 1.5-fold (Desai et al., 2004). Surprisingly, circadian genes were not identified as differentially expressed in this study (Desai et al., 2004). Because of the difference in animal models and study design, it is not possible to determine the basis for the differing results obtained by Kita and Desai. Since the rat remains the dominant model system for drug discovery, toxicology, and pharmacokinetic studies, we felt it was important to resolve the apparent discrepancy between the two studies.
To accomplish this objective we have used microarrays to perform direct day/night 12-h offset comparisons of rat hepatic transcripts similar to the design of Kita et al. (2002) and also compared transcripts from livers collected at different times of day (CT4, CT10, CT16, CT22) against a universal control similar to the design of Desai et al. (2004). These studies were done with young F344 rats, a common model for toxicology evaluations. Quantitative RT-PCR (qRT-PCR) was used to verify the expression level for selected genes involved in circadian and metabolic pathways.
Our results indicate that the circadian cycle has a significant effect on the rat hepatic transcriptome. Additionally, by qRT-PCR we demonstrate marked gene expression differences across a 6-h period during the day, a common period for tissue collections in toxicology studies. Further, we identify differential expression for several circadian genes not previously reported in the rat liver. These results have important implications for the design and interpretation of rat toxicogenomic studies as well as a better understanding of the circadian gene expression in the rat liver.
MATERIALS AND METHODS
Animals and study design.
Male Fischer 344 rats approximately 36 ± 3 days old were supplied by Taconic laboratory animals (Germantown, NY) and were approximately 90 days old when used for this study. The rats were housed three per cage in polycarbonate cages with the details of the animal care and housing described previously (Boorman et al., 2005). NTP-2000 open formula (Rao et al., 2001) pelleted diet (Ziegler Brothers, Inc., Gardners, PA) was available ad libitum, except during the day of the experiment when the feed was removed when the lights came on. The study design included twenty-four rats sacrificed in groups of six at four time points (4 and 10 h after light on, CT4, CT10, and 4 and 10 h after light off, CT16 and CT22). To accomplish this, the study was divided into two lighting (acclimated for two weeks prior to study start) groups: the rats in the day group had a 12-h light period from 8 A.M. to 8 P.M., while the rats in the light reversal group had a 12-h light period from 8 P.M. to 8 A.M. Both serum melatonin levels and gene expression patterns indicate that the rats were acclimated to the light/dark cycle (Boorman et al., 2005). The entire study was replicated, resulting in a total of 48 animals for the two replicates combined. The study was approved by Battelle's Institute Animal Care and Use Committee and was conducted in accordance with the guide for the care and use of laboratory animals (ILAR, 1996).
Animal-handling procedures during the dark were accomplished under a dim red light (<0.2 lux with a wavelength of greater than 650 nm). The rats from the dark were moved to the necropsy area in a cage covered by a hood, and the necropsies took place within 1 h. The rats from the day groups were kept in a cage until necropsy.
RNA isolation.
The left hepatic lobe was cut into 0.5-cm cubes or smaller and immersed in RNALater® (Ambion, Austin, TX) within 4 min of necropsy. The tissues were stored in RNALater® overnight at 4 ± 3°C, then stored at −20 ± 1°C until RNA isolation (within 60 days). Details of the RNA isolation procedures have been previous published (Boorman et al., 2005). Briefly, the RNA samples were frozen at −70°C and shipped to the National Toxicology Program (NTP) repository until transfer to Paradigm Array Labs (Icoria, Inc., RTP, NC) for microarray analysis. RNA was isolated from the twelve individual rats at each of four time points (CT4, CT10, CT16, CT22) and was used for microarray and qRT-PCR. In addition, equal amounts of RNA from six rats were used to form two composite pools at each time point for pooled comparisons.
Microarray hybridizations.
One μg of total RNA from either an individual rat or from a pooled sample was amplified and labeled with a fluorescent dye (either Cy3 or Cy5) using the Low RNA Input Linear Amplification Labeling kit (Agilent Technologies, Palo Alto, CA) following the manufacturer's protocol. The amount and quality of the resulting fluorescently labeled cRNA was assessed using a Nanodrop ND-100 spectrophometer and an Agilent Bioanalyzer. Equal amounts of Cy3- or Cy5-labeled cRNA were hybridized to the Agilent Rat Oligo Microarray (Agilent Technologies, Inc., Palo Alto, CA) for 17 h, prior to washing and scanning. Data was extracted from the resulting images using Agilent's Feature Extraction Software (Agilent Technologies, Inc., Palo Alto, CA). For day/night comparison, hepatic RNA samples from three individual day rats collected 10 h after light on (CT10) were hybridized against a pooled RNA sample composed of equal amounts of RNA from the livers of six night rats collected 10 h after lights off (CT22); and RNA samples from three individual night rats collected at CT22 were hybridized against a pooled RNA sample composed of equal amounts of RNA from the livers of six day rats collected at CT10. For each comparison a dye reversal hybridization was also performed. This was replicated in a second study for a total of 24 hybridizations of 12 h offset samples for the CT10/CT22 times only.
In a second comparison, two pools of RNA from the livers of six rats collected at each of four different times of the circadian day (CT4, CT10, C16, and CT22) were hybridized against a Universal Rat Reference RNA Standard (Stratagene, La Jolla, CA).
Quantitative reverse transcription polymerase chain reaction (qRT-PCR) analysis of gene expression.
Quantitative reverse transcription polymerase chain reaction (qRT-PCR) was performed on hepatic RNA samples from six individual rats randomly selected from twelve rats at each of the four time points. Since the selection was random, there was some but not complete overlap with the rats used in the microarray studies. In addition, qRT-PCR was performed on the same pools of RNA (n = 8) used in the microarray hybridizations. This resulted in eight qRT-PCR measurements (six individuals and two pools) for each gene at each time point. The qRT-PCR reactions were performed in duplicate.
RNA was reversed transcribed into first strand cDNA using the High-Capacity cDNA Archive kit (Applied Biosystems, Foster City, CA). For each sample, 2.5 μg RNA in volume of 50 μl was combined with an equal volume of the 2× RT Master-Mix (Applied Biosystems, Foster City, CA), containing random primers, dNTP mixture, and Multiscribe RT enzyme in 96-well reaction plate. The plate was incubated for 10 min at 25°C and then at 37°C for 2 h in a 9700 ABI Thermocycler. The cDNA was stored at −20°C until further use. The cDNA was amplified using primer and probe sets (more details in Supplementary Data) from Assays on Demand (Applied Biosystems, Foster City, CA) on an ABI 7900 Sequence Detection System (Applied Biosystems, Foster City CA). Universal Master-Mix (Applied Biosystems, Foster City, CA) with the specified Taqman® Primer Probe set was added to each well on a 384-well reaction plate (Table 1, Taqman Primer Probe sets). Fifty ng of each cDNA was added to the master mix for a final volume of 20 μl. The samples were amplified by incubation for 2 min at 50°C, then 10 min at 95°C, followed by 40 cycles of 95°C for 15 s and 60°C for 1 min. SDS Software version 2.1 and Microsoft Excel software were used for analysis of the resulting data. Automatic threshold values were used, and expression of each gene was normalized to Rpl18, a rat housekeeping gene, at each time point. The expression of Rpl18 did not vary significantly across the four time points studied (ANOVA; p > 0.05). The coefficient of variation across all four times was 1.9%. The t-test, assuming unequal variances, was used to assess differences between time points for the qRT-PCR data.
Genes Selected for Quantitative Reverse Transcription Polymerase Chain Reaction (qRT-PCR) Analysis
Gene Symbol | Gene name | Accession Number | ||
|---|---|---|---|---|
| Circadian or diurnal genes | ||||
| Mt3 | Metallothionein 3 | NM_053968 | ||
| Mt1a | Metallothionein 1a | NM_138826 | ||
| Dbp | D site albumin promoter | NM_012543 | ||
| Per2 | Period homolog 2 | NM_031678 | ||
| CLOCK | Clock gene | NM_021856 | ||
| Cry2 | Cryptochrome 2 (photolyase-like) | NM_133405 | ||
| Bhlhb2 | Basic helix–loop–helix domain containing, Class 2B (Dec1) | NM_053328 | ||
| Bhlhb3 | Basic helix–loop–helix domain containing, Class 3B (Dec2) | NM_133303 | ||
| Usp2 | Ubiquitin specific protease 2 | NM_053774 | ||
| Arntl | Aryl hydrocarbon receptor nuclear translocator-like (Bmal1) | NM_024362 | ||
| Avpr1a | Arginine vasopressin receptor 1A | NM_053019 | ||
| Nr1d1 | Nuclear receptor subfamily 1, group D, member 1 (Rev erb alpha) | NM_145775 | ||
| Cholesterol/fatty acid metabolism genes | ||||
| Amacr | Alpha methylacyl-CoA racemase | NM_012816 | ||
| Cpt1a | Carnitine palmitoyltransferase 1, liver | NM_031559 | ||
| Fasn | Fatty acid synthase | NM_017332 | ||
| rELO2 | Fatty acid elongase 2 | NM_134383 | ||
| Hao3 | Hydroxyacid oxidase 3 | NM_032082 | ||
| Bdh | 3-Hydroxybutyrate dehydrogenase (heart, mitochondrial) | NM_053995 | ||
| Chk | Choline kinase | NM_017127 | ||
| Fdps | Farensyl diphosphate synthase | NM_031840 | ||
| Housekeeping gene | ||||
| Rpl18 | Ribosomal protein L 18 | NM_031102 | ||
Note. Additional information on qRT-PCR in Supplementary Data.
Analyses of microarray data.
Data from dye reversal hybridizations representing the same individual (day/night 12-h offset hybridizations) or pools (time of day hybridizations against the universal reference) were combined in the microarray analysis software package Rosetta Resolver version 4.0.0.1.1 (Rosetta Biosoftware, Seattle, WA) using an error-weighted average. For the individual rats in the 12-h offset comparisons, the two replicate experiments were first evaluated separately. Supervised analysis to find genes associated with circadian rhythm was performed using Significance Analysis of Microarrays (SAM) (Tusher et al., 2001). For each replicate the two-class (light vs. night), unpaired comparison was used, and the SAM false discovery rate (FDR) was set as less than or equal to 1%. Genes identified as differentially expressed in both experiments were combined to form the 12-h offset list. The multi-class unpaired method of SAM was used to identify genes whose expression differed significantly among pooled samples collected across the four time points (CT4, 10, 16, and 22). Hierarchical clustering was performed with CLUSTER and visualized with TREEVIEW (Eisen et al., 1998).
The estimated cycle time (T) was set to 24 h for all experiments, and τ represents the time increment of a single experiment. The first difference in our implementation is the estimation of an offset of cycle time. The offset value (ϕ in Eqs. 1–2) was previously used to estimate variability due to synchronization of the cell cycle; however, this factor is not appropriate in our experiment, and ϕ was set to 0 for all analyses. Calculation of the periodicity score was performed after weighting D by the maximal correlation with one of six representations of circadian or metabolic cycle. This weighting is performed because many of the genes do not perfectly match with sine or cosine curves. The six vectors used for this weighting correspond to the expression values of Per1, Per2, Fasn, Avpr1a, Slc22a5, and Bhlhb3. The final step of Whitfield et al. (2002) consisted of an autocorrelation calculation to remove genes that did not show consistent cycling across multiple rounds of the cell cycle. Our data prohibited this calculation, because data was collected for a single 24-h cycle. Genes were selected when the resulting periodicity score was greater than 1.5 SD above the mean.
RESULTS
Identification of Circadian Genes from Microarray Data
We performed two replicate experiments in which RNA from individual rat livers was hybridized against a pool of RNA from rat livers whose collection was offset by 12 h. Thus for each replicate, cRNA from individual day rats was hybridized against cRNA generated from pooled night rats, and cRNA from individual night rats was hybridized against cRNA generated from pooled day rats. We analyzed each replicate separately for differentially expressed genes and selected those genes exhibiting day/night variation in both replicates.
SAM analysis (1% FDR) of replicate number one identified 799 genes with increased expression during the night and 679 genes with decreased nighttime expression for a total of 1478 (7.3% of the genes on the array) genes whose expression exhibited a day/night difference. A similar analysis of the replicate study identified 1607 (867 increased and 740 decreased) genes (7.9% of the genes on the array). There were 972 (4.8%) differentially expressed genes (470 increased, 502 decreased) common to both replicates, and these are shown in decreasing order of expression level (Fig. 1). The list includes clock genes, clock-controlled genes, as well as genes involved with normal intermediary metabolism. We found 102 genes in common with the 597 genes identified in the Kita study (Kita et al., 2002).
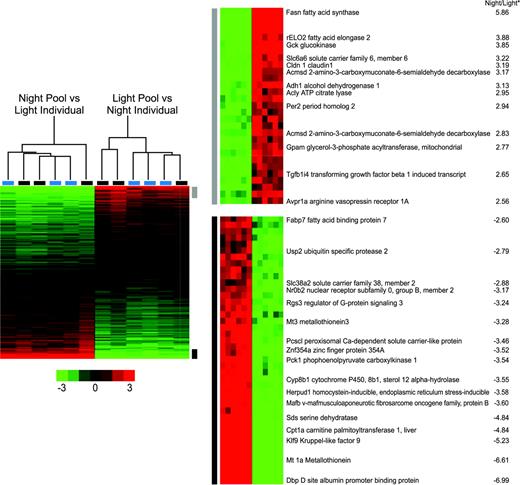
Dendogram of twelve rats using genes from the two independent experiments. The genes shown were significant in both experiment 1 and experiment 2 (SAM FDR < 1%, 973 genes). The increased expression is shown in red, while decreased expression is shown in green. The individual rats are clustered at the top left, with experiment 1 indicated by blue bars and experiment 2 by black bars for the individual rats. The most differentially expressed genes are shown on the right with the corresponding change. *Repeated scores are average fold change (log2(Night/Light)).
Not unexpectedly, genes with relative increased nighttime expression include fatty acid elongase 2, fatty acid synthase, glucokinase, and other genes involved in metabolism (available in the Supplementary Data). Circadian genes that show increased nighttime expression include Per2. Two circadian output genes, D site albumin promoter binding protein (Dbp) and ubiquitin specific protease 2 (Usp2), show relative decreased nighttime expression.
Similar to the Desai et al. study (2004), RNA from the livers of six rats collected at each time point (CT4, CT10, CT16, and CT22) was pooled, (with two replicates at each time) and hybridized against a common reference standard. While Desai et al. used a pool of all sixteen rats as a reference, in the present study a universal rat reference standard was used. Using SAM multi-class analysis and a 1% FDR, no genes were identified whose expression differed significantly across the four times examined. Even at a SAM FDR of 25%, only 57 genes were identified as significantly different across the four time points.
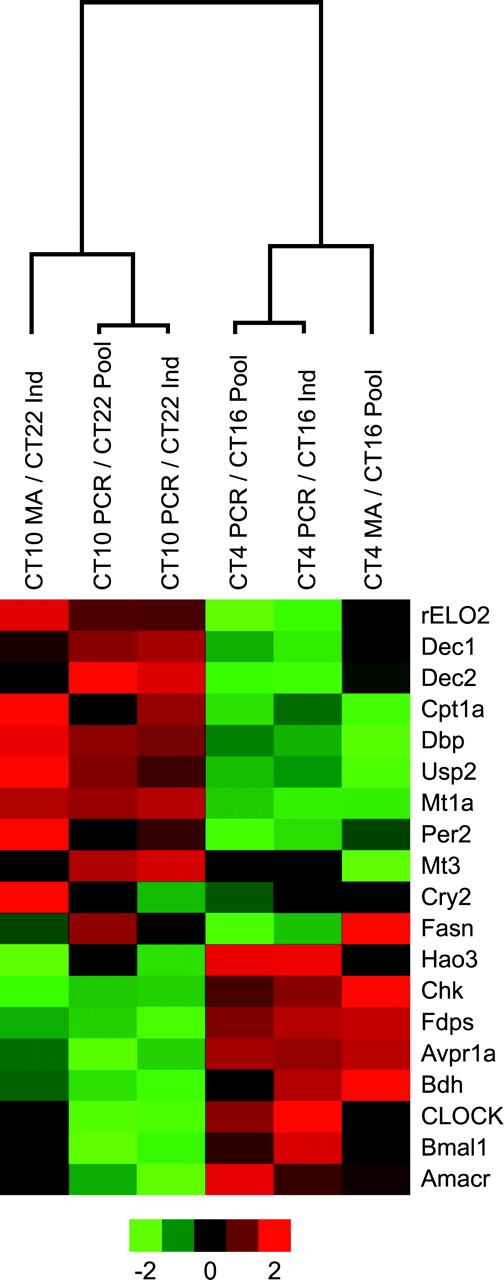
These results and those of Desai (Desai et al., 2004) suggest that the use of ANOVA-based methods are unsuited for analyzing transcript levels that follow a cyclic expression over time. We therefore applied the Fourier Transform approach used by Whitfield et al. (2002) to the common reference data to identify genes periodically expressed over a 24-h cycle. This analysis identified 1300 transcripts (6% of the genes on our array) whose levels varied periodically over the circadian cycle. There were 200 genes in common with the 12-h offset list, and numerous circadian genes were found (Fig. 2). The small amount of overlap between the two results is expected, since we used SAM to identify highly significant differences between a single day and night time point, while the Fourier approach identifies periodicity of expression over the four time points based on relative expression. The difference in the SAM approach and the Fourier Transform approach is presented in the Discussion.
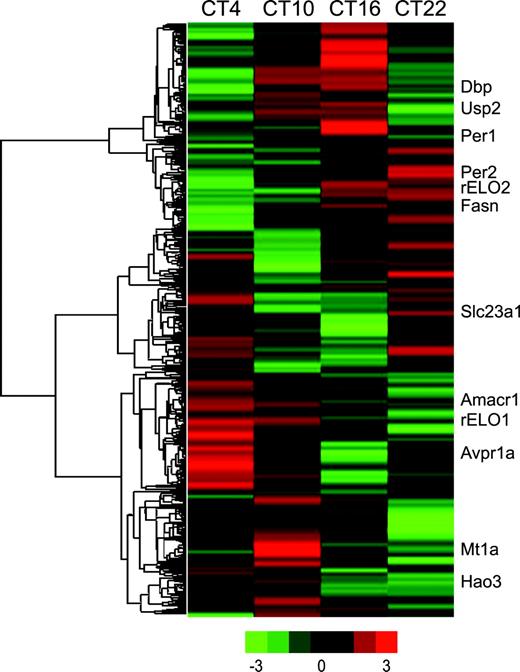
Heat maps of eight pools of six rats hybridized to an external RNA reference. The group times are listed at the top of the figure, and increased expression is shown in red, while decreased expression is in green. Nearly 1300 genes were identified as differentially expressed using Fourier transform analysis approach. Some of the known circadian and metabolic genes are shown on the right.
qRT-PCR Analysis of Selected Transcripts
Quantitative RT-PCR (qRT-PCR) was used to verify transcript levels of selected circadian and metabolic genes in livers from six individual rats and two pooled samples at each time point. Differentially expressed circadian and metabolic genes from the microarray data and additional circadian genes not on the microarray were selected for qRT-PCR analysis (Table 1).
There was little variability in the qRT-PCR replicate analysis and excellent correlation between qRT-PCR results from the pooled samples and the six individual animals selected at random from the pools. The majority of circadian (Fig. 3) and metabolic (Fig. 4) transcripts predicted to follow a diurnal pattern from microarray data were shown by qRT-PCR to vary across the four time points examined. Of particular interest was the observation that Clock expression that has been reported to be stable in the SCN over the circadian day, decreased from CT4 to CT 10 in the rat liver.
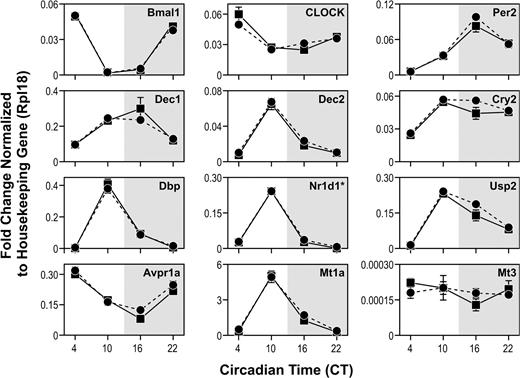
Graphic presentation of qRT-PCR reactions for nine circadian and other genes, showing expression levels at four times of day. The solid lines are mean values of six rats (±SE), while the dotted lines are from two pools of six rats at each time (±SE). Each assay was run in duplicate.
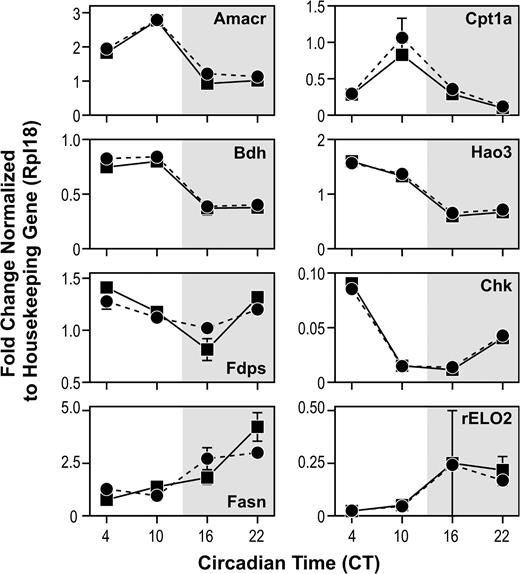
Graphic presentation of eight genes from metabolic pathways showing expression levels at four times of day. The solid lines are mean values of six rats (±SE) while the dotted lines are from two pools of six rats at each time (±SE). Each assay was run in duplicate, except for the pooled samples of rELO2 at CT16, where two qRT-PCR reactions failed, resulting in a larger confidence interval. Since the estimated mean rELO2 expression for both the pooled and individual samples were similar at CT16 and very precise for the other three time points, the pooled analysis for this one time point was not repeated.
The qRT-PCR results give a more complete picture of the gene expression than the day/night comparison between CT10 and CT22. Hepatic expression of many of the circadian genes rises during the day to peak either late in the day (Dec2, Dbp, Rev erb alpha, and Usp2) or early evening (Per2, Dec1, and Cry2). With the exception of fatty acid synthase (Fig. 4), the magnitude of changes in transcript levels for most genes involved in metabolic pathways was less than that observed for most of the circadian genes.
Genes coding for enzymes involved in lipogenesis (fatty acid elongation) and cholesterol synthesis (fatty acid synthase) were up-regulated during the dark phase (CT16 and CT22) when animals are actively feeding. During the light phase (CT4 and CT10), genes associated with fatty acid oxidation (Cpt1a) and β-oxidation (Amacr), were up-regulated as well as genes associated with processing of stored energy (Hao3 and Bdh), (see Supplementary Data for a more complete list of metabolic genes that were differentially expressed). Furthermore, there is excellent concordance of the experimental measurements generated from microarray and qRT-PCR (Fig. 5).
A dendogram of pooled and individual samples using qRT-PCR and microarray results for eight pools hybridized to an external RNA reference. Fold changes were collapsed by averaging for all experiments in a group. A group was defined by sampling protocol (pool or individual (ind)), measurement technology (microarray or qRT-PCR), and CT comparison (CT4/CT16 or CT10/CT22). The fold changes for each group were then log transformed and standardized (μ = 0, σ = 1). The increased expression is shown in red, while decreased expression is in green.
DISCUSSION
In the present study, we have examined the apparent discrepancy in diurnal hepatic gene expression in the rat as reported by Kita et al. (2002) and Desai et al. (2004). Kita et al. identified a diurnal pattern for many circadian and genes associated with metabolism by comparing livers collected from rats during the day with liver samples collected 12 h later in the dark (Kita et al., 2002). We found approximately 102 genes in common with Kita et al. despite using different platforms with different gene probe content and different animal models. This overlap is comparable to that found between mouse liver circadian gene expression studies, where between 124 and 144 differentially expressed genes were common between any two mouse studies (Duffield, 2003; Panda et al., 2002; Storch et al., 2002; Ueda et al., 2002).
Importantly we observed patterns of expression for genes involved in both the circadian cycle and normal metabolic pathways similar to Kita et al. (2002). Common circadian genes included Arntl (or Bmal1), Period 1 and Period homolog 2, plus three circadian output genes including D site albumin binding protein (Dbp), arginine vasopressin receptor 1A (Avpr1a), and ubiquitin specific protease 2 (Usp2). Genes in metabolic pathways that showed increased expression at night include fatty acid synthase, fatty acid elongase 2, and glucokinase as would be expected for nocturnal feeders. The similarities between the present study and that of Kita is not unexpected, since comparing gene expression between livers whose collection is offset by 12 h is more likely to identify the extremes of differential gene expression (Akhtar et al., 2002).
Comparing gene expression from tissues collected at multiple time points against a common control provides a better indication of the pattern of expression over the circadian day but is less sensitive because of not directly comparing the extremes of gene expression (Akhtar et al., 2002). Desai et al. collected livers from four rats at four times and hybridized individual rats against a pool comprised of all 16 rats (Desai et al., 2004). A rat oligonucleotide array with 3096 known genes was used, and 67 genes were found to be significant in one of two tests (it should be noted that 59 significant genes are expected with the null hypothesis at the level of significance that was used). Unexpectedly, no circadian genes appeared in their list. In part, this may have been due to sample size, or as shown in this study, the ANOVA method used by Desai is not the most sensitive approach for determining periodicity in gene expression.
In the current study, we hybridized RNA from eight pools to a commercially available universal reference sample. The four time points (CT4, CT10, CT16, CT22) are similar to the time points (CT4, CT9, CT15, CT21) from the Desai et al. study. Using SAM analysis, we had to use a 25% FDR to identify 57 significant genes, a result not unlike the findings of Desai et al. (2004).
The limited findings in both experiments may be due to the choice of analysis method. SAM analysis in this study and the Desai (Desai et al., 2004) analysis are ANOVA-based methods that appear to be less sensitive for detecting cyclic rhythms in gene expression. Additionally, the ANOVA methods are limited in that the increased number of dependent variables, or groups, requires a larger sample size relative to the 12-h offset analysis (only two groups). Therefore, the limited samples available in both this study and the Desai et al. study resulted in limited results with high false discovery rates when using variants of the ANOVA method.
Although limited sample size effecting statistical power is one problem, a more important issue is that the question asked by ANOVA methods is not appropriate when looking for cyclic patterns. ANOVA methods look for genes with low variability within a group and high variability across groups. This ignores our knowledge of the ordering of groups across time, and that trends or cycles exist over time. Fourier transform methods are fast, efficient approaches to decomposition of time series data to identify these embedded rhythms (Straume, 2004). This approach has been used to analyze blood pressure data that shows a characteristic rise and fall during the day (Rodda et al., 1996), to identify genes periodically expressed in the cell cycle (Whitfield et al., 2002), and for assessment of circadian rhythms (Ceriani et al., 2002; Panda et al., 2002). When we implemented this method for finding cyclic patterns, we were able to identify 1300 differentially expressed genes including many of the canonical circadian genes. This indicates that the minimal results in Desai's experiment and our multi-class SAM analysis may not be due to limited data, but a result of the method of analysis.
We felt it was important to evaluate diurnal patterns in the rat because of the differences between and the limitations of the Kita et al. and Desai et al. studies. The Kita et al. study involved only a total of 10 Dahl salt-sensitive rats, six of which had been fasted (Kita et al., 2002). The Dahl salt-sensitive rat is not a common model for toxicology studies nor are 1-year-old rats as used in the Desai et al. study (Desai et al., 2004). In the current study, we used 12-week-old F344/N rats and repeated the study. Replicate experiments with twelve rats at each time help limit the impact of technical and individual animal variability, providing greater confidence in the results.
Using qRT-PCR, we evaluated transcript levels of Dec1, Dec2, Per2, and Cry2 whose products provide both positive and negative feedback on the circadian cycle. By both microarray and qRT-PCR analyses, Dec1 and Dec2 showed higher expression at CT10 than CT22, with Dec1 peaking at CT16. Dec1 and Dec2 are increased during the day in the mouse SCN (Honma et al., 2002). In contrast to the present study, rat hepatic Dec1 and Dec2 expression were reported to be higher at night by both Northern blot analysis and by qRT-PCR (Noshiro et al., 2004). One possible explanation for the difference between the studies is that in the present study the rats were acclimated for 2 weeks prior to study start with acclimation to the light/dark cycle confirmed by assessing melatonin levels (Boorman et al., 2005). Noshiro et al. (2004) acclimated rats for 3 days, but it takes approximately a week to set the circadian cycle of the liver (Schibler et al., 2003).
We found Per2 expression rising during the day and peaking at CT16 using qRT-PCR. Our Per2 gene expression data are consistent with other rodent liver analyses (Akhtar et al., 2002; Kita et al., 2002; Oishi et al., 2003; Storch et al., 2002; Ueda et al., 2002). We also found Cry2 expression rising during the day, with a plateau from CT10 to CT22. To our knowledge, rhythmic gene expression pattern for Cry2 has not been reported before in the rodent liver.
The importance of circadian genes for the study of liver toxicity is their impact on daily oscillations in liver function and responses to xenobiotics. The protein product of clock-controlled genes in turn act as transcription factors for the many genes that are crucial for liver function, including genes involved in xenobiotic metabolism (Oishi et al., 2003; Reppert and Weaver, 2002).
Clock and Bmal1 protein products form a heterodimer that is the transcriptional driver for the circadian cycle (Maywood et al., 2003). Bmal1 but not Clock was identified in our microarray data as differentially expressed. The qRT-PCR data show highest Bmal1 levels at CT4, lowest levels at CT10, with expression rising during the dark consistent with other rodent liver data (Akhtar et al., 2002; Kita et al., 2002; Oishi et al., 2003; Storch et al., 2002; Ueda et al., 2002). Clock mRNA levels do not oscillate in the suprachiasmatic nuclei (Dunlap, 1999; Reppert and Weaver, 2001) or liver (Duffield, 2003). Thus the difference in Clock gene expression between CT4 and CT10 was unexpected (see Fig. 3). Twelve qRT-PCR reactions from six individual animals were performed at each time, and the differences between CT4 and CT10 were highly significant (p < 0.001). A review of our microarray data also showed the highest Clock expression at CT4; however Clock was not identified as differentially expressed, because it did not meet our fold change criteria. Variation in Clock expression has not been reported previously in the rat or the mouse liver to our knowledge.
Microarray technology is a powerful tool for identifying the multitude of genes with varying expression over time (Duffield, 2003; Reppert and Weaver, 2002). In the present study, we demonstrated that the rat transcriptome exhibits significant circadian variation in expression. The qRT-PCR and microarray data show a marked difference in gene expression in livers collected 6 h apart during the light period of the circadian day. It will be critical to consider these daily gene variations in both the dosing and collection of tissues for toxicogenomic studies. It appears that time is an important potential confounder, and we suggest that light/dark cycles, food accessibility, dosing times, and collection times of tissues/biofluids need to be part of the supporting data for all toxicogenomic studies.
The authors acknowledge support of the National Center for Toxicogenomics NIEHS, who established and manage the microarray contract, the Battelle Columbus staff, who performed the in-life phase of the study and RNA isolation, the Investigational Genomics Group at Paradigm Array Labs (Icoria, Inc.), who performed the microarray hybridizations, and Sue Edelstein, Image Associates, Inc., who designed and prepared the figures. NIEHS (NIH-ES-35513) supported the qRT-PCR analyses. This project has been funded in part with Federal funds from the National Institute of Environmental Health Sciences, National Institute of Health, under Contract No. NO1-ES-25497.
References
Akhtar, R. A., Reddy, A. B., Maywood, E. S., Clayton, J. D., King, V. M., Smith, A. G., Gant, T. W., Hastings, M. H., and Kyriacou, C. P. (
Boorman, G. A., Irwin, R. D., Vallant, M., Gerken, D. K., Lobenhofer, E. K., Hejtmancik, M., Hurban, P., Brys, A., Travlos, G., Parker, J., et al. (
Ceriani, M. F., Hogenesch, J. B., Yanovsky, M., Panda, S., Straume, M., and Kay, S. A. (
Desai, V. G., Moland, C. L., Branham, W. S., Delongchamp, R. R., Fang, H., Duffy, P. H., Peterson, C. A., Beggs, M. L., and Fusco, J. C. (
Duffield, G. E. (
Eisen, M. B., Spellman, P. T., Brown, P. O., and Botstein, D. (
Honma, S., Kawamoto, T., Takagi, Y., Fujimoto, K., Sato, F., Noshiro, M., Kato, Y., and Honma, K. I. (
ILAR (
Kita, Y., Shiozawa, M., Jin, W., Majewski, R. R., Besharse, J. C., Greene, A. S., and Jacob, H. J. (
Maywood, E. S., O'Brien, J. A., and Hastings, M. H. (
Meyer-Bernstein, E. L., and Sehgal, A. (
Noshiro, M., Kawamoto, T., Furukawa, M., Fujimoto, K., Yoshida, Y., Sasabe, E., Tsutsumi, S., Hamada, T., Honma, S., Honma, K. I., et al. (
Oishi, K., Miyazaki, K., Kadota, K., Kikuno, R., Nagase, T., Atsumi, G., Ohkura, N., Azama, T., Mesaki, M., Yukimasa, S., et al. (
Panda, S., Antoch, M. P., Miller, B. H., Su, A. I., Schook, A. B., Straume, M., Schultz, P. G., Kay, S. A., Takahashi, J. S., and Hogenesch, J. B. (
Rao, G. N., Morris, R. W., and Seely, J. C. (
Reppert, S. M., and Weaver, D. R. (
Reppert, S. M., and Weaver, D. R. (
Rodda, B., Hajian, G., Tsai, K. T., Mellars, L., and Capece, L. (
Schibler, U., Ripperger, J., and Brown, S. A. (
Storch, K. F., Lipan, O., Leykin, I., Viswanathan, N., Davis, F. C., Wong, W. H., and Weitz, C. J. (
Straume, M. (
Tusher, V. G., Tibshirani, R., and Chu, G. (
Ueda, H. R., Chen, W., Adachi, A., Wakamatsu, H., Hayashi, S., Takasugi, T., Nagano, M., Nakahama, K., Suzuki, Y., Sugano, S., et al. (
Author notes
*Environmental Toxicology Program, National Institute of Environmental Health Sciences, Research Triangle Park, North Carolina 27709; †Integrated Laboratory Systems, Inc., Research Triangle Park, North Carolina 27709; ‡Constella Group, Inc., Research Triangle Park, North Carolina 27709; §Paradigm Array Labs, A service unit of Icoria, Inc., Research Triangle Park, North Carolina 27709; and ¶Battelle Science and Technology International, Columbus, Ohio, 43201

Comments