-
PDF
- Split View
-
Views
-
Cite
Cite
Seva E. Kostrubsky, Jacqueline F. Sinclair, Stephen C. Strom, Sheryl Wood, Ellen Urda, Donna Beer Stolz, Yuan H. Wen, Shaila Kulkarni, Abdul Mutlib, Phenobarbital and Phenytoin Increased Acetaminophen Hepatotoxicity Due to Inhibition of UDP-Glucuronosyltransferases in Cultured Human Hepatocytes, Toxicological Sciences, Volume 87, Issue 1, September 2005, Pages 146–155, https://doi.org/10.1093/toxsci/kfi211
Close - Share Icon Share
Abstract
Here we present a preclinical model to assess drug–drug interactions due to inhibition of glucuronidation. Treatment with the antiepileptics phenobarbital (PB) or phenytoin (PH) has been associated with increased incidence of acetaminophen (APAP) hepatotoxicity in patients. In human hepatocytes, we found that the toxicity of APAP (5 mM) was increased by simultaneous treatment with phenobarbital (2 mM) or phenytoin (0.2 mM). In contrast, pretreatment with PB for 48 h prior to APAP treatment did not increase APAP toxicity unless both drugs were present simultaneously. Cells treated with APAP in combination with PB or PH experienced decreases in protein synthesis as early as 1 h, ultrastructural changes by 24 h, and release of liver enzymes by 48 h. Toxicity correlated with inhibition of APAP glucuronidation. PB or PH also inhibited APAP glucuronidation in rat and human liver microsomes and expressed human UGT1A6, 1A9, and 2B15. As with intact hepatocytes, PB and PH were neither hydroxylated nor glucuronidated, suggesting the direct inhibition of UGTs. Our findings suggest that, in multiple drug therapy, an inhibitory complex between UGT and one of the drugs can lead to decreased glucuronidation and increased systemic exposure and toxicity of a coadministered drug.
The potential for drug–drug interactions is difficult to assess during drug development. Inhibition of metabolism of a coadministered drug and/or inhibition of active transport mechanism involved in drug elimination may result in increased intraorgan drug concentration and toxicity. It would be beneficial if potential toxic outcomes from treatment with common comedications and a new drug could be assessed in a preclinical model for potential of affecting mutual metabolism, transport, and toxicity. Previously, we have characterized the model of human sandwich-cultured hepatocytes for evaluation of the effect of drugs on hepatobiliary transport (Kostrubsky et al., 2003). Here we present another model of human hepatocytes to investigate acute drug–drug interaction resulting in inhibition of glucuronidation leading to hepatotoxicity. UDP-glucuronyl transferases (UGTs) have a high capacity to conjugate xenobiotics, yet are subject to inhibition that may result in clinical manifestations. Inhibition of UGT1A1 has been reported to be responsible for increases in unconjugated bilirubin observed in 49% of patients treated with atazanavir sulfate, an HIV-1 protease inhibitor (Busti et al., 2004; product insert). Human population with a hereditary UGT1A1 deficiency (Gilbert's syndrome), estimated as 3–7% prevalence in the total population, is characterized by decreased transport and bilirubin glucuronidation. People with Gilbert's syndrome form a heterogeneous group, where some individuals also have lower glucuronidation capacity of acetaminophen (APAP) (Rodriguez and Regadera, 1999). This population may represent a group at high risk for development of toxicity from any medications that are primarily glucuronidated and administered in high doses. Coadministration of a potential inhibitor of UGT, such as phenobarbital, described in this study, would result in high systemic exposure to these medications and could lead to toxicity. Deficiencies in expression of UGT1A are responsible for APAP toxicity observed in Gunn rats and cats (Court and Greenblatt, 1997; de Morais et al., 1992). Potentiation of APAP toxicity by antiepileptic therapeutics including phenobarbital (PB) and phenytoin (PH) may be responsible for hepatotoxicity reported in some patients treated with combination of these drugs (Bray et al., 1992; Lystbaek and Norregaard, 1995; Minton et al., 1988; Pirotte, 1984). In a controlled crossover study, pretreatment of human volunteers with 3 mg/kg of PB for 5 days increased formation of the glutathione adduct of APAP (Mitchell et al., 1974), suggesting that PB induced CYP-mediated APAP metabolism. However, acute potentiation of APAP toxicity was reported in mice administered a single dose of phenobarbital just 1 h before administration of APAP (Douidar and Ahmed, 1987). Hepatotoxicity was associated with decreased glucuronidation of APAP (Douidar and Ahmed, 1987). Here, we used cultured human hepatocytes to investigate if inhibition of UGTs and toxicity can be interrelated and thereby predict the potential for clinical effects. We investigated whether acute exposure to PB or PH would potentiate APAP toxicity due to inhibition of APAP glucuronidation. We found that both PB and PH enhanced APAP toxicity associated with inhibition of UGT-mediated metabolism of APAP. Toxicity could be detected as early as 1 h after treatment with the combination of drugs and progressed over 48 h. These data in cultured hepatocytes correlated with kinetics of inhibition of APAP glucuronidation by PB and PH in microsomal systems. Thus, cultured human hepatocytes can be used for early screening of drug–drug interactions to evaluate for UGT inhibition and potential toxicities.
MATERIALS AND METHODS
Chemicals.
HMM (modified Williams E) culture medium and supplements were from BioWhittaker (Walkersville, MD). Pooled human liver microsomes (Lot HL-Mix-101, 20.4 mg/ml) and recombinant UDP-glucuronosyltransferases (UGTs) 1A1, 1A4, 1A6, 1A8, 1A9, 1A10, 2B4, 2B7, 2B15, and 2B17 were purchased from BD Gentest (Woburn, MA). All recombinant UGTs were expressed using baculovirus-infected Sf-9 insect cells with a final concentration of 5 mg/ml. Control and induced rat microsomes were from Xenotech (Kansas City, KS). APAP, Uridine 5′-diphosphoglucuronic acid (UDPGA), NADPH, MgCl2, and alamethicin were purchased from Sigma-Aldrich (St. Louis, MO). Metabolites standards of APAP were prepared according to previously published methods (Mutlib et al., 2000). HPLC-grade water, methanol, and acetonitrile were purchased from Mallinckrodt Chemicals (Phillipsburg, NJ). All general solvents and reagents were of the highest grade commercially available.
Hepatocyte cultures and treatment protocol.
Human hepatocytes were isolated from livers not used for whole-organ transplant. Hepatocytes were isolated by three-step collagenase perfusion as described previously (Strom et al., 1996). The viability of cells obtained, as measured by trypan blue exclusion test, ranged from 74 to 90%. Hepatocytes were plated in Williams E medium supplemented with 10−7 M dexamethasone, 10−7 M insulin, 100 Units/ml of penicillin G, 100 μg/ml of streptomycin, and 10% bovine calf serum. Hepatocytes (2 × 10⁶/well) were plated on 6-well culture plates previously coated with type I (rat-tail) collagen. Cells were allowed to attach for 4–6 h in 37°C, at which time the medium was replaced with serum-free medium with the supplements listed above and changed every 24 h thereafter. After 72 h in culture, cells were treated with either APAP alone or in combination with PB or PH for 1–48 h, as described in figure legends. Some cells were pretreated with 2 mM PB for 48 h prior to addition of APAP to induce CYP. This culture condition maintains the sufficient level of Phase I and Phase II drug metabolizing activities in hepatocytes after 96 h in culture, as we demonstrated for several substrates (Kostrubsky et al., 2000; Wen et al., 2002). At the same time, incubation for 96 h minimizes the difference between activities in control cells prepared from different donors due to decreased basal expression of enzymes (Kostrubsky et al., 1999).
Toxicity and other assays.
Toxicity was determined by the measurement of total protein synthesis by pulse-labeling hepatocytes for 1 h with 14C-leucine, as described previously (Kostrubsky et al., 1997). In addition, ALT, AST, and LDH were measured in aliquots of culture medium using a Vitros analyzer. Ultrastructural changes were evaluated in cells fixed with a 3% gluteraldehyde and processed for electron microscopy. Immunochemical determination of UGTs was conducted using 5 μg of rat liver microsomes and rat anti-liver antibody (RAL) (1:2500 dilution) recognizing multiple isoforms from UGT1A and UGT2B families (Cummings et al., 2003), originated from the laboratory of Dr. Brian Burchell (University of Dundee, Dundee, UK).
Liquid chromatography mass spectrometry (LC/MS) analysis of APAP metabolites in human hepatocyte media and cell lysates.
Aliquots (200 μl) of media and cell lysates obtained by acetonitrile protein precipitation were spiked with the internal standard (acetanilide) and analyzed by LC/MS without any further sample preparation. An aliquot (10 μl) from each sample was injected directly onto an HPLC column (Aqua C18, 150 × 2.0 mm, Phenomenex) coupled to an API 4000 mass spectrometer (Applied Biosystems/MDS SCIEX, Ontario, Canada), equipped with a TurboIonSpray® source held at 275°C. The electrospray needle was maintained at 4600 V with the declustering and exit potentials set at 46 and 10 V, respectively. Ultrapure nitrogen was used as the nebulizer and curtain gas. The mass spectrometer was operated in full scan (100–1000 amu) or multiple reaction monitoring (MRM) modes for qualitative and quantitative analyses, respectively. MRM analysis was carried out using nitrogen as the collision gas. The collision energy was kept at 25 eV. Other parameter settings for the MRM analyses included arbitrary values of 6, 25, 40, and 40 for collision (CAD), curtain, nebulizer, and turbo gases, respectively. The mass transitions for the metabolites and the internal standard were: 136 → 94 (acetanilide, internal standard), 232 → 152 (sulfate conjugate), 271 → 140 (cysteine conjugate), 328 → 152 (glucuronide conjugate), 328 → 182 (cysteinylglycine conjugate), and 457 → 328 (glutathione conjugate). The peak areas from each of these transitions were obtained, and ratio of the analytes to the internal standard was obtained for each sample. The identities of the metabolites were confirmed by comparing the retention times and MS/MS data with authentic standards (Mutlib et al., 2000). The metabolites of APAP were separated on the HPLC column using a gradient solvent system consisting of acetonitrile and 0.1% formic acid with the flow rate set at 0.3 ml/min. The initial conditions consisted of a mixture of acetonitrile and 0.1% formic acid (4:96 v/v) and were maintained for 3 min after the sample was injected. The percentage of acetonitrile was increased linearly from 3% to 90% in the next 17 min. After an additional 5 min at 90% acetonitrile, the column was reequilibrated with the initial mobile phase for 10 min before the next injection. Aliquots from the hepatocyte incubations were injected directly onto the HPLC column, and the eluant was introduced into the source of the mass spectrometer.
Glucuronidation of acetaminophen by various cDNA expressed UDP-glucuronosyltransferases (UGTs).
To test the ability of various UGTs to form the APAP glucuronide, incubations were performed using cDNA expressed UGT 1A1, 1A4, 1A6, 1A8, 1A9, 1A10, 2B4, 2B7, 2B15, and 2B17. The enzymes (final concentration 0.25 mg/ml) were preincubated in 50 mM Tris buffer (pH 7.5) containing MgCl2 (6 mM) and alamethicin (80 μg/mg protein) on ice for 15 min. APAP (final concentration 100 μM) dissolved in water was then added to the incubation mixture prior to removing the samples to a water bath maintained at 37°C. After 2 min, the reaction was initiated by the addition of UDPGA to a final concentration of 2 mM. The final volume of incubation was adjusted to 1 ml with 0.1 M Tris buffer (pH 7.5). At 0 and after 60 min, aliquots (200 μl) were transferred to culture tubes containing 500 μl acetonitrile and the internal standard. The tubes were centrifuged at 3000 rpm, after which the supernatants were transferred to another set of clean tubes, and the solvent removed under a stream of nitrogen at 30°C. The dried samples were reconstituted in 500 μl of a mixture of acetonitrile and 0.1% formic acid (4:96 v/v), and 30 μl injected onto LC/MS for analysis. The analysis was carried out as described above, except only the mass transitions for the internal standard (136 → 94), acetaminophen (152 → 110), and glucuronide conjugate (328 → 152) were monitored during the MRM analyses. Glucuronides formed from APAP by various UGTs eluted at 5 min using the HPLC conditions described above. The peak area ratios of APAP glucuronide to the internal standard were obtained for 60-min samples. The peak area ratios were used to obtain a semiquantitative assessment of the relative contributions made by various UGTs in forming APAP glucuronide under the conditions described above.
In vitro metabolism of PB by human liver microsomes.
The metabolism of PB was investigated using human liver microsomes. PB (100 μM) was incubated in the presence of human liver microsomes (2 mg/ml), NADPH (2 mM), UDP-glucuronic acid (UDPGA) (2 mM), MgCl2 (3 mM), and alamethicin (80 μg/mg protein) in 0.1 M phosphate buffer (pH 7.4) at 37°C for 60 min. The microsomes were preincubated with alamethicin over ice for 15 min prior to the addition of the rest of the cofactors. Incubations were also performed without the addition of UDPGA and alamethicin, to exclude glucuronidation reactions. At the end of the incubation, the microsomal proteins were precipitated by adding 2 ml of ice-cold acetonitrile, followed by centrifugation at 3000 rpm. using an Allegra™ X-22R centrifuge equipped with SX4250 rotor. The supernatant was removed, dried under a stream of nitrogen, and reconstituted in 400 μl of ACN:0.1% formic acid (4:96 v/v). An aliquot (20 μl) was injected onto LC/MS using the conditions described earlier.
Inhibition studies.
The ability of PB and PH to inhibit UGTs responsible for APAP glucuronidation was investigated. Incubations were performed as described above under glucuronidation of APAP by various UGTs. To determine inhibition of APAP glucuronidation, rat or human liver microsomes (1.0 mg/ml) or cDNA-expressed UGTs 1A1, 1A6, 1A9, or 2B15 (0.25 mg/ml) were incubated with APAP (1 mM) in the presence and absence of increasing concentrations of PB (0–10 mM) or PH (0–5 mM). After 30 min at 37°C, 40 μl was transferred from the reaction mixture to a tube containing 400 μl of acetonitrile containing the internal standard. The protein-precipitated samples were centrifuged, the supernatants transferred to another set of tubes, and samples dried under a stream of nitrogen. The samples were reconstituted in 400 μl of the HPLC mobile phase, and 30 μl was injected onto LC/MS as described earlier. The peak areas of the APAP glucuronide and the internal standard were obtained by operating the mass spectrometer in the MRM mode (see above).
The peak area ratios of APAP glucuronide to the internal standard were obtained for each sample using the Analyst software (version 1.4, Applied Biosystems/MDS SCIEX, Concord, Ontario, Canada). The peak area ratio obtained from the sample containing no inhibitor was arbitrarily assigned as having 100% activity. The percent activity remaining in the samples containing inhibitors was obtained by:
Ratio of peak areas APAP-glucuronide to Internal Standard (IS) at an inhibitor concentration/Ratio of peak areas APAP-glucuronide to IS at zero inhibitor concentration × 100%.
The IC50 estimates for the inhibition of acetaminophen glucuronidation were determined by nonlinear curve fitting with WinNonLin (Pharsight WinNonLin, Mountain View, CA) and were defined as the concentration of compound required to inhibit glucuronidation by 50%.
RESULTS
Effect of Phenobarbital and Phenytoin on APAP Toxicity in Cultured Hepatocytes
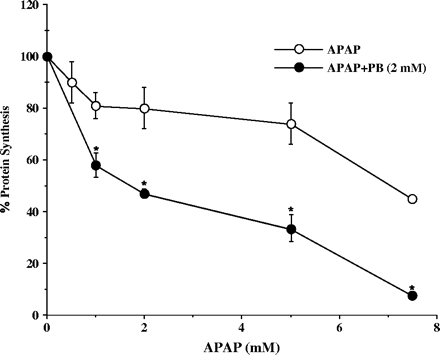
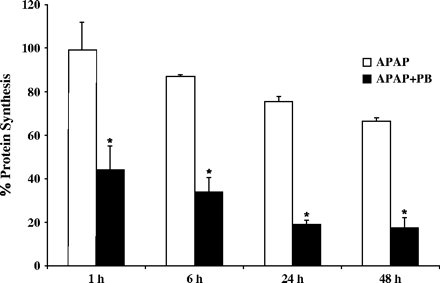
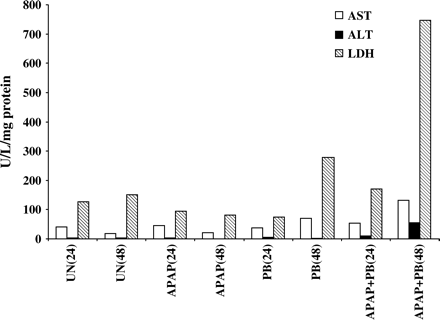
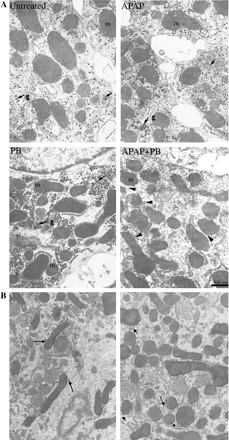
Incubation of human hepatocytes (prepared from four different donors) with the combination of APAP and PB (2 mM) resulted in concentration-dependent increases in APAP toxicity by 25–50% compared with cells treated with APAP alone, as measured by decrease in total protein synthesis (Fig. 1). Cells treated with APAP alone (1–5 mM) showed about 20% decrease in protein synthesis sustained for 48 h incubation, with no signs of morphological or metabolic toxicity. PB alone was not toxic to the cells (data not shown). The maximum potentiation of toxicity was observed at 5 mM APAP, the concentration used in subsequent experiments. Incubation of hepatocytes with 10 mM APAP alone was performed in a separate experiment and resulted in about 70% decrease in protein synthesis, toxicity similar to that found in cells treated with combination of 5 mM APAP and 2 mM PB. The time-course of APAP toxicity is shown in Figure 2. In cells treated with PB and APAP, the decreases in protein synthesis were detected as early as 1 h and were maximal by 24 h. The toxicity detected by decreased protein synthesis was an early detectable event progressing to morphological cell death and was associated with release of LDH, ALT, and AST in culture medium after 24–48 h incubation of cells with both drugs (Fig. 3). The actual time of hepatocyte death, determined by morphological changes, varied between 24 and 48 h and depended on the donor cell, suggesting that exposure time is critical for cellular death. Thus, measurement of decreases in protein synthesis was a much more effective method in enabling early detection of toxicity. Ultrastructural changes were characterized in cells prepared from a single donor treated with 5 mM APAP and 2 mM PB for 24 h. As shown in Figure 4, combined treatment with APAP and PB resulted in disappearance of cellular glycogen, appearance of giant fused mitochondria, and blebbing of mitochondria membranes, indicating mitochondrial damage.
Effect of acute PB addition on APAP toxicity in cultured human hepatocytes. Hepatocytes from four human donors were treated for 6 h with 5 mM APAP alone or in combination with 2 mM PB. Protein synthesis was determined by a pulse labeling with 14C-leucine as described under Materials and Methods. Each value is expressed as a percentage of the value in untreated cells and represents the mean of duplicate treatments of hepatocytes from each of four donors, with the range indicated by the vertical bars. *Significantly different from APAP-alone-treated hepatocytes, with p < 0.001.
Effect of treatment time on protein synthesis in cultured human hepatocytes treated with APAP + PB. Hepatocytes from three human donors were treated for 1, 6, 24, or 48 h with 5 mM APAP alone or in combination with 2 mM PB. Protein synthesis was determined by a pulse labeling with 14C-leucine as described under Materials and Methods. Each value is expressed as a percentage of the value in untreated cells and represents the mean of duplicate treatments of hepatocytes from each of three donors, with the range indicated by the vertical bars. *Significantly different from APAP alone treated hepatocytes, with p < 0.001.
Effect of APAP + PB on enzyme release from cultured human hepatocytes. Hepatocytes from a single donor were treated for 24 or 48 h with 5 mM APAP alone or in combination with 2 mM PB. Aliquots of the medium were removed, and ALT, AST, and LDH were measured as described under Materials and Methods. The increase in LDH in PB treated cells at 48 h was not considered toxicity response, since no decrease in protein synthesis was detected in these cells. Untreated cells (UN).
Effect of APAP and PB on ultrastructural changes in human hepatocytes. Hepatocytes from a single donor were treated for 24 h with 5 mM APAP, 2 mM PB, or their combination. Hepatocytes were fixed with 3% gluteraldehyde and processed for electron microscopy. Figure 4B shows more detailed changes in mitochondria morphology in two different culture sections in cells treated with the combination of APAP and PB. Images at 15K are shown. m—mitochondria; g—glucogen.
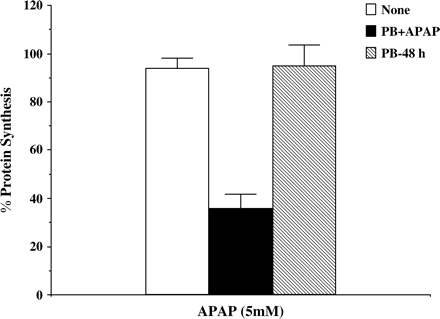
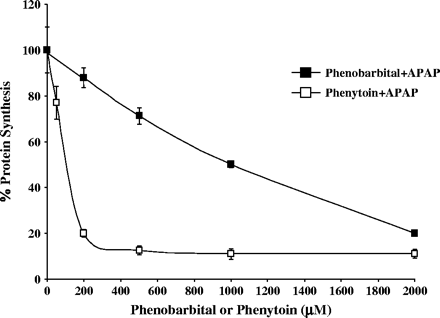
The decrease in protein synthesis observed as early as 1 h suggested that induction of CYPs was not required to elicit an increase in APAP toxicity. To investigate this, we treated a subset of cells with PB (2 mM) for 48 h to induce CYP3A prior to the addition of APAP. This treatment previously was shown to induce CYP3A activity in human cultured hepatocytes (Hariparsad et al., 2004). After 48 h pretreatment, the media was replaced with PB-free media, and APAP was added for 6 h. The control cells were incubated with either APAP alone or in combination with PB (2 mM). As shown in Figure 5, toxicity was observed only in cells exposed to both drugs simultaneously and not in cells pretreated with PB, followed by APAP alone (Fig. 5). These findings suggest an acute effect of PB on APAP toxicity, as long as both APAP and PB are present together. The effect of increasing concentrations of PB or PH on APAP toxicity in a combined treatment is shown in Figure 6. PH was more potent in increasing APAP toxicity, with a maximum response obtained at 200 μM. Comparable toxicity with PB was observed at 2 mM.
Effect of acute addition of APAP and PB versus pretreatment with PB on APAP toxicity. Hepatocytes from two human donors were pretreated for 48 h with 2 mM PB (PB-48 h). Some hepatocytes were left untreated. At the end of this time, media was changed to PB-free media. Hepatocytes were treated for 6 h with either APAP alone (opened and hatched bars) or in combination with 2 mM PB (closed bars). Protein synthesis was determined by a pulse labeling with 14C-leucine as described under Materials and Methods. Each value is expressed as a percentage of the value in untreated cells and represents the mean of duplicate treatments, with the range indicated by the vertical bars.
Effect of PB or PH on APAP toxicity in human hepatocytes. Hepatocytes from two human donors were treated for 6 h with 5 mM APAP alone or in combination with different concentrations of PB or PH. Protein synthesis was determined by a pulse labeling with 14C-leucine as described under Materials and Methods. Each value is expressed as a percentage of the value in cells treated with PB or PH alone and represents the mean of duplicate treatments of hepatocytes from each of two donors, with the range indicated by the vertical bars.
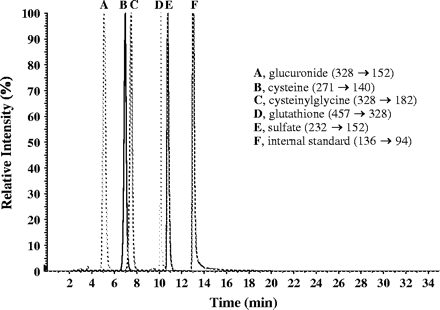
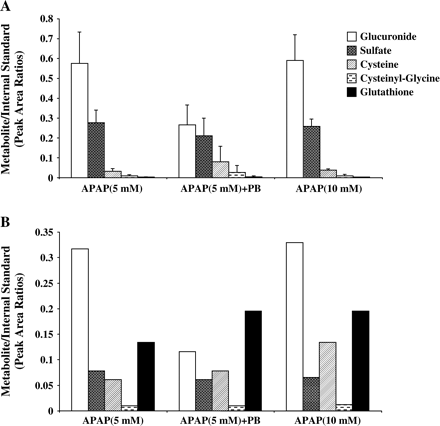
We analyzed the culture media and cell lysates for APAP metabolites, including glucuronide, sulfate, cysteine, cysteinylglycine, and glutathione conjugates. The metabolites of APAP have previously been synthesized and well characterized (Mutlib et al., 2000). The identities of all metabolites were confirmed by comparing the retention times and mass spectral data with authentic standards. LC/MS analysis of cell media showed the presence of APAP glucuronide as the major metabolite that eluted at 5 min with MH+ at m/z 328. MS/MS fragmentation produced ion fragment at m/z 152 (aglycone) formed by the loss of glucuronic acid moiety. The sulfate conjugate appeared at 10.6 min. with MH+ at m/z 252. Fragmentation in MS/MS experiments showed loss of 80 amu as expected from sulfate conjugates (Muck and Henion, 1990). Other minor metabolites in the incubation extract included the cytseine (MH+ at m/z 271), cytseinylglycine (MH+ at m/z 328), and glutathione conjugates (MH+ at m/z 457). A representative chromatograph normalized to 100% shows the profile of each metabolite in media from human hepatocytes treated with 10 mM APAP (Fig. 7). The peak area ratios of each of these metabolites to the internal standard (acetanilide) were obtained and compared among the various treatment groups (Fig. 8). The glucuronide conjugate was the major metabolite in cells treated with APAP alone. Addition of PB together with APAP caused a 50–60% reduction in APAP-glucuronide conjugate formation, as detected in both media and cells, indicating decreased formation of APAP-glucuronide rather than decreased transport. The glutathione conjugate and its catabolized products, cysteinyl-glycine and cysteine, were found in relatively abundant amounts in cell lysates compared to cell media, suggesting limited transport capacity for these large metabolites across cellular membrane into the culture media (Figs. 8A and 8B). The apparent levels of the GSH metabolite of APAP were greater in cells treated with APAP and PB compared to 5 mM APAP alone and similar to that produced in cells treated with 10 mM APAP alone, suggesting that greater amounts of APAP were converted to GSH metabolites in combined treatment and in cells exposed to 10 mM APAP. Levels of sulfate and glucuronide conjugates were similar in 5 mM- and 10 mM-treated cells, suggesting saturation of sulfation and glucuronidation at these concentrations. There were no detectable levels of PB-glucuronide in either culture media or cell lysates, suggesting that inhibition of APAP glucuronidation by PB and associated toxicity was due to direct inhibition of APAP glucuronidation.
A representative chromatogram showing multiple monitoring of APAP metabolites present in media of APAP (10 mM) treated human hepatocytes. The mass spectral transitions for each metabolite are listed above. The peaks heights have been normalized to 100% to illustrate the relative retention times of each component and are not representative of the abundance of each component in the mixture.
Analysis of APAP metabolites in culture media (A) and cell lysate (B) of human hepatocytes. Hepatocytes were treated for 24 h with 5 mM or 10 mM APAP alone or the combination of 5 mM APAP and 2 mM PB. Media (A) and cell lysate (B) were collected and analyzed for APAP metabolites as described under Materials and Methods. Each is expressed as a ratio of peak area of metabolites to the internal standard (acetanilide) and represents the mean of pool of duplicate treatments of hepatocytes from each of two donors, with the range indicated by the vertical bars in A. Data from a single donor are shown in B.
Effect of Phenobarbital on APAP Glucuronidation in Rat Liver Microsomes
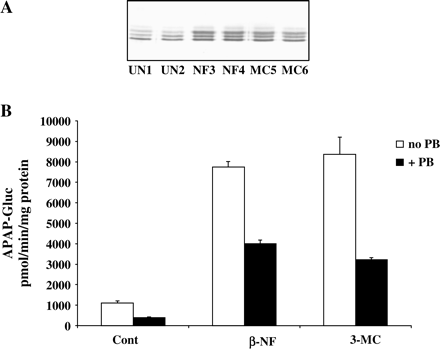
To determine whether PB has a direct inhibitory effect on APAP glucuronidation, we investigated the effect of PB on glucuronidation of APAP by rat liver microsomes. Microsomes prepared from untreated rats and rats treated with either β-naphthoflavone (NF) or 3-methylcholanthrene (MC) to induce UGT1A were analyzed by Western blot. UGT1A family of isoenzymes was recognized with an antibody reacting with multiple members of this family. Treatment with NF or MC resulted in strong increases in immunoreactive UGT1A isozymes (Fig. 9A). These increases were confirmed by a 5.6-fold increase in formation of APAP-glucuronide in microsomal incubations (Fig. 9B). When PB was included in the incubation mixture together with APAP and UDPGA, a 50% decrease in APAP-glucuronide formation was detected. Thus, similar to cultured human hepatocytes, PB caused an inhibition of APAP glucuronidation.
Inhibition of APAP-glucuronide formation by PB in rat liver microsomes. Liver microsomes from control or β-naphthoflavone (NF) or 3-methylcholanthrene (MC) treated rats were analyzed for expression of UDPGTs family (A). Microsomes were incubated with UDPGA and 5 mM APAP alone or in combination with 2 mM PB, and APAP-glucuronide formation was determined (B) as described under Materials and Methods. Each value represents the mean of duplicate incubations, with the range indicated by the vertical bars.
Effect of Phenobarbital and Phenytoin on APAP Glucuronidation by Expressed Forms of Human UGTs and Human Liver Microsomes
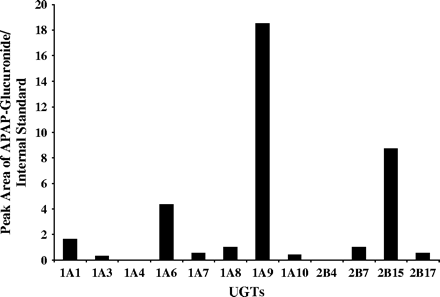
To further characterize the kinetics of inhibition of APAP glucuronidation by PB and PH, we used multiple forms of expressed human UGTs and pooled human liver microsomes to measure the IC50 values. APAP alone (100 μM) was glucuronidated mainly by UGT1A9, 2B15, 1A6, and 1A1 (in decreasing order) over 60 min (Fig. 10). Other UGTs, including 1A3, 1A7, 1A8, 1A10, 2B7, and 2B17, were also capable of glucuronidating APAP; however, the levels were much lower (5- to 60-fold) than those produced by UGT1A9, 2B15, 1A6, and 1A1. UGT1A4, and 2B4 did not produce any APAP-glucuronide under the incubation conditions used in this study.
Formation of APAP glucuronide in the presence of various UGTs. The relative levels of APAP glucuronide were obtained by comparing the peak area ratios of the APAP glucuronide to the internal standard.
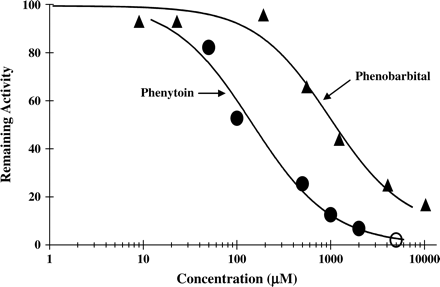
The major UGTs responsible for the glucuronidation of APAP (UGT1A9, 2B15, 1A6) were inhibited by PB or PH (Table 1). Each isoenzyme was inhibited more potently by PH than by PB, except UGT2B15. Figure 11 shows a representative inhibition of APAP glucuronidation mediated by UGT1A6 in the presence of these two inhibitors. These data are in agreement with more potent inhibition by PH of APAP glucuronidation and associated toxicity in cultured human hepatocytes (Fig. 6). Similarly, incubations with pooled human liver microsomes showed a stronger effect of PH in reducing the glucuronidation of APAP (Table 1).
IC50 Inhibition Values of Acetaminophen Glucuronidation
Inhibitor . | UGT1A6 . | UGT1A9 . | UGT2B15 . | HLM . |
|---|---|---|---|---|
| Phenobarbital | 1709 ± 279 | 3700 ± 760 | 303 ± 32 | 2064 ± 607 |
| Phenytoin | 280 ± 69 | 145 ± 27 | 607 ± 145 | 800 ± 58 |
Inhibitor . | UGT1A6 . | UGT1A9 . | UGT2B15 . | HLM . |
|---|---|---|---|---|
| Phenobarbital | 1709 ± 279 | 3700 ± 760 | 303 ± 32 | 2064 ± 607 |
| Phenytoin | 280 ± 69 | 145 ± 27 | 607 ± 145 | 800 ± 58 |
Note. IC50 values (μM) obtained for the inhibition of acetaminophen glucuronidation catalyzed by UGT1A6, UGT1A9, UGT2B15, and pooled human liver microsomes (HLM) in the presence of phenobarbital and phenytoin. Incubations were carried out in the presence of 1 mM acetaminophen and various concentrations of the inhibitors (0–10 mM).
Inhibition of UGT1A6-mediated acetaminophen glucuronidation by PB or PH. Inhibition of APAP (1 mM) glucuronidation by increasing concentrations of phenobarbital or phenytoin catalyzed by UGT1A6 was measured as described under Materials and Methods.
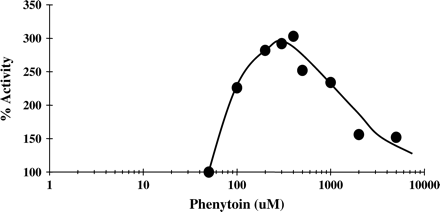
In contrast, UGT1A1 was activated in the presence of PH (Fig. 12). Using 1 mM APAP, a maximal increase in activity (as compared to control with no PH added) was obtained at concentrations of 200–400 μM of PH, giving an overall increase of 300% activity (Fig. 12). This was an unusual observation, as none of the other isoenzymes showed this behavior in the presence of PH. A concentration-dependent activation of UGT1A1-mediated glucuronidation of estradiol by 17alpha-ethynylestradiol or anthraflavic acid was reported previously (Williams et al., 2002). However, activation of APAP glucuronidation by PH in our study was stronger compared to previous reports.
Activation of UGT1A by PH. Glucuronidation of APAP (1 mM) catalyzed by UGT1A1 was measured in the presence of increasing concentrations of PH as described under Materials and Methods.
PB was not metabolized by expressed UGTs or by human liver microsomes. LC/MS analysis of microsomal extracts showed only trace levels of hydroxylated metabolites and no glucuronide conjugates. LC/MS analysis was performed to detect the expected increments in the molecular weight of PB as a result of hydroxylation (+16 amu) or glucuronidation (+176 amu, if conjugation directly on PB; or +192 amu, if conjugation on a potential hydroxylated metabolite of PB). An exhaustive mass spectral analysis of the microsomal extracts showed trace quantities of a hydroxylated metabolite. This finding is consistent with the observations made by previous investigators who found lack of in vitro metabolism of PB in microsomal systems and in cultured rat hepatocytes (Levin et al., 1986; Verite et al., 1996). However it has been shown in vivo that PB is metabolized in rats and humans with the formation of a hydroxylated metabolite that is subsequently conjugated with glucuronic acid (Levin et al., 1986; Whyte et al., 1977).
DISCUSSION
Here we demonstrated the use of human cultured hepatocytes for evaluation of drug–drug interaction as a result of inhibition of UGT. We determined two effects: inhibition of UGT activity by coadministered drugs and associated toxicity. PB was not a substrate for UGTs but inhibited APAP glucuronidation. This phenomenon was previously described for inhibition by valproic acid of UGT2B15-mediated glucuronidation of several substrates, whereas no glucuronidation activity toward valproic acid itself could be detected (Ethell et al., 2003). In both cultured hepatocytes and microsomes, only trace levels of oxidative and no glucuronide metabolites of PB were found. This is in agreement with previous work by Levin et al., showing no metabolism of PB to p-hydroxyphenobarbital, a precursor of PB-glucuronide, by rat liver micosomes, and more than an order of magnitude slower PB metabolism compared with other drugs by rats in vivo or in perfused liver (Levin et al., 1986). Thus, it appears that hydroxylation of PB is a slow process that could not be detected in vitro.
Acute potentiation of APAP toxicity by PB has been reported in mice and was associated with depletion of hepatic UDPGA (Douidar and Ahmed, 1987), due to the formation of PB glucuronide, which previously has been found in humans and rat. However, studies have also shown that livers of rats that received a single dose of 14C-PB accounted for about three-fold greater amount of unmetabolized PB compared to its glucuronide conjugate (Levin et al., 1986). Therefore, we suggest that two processes could contribute to the potentiation effect of PB on APAP toxicity: (a) direct inhibition of UGT as demonstrated in this study and (b) depletion of hepatic UDPGA, as reported previously (Douidar and Ahmed, 1987).
We have previously described decreases in protein synthesis as a sensitive and an early indicator of cellular toxicity (Kostrubsky et al., 2000). Accordingly, inhibition of protein synthesis by APAP and PB was detected as early as 1 h posttreatment. Continued exposure of cells for 48 h resulted in cell death, as demonstrated by hepatic enzyme release and morphological changes. Thus, hepatic protein synthesis can be used as an early marker to evaluate drugs for their hepatotoxic potential. Ultrastructural analysis revealed depletion of cellular glycogen in cells treated with APAP and PB, suggesting a hypoglycemic state and, likely, compromised ATP synthesis, despite the presence of glucose (2 g/l) in the culture media. Hypoglycemia was the first sign of liver failure in dogs, maintained at a constant plasma concentration of APAP for 20 h. In that study, hypoglycemia was followed by increased serum ALT and liver failure between 30 to 48 h (Kelly et al., 1992). In cultured hepatocytes, APAP concentration was mimicked by inhibition of APAP glucuronidation by PB (Fig. 8), resulting in larger amounts of unconjugated APAP compared to cells treated with APAP alone. The higher level of APAP, as a result of inhibition of metabolism to glucuronide conjugate, allows more APAP to be available for bioactivation process. It results in higher levels of GSH-derived adducts formed in cells treated with the combination of APAP and PB (Fig. 8). In fact, toxicity observed in hepatocytes treated with 5 mM APAP and 2 mM PB was similar to cells treated with APAP alone at 10 mM. Toxicity occurred when glucuronidation of APAP was saturated (Fig. 8). Previously, it has been shown in human hepatocytes that APAP sulfation was saturated at 1 mM APAP (Kane et al., 1995), similar to what we observed in our system (data not shown). In contrast, glucuronidation was saturated at 5 mM APAP, which is in agreement with IC50 of inhibition of APAP glucuronidation (Table 1), thus explaining the strongest potentiation of toxicity in hepatocytes by PB at 5 mM APAP (Fig. 1). We also found changes in mitochondria membranes that preceded cellular death. Mitochondria were suggested as a critical target for APAP toxicity, since depletion of intra-mitochondria GSH level precedes the decrease in cytoplasmic pool of GSH (Ruepp et al., 2002; Zhao et al., 2002). The mitochondria GSH represents a separate pool from cytoplasm and accounts for only about 10% of the total GSH. A significant depletion of mitochondria GSH can easily be masked by the larger levels of cytosolic GSH if analysis of the total cellular GSH pool is conducted. The mitochondria GSH pool is perhaps very critical in maintaining the cell homeostasis. Once the mitochondria GSH is depleted, cell toxicity could take place. In addition, a number of mitochondria proteins including ATP synthase complex and β-oxidation were targeted in mice administered a single subtoxic or toxic dose of APAP between 15 min and 2 h posttreatment (Ruepp et al., 2002). However, obvious structural changes in mitochondria appeared only 24 h after combined treatment with PB and APAP (Fig. 4).
We showed that UGT1A9, 2B15, 1A6, and 1A1 metabolized APAP. The role of UGT1A9, UGT1A6, and UGT1A1 in glucuronidating APAP was reported previously, with UGT1A6 having the highest affinity (Km = 2 mM) but low capacity, and UGT1A9 having a high capacity but low affinity (Km = 50 mM) for APAP conjugation (Bock et al., 1993; Court et al., 2001). However, UGT2B15 has not been previously demonstrated to metabolize APAP (Court et al., 2001). The difference may be due to difference in buffer and concentrations of substrate and cofactor or different batches of cDNA-expressed UGTs used in this study. The role of UGT2B family was suggested based on the observation that Gunn rats deficient in UGT1A still expressed residual activity toward APAP glucuronidation (Kessler et al., 2002).
Clearly, PH was much stronger in inhibiting APAP glucuronidation by UGTs compared to PB. Correspondingly, it was associated with greater potentiation of APAP toxicity by PH as compared to PB (Table 1, Fig. 6). Therapeutic concentrations of PB and PH in human plasma are 100 μM and 40 μM, respectively. However, liver concentrations could be much higher than plasma levels. For example, 60% more PB was detected in liver compared with blood 24 h after administering PB to rats (Levin et al., 1986). Hence a potential for drug–drug interaction can exist in individuals coadministered with APAP and PB or PH. The risk may be greater with drugs that have preferential affinity for a specific form of UGT (atazanavir sulfate) or in individuals with deficiency in glucuronidation. In fact, it has been suggested that Gilbert's individuals carrying UGT1A6*2 allele, in addition to deficiency in UGT1A1 bilirubin conjugation also would have decreased APAP glucuronidation (Lampe et al., 1999).
From the data gathered in this study, it appears that UGT1A1 does not have a major role in glucuronidating APAP in human hepatocytes. This is based on the finding that PH was able to potentiate APAP toxicity, despite its ability to activate UGT1A1. Furthermore, it was demonstrated that PB did not inhibit UGT1A1, yet potentiated APAP toxicity via inhibition of UGT1A6, 1A9, and 2B15.
In conclusion, we identified the direct inhibition of UGT enzymes as a mechanism of potentiation of APAP toxicity. We also found that UGT2B15 metabolizes APAP along with UGT1A6 and UGT1A9, and that glucuronidation can be inhibited by PB and PH. We propose that human hepatocytes can be used as a model to test for toxicity in cases of expected multiple drug therapy with compounds that are substrates for glucuronidation.
Current address: Department of Drug Metabolism and Pharmacokinetics, GlaxoSmithKline, King of Prussia, PA 19406.
This work was supported in part by the Department of Veterans Affairs, NIAAA (AA012898) (JFS), and by the Liver Tissue Procurement and Distribution Program NIH/NIDDK #N01-DK-9–2310 (JFS, SCS). Conflict of interest: none declared.
References
Bock, K. W., Forster, A., Gschaidmeier, H., Bruck, M., Munzel, P., Schareck, W., Fournel-Gigleux, S., and Burchell B. (
Bray, G. P., Harrison, P. M., O'Grady, J. G., Tredger, M. J., and Williams, R. (
Court, M., Duan, S., Moltke, L., Greenblatt, D., Patten, J., Miners, J., and Mackenzie, P. (
Court, M., and Greenblatt, J. (
Cummings, J., Ethell, B. T., Jardine, L., Boyd, G., Macpherson, J., and Burchell, B. (
de Morais, S. M., Chow, S. Y., and Wells, P. G. (
Douidar, S. M., and Ahmed, A. E. (
Ethell, B., Anderson, G., and Burchell, B. (
Hariparsad, N., Nallani, S. C., Sane R. S., Buckley, D. J., Buckley, A. R., and Desai, P. B. (
Kane, R. E., Li, A. P., and Kaminski, D. R. (
Kelly, J. H., Koussayer, T., He, D., Chong, M., Shang, T., Whisennand, H., and Sussman, N. L. (
Kessler, F. K., Kessler, M. R., Auyeung, D. J., and Ritter, J. K. (
Kostrubsky, V. E., Ramachandran, V., Venkataramanan, R., Dorrko, K., Esplen, J., Zhang, S., Sincalir, J. F., Wrighton, S., and Strom S. C. (
Kostrubsky, V. E., Sinclair, J. F., Ramachandran, V., Venkataramana, R., Wen, Y., Kindt, E., Galchev, V., Rose, K., Sinz, M., and Strom, S. C. (
Kostrubsky, V. E., Strom, S. C., Hanson, J., Urda, E., Rose, K., Burliegh, J., Zocharski, P., Cai, H., Sinclair, J. F., and Sahi, J. (
Lampe, J. W., Bigler, J., Horner, N. K., and Potter J. D. (
Levin, S. S., Vars, H. M., Schleyer, H., and Cooper, D. Y. (
Lystbaek, B. B., and Norregaard, P. (
Minton, N. A., Henry, J. A., and Frankel, R. J. (
Mitchell J., Thorgeirsson, S., Potter, W., Jollow, D., and Keise, H. (
Muck, W. M., and Henion, J. D. (
Mutlib, A. E., Shockcor, J., Espina, R., Gracitiani, N., Du, A., and Gan, L. S. (
Pirotte, J. (
Rodriguez, E., and Regadera, P. (
Ruepp, S. U., Tonge, R. P., Shaw, J., Wallis, N., and Pognan, F. (
Verite, P., Cave, C., Menager, S., Davy, J., Andre, D., Farnoux, C. C., and Lafont, O. (
Wen, Y. H., Sahi, J., Urda, E., Kulkarni, S., Rose, K., Zheng, X., Sinclair, J. F., Cai, H., Strom, S. C., and Kostrubsky, V. E. (
Williams, J. A., Ring, B. J., Cantrell, V. E., Campanale, K., Jones, D. R., Hall, D. D., and Wrighton, S. A. (
Zhao, P., and Slattery J. (
Busti, A. J., Hall, R. G., and Margolis, D. M. (
Kostrubsky, V. E., Lewis, L. D., Wood, S. G., Sinclair, P. R., Wrighton, S. A., and Sinclair, J. F. (
Strom, S., Pisarov, L., Dorko, K., Thompson, M., Schuetz, J., and Schuetz, E. (
Author notes
*Department of Safety Science, Pfizer Global Research and Development, Ann Arbor, Michigan 48105; †Veterans Administration Medical Center, White River Junction, Vermont 05009; ‡Departments of Pharmacology/Toxicology and Biochemistry, Dartmouth Medical School, Hanover, New Hampshire 03756; §Departments of Pathology and ¶Cell Biology, University of Pittsburgh Medical Center, Pittsburgh, Pennsylvania 15261; and ∥Department of Pharmacokinetic, Dynamic and Metabolism, Pfizer Global Research and Development, Ann Arbor, Michigan 48105



Comments