


Abstract
Our laboratory has previously reported results from a rat silica inhalation study which determined that, even after silica exposure ended, pulmonary inflammation and damage progressed with subsequent fibrosis development. In the present study, the relationship between silica exposure, nitric oxide (NO) and reactive oxygen species (ROS) production, and the resultant pulmonary damage is investigated in this model. Rats were exposed to silica (15 mg/m3, 6 h/day) for either 20, 40, or 60 days. A portion of the rats from each exposure were sacrificed at 0 days postexposure, while another portion was maintained without further exposure for 36 days to examine recovery or progression. The major findings of this study are: (1) silica-exposed rat lungs were in a state of oxidative stress, the severity of which increased during the postexposure period, (2) silica-exposed rats had significant increase in lung NO production which increased in magnitude during the postexposure period, and (3) the presence of silica particle(s) in an alveolar macrophage (AM) was highly associated with inducible nitric oxide synthase (iNOS) protein. These data indicate that, even after silica exposure has ended, and despite declining silica lung burden, silica-induced pulmonary NO and ROS production increases, thus producing a more severe oxidative stress. A quantitative association between silica and expression of iNOS protein in AMs was also determined, which adds to our previous observation that iNOS and NO-mediated damage are associated anatomically with silica-induced pathological lesions. Future studies will be needed to determine whether the progressive oxidative stress, and iNOS activation and NO production, is a direct result of silica lung burden or a consequence of silica-induced biochemical mediators.
Inhalation of silica by humans has been linked to the pulmonary disease silicosis. This disease is characterized by a severe decline in respiratory function and premature death (Castranova et al., 2000). Human epidemiologic studies have found that even after occupational exposure has ended, silicosis may develop or progress (Hessel and Sluis-Cremer, 1987; Hnizdo and Murray, 1998; Hnizdo and Sluis-Cremer, 1993; Kreiss and Zhen, 1996; Miller et al., 1998; Ng et al., 1987). These studies suggest that in humans there may be a threshold silica burden above which silica-induced pulmonary disease progresses without further exposure. A recent study of coal miners who had relatively low working lifetime dust exposures, almost entirely under the current U.S. exposure limits for coal and silica, determined that these low occupational exposures to silica in a mixed dust environment were associated with pulmonary responses including inflammation and fibrosis (Kuempel et al., 2003). When considered together, these human studies suggest that relatively low silica exposures may pose a serious health risk because of silica-induced disease. Once initiated even at low silica lung burdens, such lung injury may progress even in the absence of further exposure.
The finding that silicotic lungs are in a state of oxidative stress (Vallyathan et al., 1997) has led to the hypothesis that oxidant-mediated lung damage may participate in the development of silica-induced pulmonary disease (Lapp and Castranova, 1993). Alveolar macrophages (AM) become activated after exposure to silica, resulting in the production of reactive oxygen species (ROS) (Castranova et al., 1996b). Nitric oxide (NO) may also participate in silica-induced pulmonary inflammation, damage, and fibrosis. After intratracheal (IT) instillation of silica in rats, messenger RNA levels for inducible nitric oxide synthase (iNOS), an inducible enzyme which produces NO, are increased in bronchoalveolar lavage (BAL) cells (Blackford et al., 1994; Huffman et al., 1998). In a previous silica inhalation study conducted in this laboratory, we determined that the sites of iNOS activation and NO-mediated damage are associated temporally and anatomically with lesions in the lung (Porter et al., 2002b). However, none of these studies examined the effect of postexposure recovery on silica-induced oxidative stress or pulmonary NO production, nor made a quantitative association between the presence of silica in an AM and expression of iNOS.
We recently reported the findings of a rat inhalation model which are consistent with the pattern of pulmonary responses reported in humans (Porter et al., 2004). Rats were exposed to silica (15 mg/m3, 6 h/day) for 20, 40, or 60 days, and a portion of the rats from each exposure were maintained without further exposure for 36 days to examine recovery or progression. The parameters of silica-induced pulmonary inflammation and damage increased with duration of silica inhalation, and these parameters of pulmonary inflammation and damage continued to progress without further silica exposure and in spite of the fact that silica lung burden decreased during recovery. It was also determined that the number of fibrotic nodules per lung increased during the 36-day postexposure period in rats exposed for 40 or 60 days as if inhalation exposure had continued (Scabilloni et al., 2005). The similarity of our rat silica inhalation model (Porter et al., 2004) with human pulmonary responses (Hessel and Sluis-Cremer, 1987; Hnizdo and Murray, 1998; Hnizdo and Sluis-Cremer, 1993; Kreiss and Zhen, 1996; Miller et al., 1998; Ng et al., 1987) suggests that this rat silica inhalation model could be used to investigate possible mechanisms which may be responsible for these pulmonary responses.
Thus, using a rat model of human pulmonary responses to silica previously developed in our laboratory (Porter et al., 2004), we initiated a study to investigate the relationship between silica exposure and postexposure recovery on NO and ROS production, and the resultant pulmonary damage, in this rat model. Furthermore, in an effort to extend our previous findings of a qualitative anatomical association between silica and iNOS expression in the lung (Porter et al., 2002b), we conducted immunohistochemical studies to determine if a quantitative association exists between silica, AM, and expression of iNOS. The effect of silica exposure duration and postexposure recovery was also investigated.
MATERIALS AND METHODS
Silica chemical analyses.
The silica used in this study was Min-U-Sil 5 (U.S. Silica, Berkeley Springs, WV), and the results of chemical analyses of the silica used have previously been reported (Porter et al., 2004). Briefly, bulk silica was analyzed by proton-induced X-ray emission (PIXE) spectrometry and gas chromatography mass spectroscopy for inorganic contaminants and desorbable organic carbon compounds, respectively. These analyses determined that the bulk silica was ≥98.5% pure quartz with low inorganic contamination (≤0.10%), and only trace amounts of desorbable organic carbon compounds were found. Examination of aerosolized silica samples by PIXE spectrometry determined the aerosolized silica had trace amounts of iron, calcium, titanium, and zinc (average total trace elements = 0.13%). Aerosolized silica samples were also analyzed for elemental and organic carbon using a thermal-optical analyzer, which determined that the total carbon averaged 0.21% (range 0.19–0.23%) of the silica aerosol.
Rat silica aerosol exposure.
The exposure-recovery design of this study consisted of six groups: (1) 20 days exposure–0 days recovery, (2) 20 days exposure–36 days recovery, (3) 40 days exposure–0 days recovery, (4) 40 days exposure–36 days recovery, (5) 60 days exposure–0 days recovery, and (6) 60 days exposure–36 days recovery. For each of these groups, equal numbers of rats (198 rats/chamber) were exposed to filtered air (controls) or silica. The silica aerosol generation and exposure system used in this study has previously been described in detail (Porter et al., 2001).
Pathogen-free male Fischer 344 rats (strain CDF, 75–100 g body weight) were purchased from Charles River (Raleigh, NC) and housed using individual cages in two 5-m3 Hinners-type inhalation chambers during this study. One chamber was used for filtered-air exposures (control), and the other for exposure to 15 mg/m3 silica. Exposures were conducted for 6 h per day, 5 days per week, for a total of 20, 40, or 60 exposure days. The rats were on a 12-h light-dark schedule and were exposed during the dark cycle to coincide with their most active period. After completion of the 20-, 40-, and 60-day exposures, half of the rats from each exposure group (air and silica) were used for sample collection; the remaining animals were maintained in normal housing with no further exposure for 36 days, after which they were also sampled. Water was available ad libitum, and food was available at all times except during exposures. The program of animal use was accredited by AAALAC International, and all procedures involving animals were performed under protocols approved by the NIOSH Institutional Animal Care and Use Committee (IACUC).
The silica aerosol concentration was monitored using two independent methods: a RAS-2 particle sensor allowed real-time monitoring, and gravimetric determinations were made at hourly intervals during each day of exposure, as previously reported (Porter et al., 2004). The gravimetric determinations indicated that the silica aerosol concentration ranged from 15.0 to 15.3 mg/m3 silica during the study. Silica particle size averaged ≤2 μm as determined with an Anderson 8-stage cascade impactor. The mass median aerodynamic diameter of the silica particles averaged 1.78 μm (range 1.70–1.89 μm), and the geometric standard deviation averaged 1.93 μm (range 1.87–2.00 μm).
The silica lung burden of rats exposed in this study ranged from 1.15 ± 0.03 mg SiO2/lung after 20 days exposure to 2.84 ± 0.09 mg SiO2/lung after 60 days exposure. Furthermore, pulmonary silica burden increased in a linear manner with increasing exposure time, decreased during the 36-day postexposure period, and had a concomitant increase in lymph node silica burden during the 36-day postexposure period. These observations indicate that silica particle clearance from the lung had not been impaired, and thus the rats were not in pulmonary overload (Porter et al., 2004).
Bronchoalveolar lavage.
Rats were euthanized with an ip injection of ≥100 mg sodium pentobarbital/kg body weight. Bronchoalveolar lavage (BAL) with Ca2+/Mg2+-free phosphate buffered saline (pH 7.4) plus 5.5 mM D-glucose (PBS), and the isolation of acellular first BAL fluid and BAL cells were conducted as previously described (Porter et al., 2004). A tracheal cannula was inserted, and BAL was performed through the cannula using ice-cold PBS. The first lavage was 6 ml and was kept separate from the rest of the lavage fluid; subsequent lavages used 8 ml of PBS until a total of 80 ml of lavage fluid was collected. The acellular supernatant from the first BAL and BAL cells were isolated by centrifugation (650 × g, 10 min, 4°C). The acellular supernatant from the first BAL (BAL fluid) was decanted for later analyses, while the acellular supernatants from the other lavage samples were decanted and discarded. BAL cells were resuspended in HEPES-buffered medium (10 mM N-[2-hydroxyethyl]piperazine-N′-[2-ethanesulfonic acid], 145 mM NaCl, 5 mM KCl, 1 mM CaCl2, 5.5 mM D-glucose, pH 7.4), centrifuged a second time (650 × g, 10 min, 4°C), and after decanting the acellular supernatant, the final resuspension of the cells was made with HEPES-buffered medium. To assess pulmonary inflammation, cell counts of alveolar macrophages (AM) and polymorphonuclear leukocytes (PMN) were obtained using an electronic cell counter equipped with a cell sizer (Coulter Multisizer II, Coulter Electronics, Hialeah, FL), as previously described (Castranova et al., 1990).
BAL fluid superoxide dismutase activity.
BAL fluid superoxide dismutase (SOD) activities were determined by monitoring the reduction of cytochrome c at 550 nm as previously described (Porter et al., 2002b; Vallyathan et al., 1995, 1997) with a Cobas Fara II Analyzer (Roche Diagnostic Systems, Montclair, NJ).
BAL fluid NOx concentration.
In this paper, we define NOx as the total of nitrite
AM zymosan-stimulated and NO-dependent chemiluminescence.
AM chemiluminescence was determined in a total volume of 0.25 ml of HEPES-buffered medium as previously described (Porter et al., 2002b). Resting AM chemiluminescence was determined by incubating 1.0 × 10⁶ AM/ml at 37°C for 20 min, followed by the addition of 5-amino-2,3-dihydro-1,4-phthalazinedione (luminol) to a final concentration of 0.08 μg/ml, followed by the measurement of chemiluminescence. To determine zymosan-stimulated chemiluminescence, 2 mg/ml of unopsonized zymosan was added immediately prior to the measurement of chemiluminescence. All chemiluminescence measurements were made with an automated luminometer (Berthold Autolumat LB 953, EG&G, Gaithersburg, MD) at 390–620 nm for 15 min. The integral of counts per minute versus time was calculated. Zymosan-stimulated chemiluminescence was calculated as the cpm in the zymosan-stimulated assay minus the cpm in the resting assay. NO-dependent chemiluminescence was determined by subtracting the zymosan-stimulated chemiluminescence from cells preincubated with 1 mM L-NAME from the zymosan-stimulated chemiluminescence without L-NAME. The use of unopsonized zymosan in the chemiluminescence assay allowed only AM chemiluminescence to be measured, because unopsonized zymosan stimulates AM chemiluminescence (Castranova et al., 1998) but not PMN chemiluminescence (Allen, 1977; Henderson et al., 1995).
Lung lipid peroxidation.
Rats, separate from those used for bronchoalveolar lavage, were euthanized with an ip injection of ≥100 mg sodium pentobarbital/kg body weight. As previously described (Porter et al., 2002b), lungs were removed en bloc, washed with ice-cold 0.9% (w/v) NaCl, blotted dry, and weighed. Lung tissue was processed, and lipid peroxidation measured using a colorimetric assay at 586 nm (BIOXYTECH7 LPO-586, Oxis International, Portland, OR) following the protocol provided by the manufacturer.
Immunohistochemistry.
Silica and air-exposed control rats, separate from those used for bronchoalveolar lavage, were euthanized with an ip injection of ≥100 mg sodium pentobarbital/kg body weight. Lungs were fixed in 10% neutral buffered formalin by pressure perfusion to 30 cm H2O, processed within 24 h, and embedded in paraffin. Paraffin sections of lung tissues were cut at 5 μm, deparaffinized in xylene and rehydrated, and stained for iNOS as outlined previously (Porter et al., 2002b). Briefly, after rehydration, microwave antigen retrieval with citrate buffer was performed, followed by peroxidase blocking with methanol and H2O2. Slides were incubated overnight at 4°C with iNOS monoclonal antibody (N32020, BD Biosciences, Pharmingen, San Diego, CA), 1:50–1:100 dilution. A streptavidin-biotin-peroxidase kit for use on rat specimens, K0609 (DAKO, Carpinteria, CA), was used for localization of the primary antibody, with diaminobenzidene (DAB) (Zymed Laboratories, South San Francisco, CA) as the chromogen. Tissues were counterstained with Mayer's hematoxylin, dehydrated, and coverslipped. Negative controls were sections in which the primary antibody was omitted; these had no staining, except for occasional slightly positive mast cells. Positive controls for iNOS were lung sections from rats that had been instilled with lipopolysaccharide (10 mg/kg body weight) by IT instillation 24 h prior to sacrifice; the AM in these animals were highly positive for iNOS using the above procedures.
Counting and classifying macrophages for iNOS and silica.
An Olympus IX70 photomicroscope with polarizing filters was used for localizing iNOS and silica in paraffin sections. Alveolar macrophages were counted and classified using a 40× objective and a 10 × 10 eyepiece reticle to define each sampling area of about 0.1 mm2. The location of each macrophage was drawn on a 10 × 10 graph; labels were added for macrophages displaying positive staining for iNOS. Crossed Polaroids were then introduced into the optical path, and each mapped macrophage was relocated and inspected for presence of light-scattering particles. Macrophages were counted and classified in ten different regions of each lung section (approximately 1 mm2 total area). The lung section was systematically sampled, including nonoverlapping areas of the parenchyma and excluding large airways or blood vessels. A tally was made of the number of macrophages with iNOS only, silica only, both iNOS and silica, and neither iNOS nor silica. The total number in each category was used for statistical comparison of the experimental groups.
The macrophage counting procedure is unique and can be used because of previous work that demonstrated unequivocally, using SEM backscatter imaging, that the particles found in the macrophages are silica (Millecchia et al., 2000). In addition, light scattering particles are absent in the air-exposed controls, ruling out possible erroneous results from formalin-pigment formation (Sheehan and Hrapchak, 1980), which can show up as birefringent particles over the entire section in tissues that have been poorly fixed. Finally, because the silica particles are invisible without the crossed Polaroids, the mapping method uses two independent criteria to describe a particular macrophage, thus reducing any tendency of the observer to select and count only those macrophages in a particular category.
Statistical analyses.
For each exposure time, the difference between air- and silica-exposed rats at each recovery time point was tested, using appropriate contrasts, in a two-way analysis of variance model with interactions (Figs. 1, 2, and 5–7). To determine the effect of exposure time, for each exposure group (air or silica), pairwise comparisons between exposure times (20 vs. 40, 20 vs. 60, and 40 vs. 60) within a given postexposure time (0 or 36 days) were done using Tukey's test for multiple comparisons. Significance was set at p ≤ 0.05.
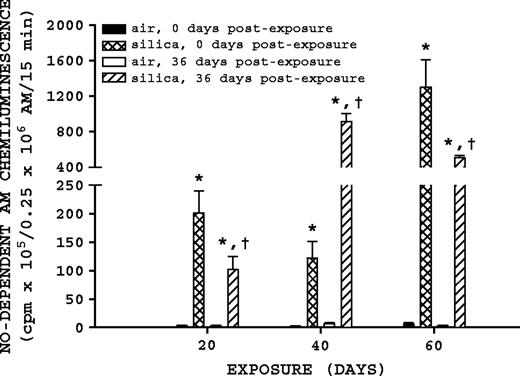
NO-dependent AM chemiluminescence. Rats were exposed to either filtered air or silica (15 mg/m3, 6 h/day) for 20, 40, or 60 days. Some rats from each exposure time were sacrificed at 0 days postexposure, while another portion was maintained without further exposure for 36 days to examine postexposure recovery or progression. NO-dependent AM chemiluminescence was measured as described in Materials and Methods. Values represent mean ± SE (n = 8). An asterisk (*) indicates a significant difference (p ≤ 0.05) between silica-exposed and corresponding air-exposed controls. A dagger (†) indicates a significant difference (p ≤ 0.05) between rats at 0- and 36-days postexposure within a silica exposure group (20, 40, or 60 days).
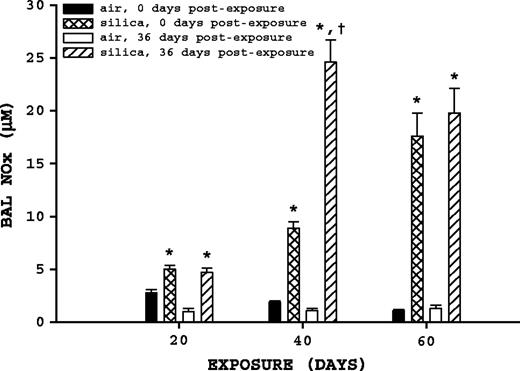
BAL fluid NOx. Rats were exposed to either filtered air or silica (15 mg/m3, 6 h/day) for 20, 40, or 60 days. Some rats from each exposure time were sacrificed at 0 days postexposure, while another portion was maintained without further exposure for 36 days to examine postexposure recovery or progression. BAL fluid NOx was measured as described in Materials and Methods. Values represent mean ± SE (n = 8). An asterisk (*) indicates a significant difference (p ≤ 0.05) between silica-exposed and corresponding air-exposed controls. A dagger (†) indicates a significant difference (p ≤ 0.05) between rats at 0 and 36 days postexposure within a silica exposure group (20, 40, or 60 days).
Generalized linear mixed models with a Poisson probability distribution were used to assess whether the number of macrophages expressing iNOS differed from 0 to 36 days postexposure for each exposure, whether the number of macrophages not expressing iNOS differed from 0 to 36 days postexposure, and whether the number of macrophages expressing iNOS differed between exposure groups for each postexposure period (Fig. 4B). Macrophage counts were assessed using Poisson regression models taking into account the correlation within rats via the generalized estimating equations approach (Fig. 4C). These analyses aimed to compare the number of macrophages expressing iNOS while containing silica (iNOS +, Si +) with the number of macrophages that expressed iNOS without containing silica (iNOS +, Si -) and also with the number of macrophages that did not express iNOS but did contain silica (iNOS -, Si +). These comparisons were made for each exposure and recovery period combination. In all cases, two-sided tests were used with significance set at p ≤ 0.05.
RESULTS
NO-Dependent AM Chemiluminescence
NO-dependent AM chemiluminescence was significantly affected by silica exposure and recovery (Fig. 1). Silica-exposed rats had a significantly higher (p ≤ 0.05) NO-dependent AM chemiluminescence in comparison to their corresponding air control groups for all exposure and postexposure times. For the 40-day exposure time, comparison of silica-exposed rats at 0- and 36-days postexposure indicate that NO-dependent AM chemiluminescence had a significant (p ≤ 0.05) 7.49-fold increase 36 days postexposure. For the 20- and 60-day exposure groups, comparison of silica-exposed rats with 0 and 36 days postexposure indicated that NO-dependent AM chemiluminescence was significantly (p ≤ 0.05) decreased 1.98- and 2.57-fold after recovery, respectively.
BAL Fluid NOx
BAL fluid NOx concentrations were significantly altered by both silica exposure and postexposure time (Fig. 2). Comparison of air-exposed rats to their corresponding silica-exposed rats indicated silica exposure significantly (p ≤ 0.05) increased BAL fluid NOx at all exposure and postexposure times. Comparison of silica-exposed rats at 0 and 36 days postexposure indicated that only the 40-day exposure group had a significant change in BAL fluid NOx with postexposure time, having a significant (p ≤ 0.05) 2.76-fold increase 36 days postexposure.
Immunohistochemistry
Localization of iNOS in this study was very similar to that reported in our previous study of the time course of pulmonary reactions (Porter et al., 2002b). Alveolar macrophages, granulomatous foci within bronchial-associated lymphoid tissue (BALT), and some alveolar epithelial cells were all positive for iNOS. A previous paper from this same recovery study (Porter et al., 2004) reported the presence of silica particles in granulomatous foci in the BALT; these foci were found to be positive for iNOS. After immunohistochemistry for iNOS in this study, when macrophages were examined with polarized light, it was apparent that iNOS-positive AMs were also positive for silica particles (Fig. 3). In order to quantitate the association between iNOS and silica, a procedure was developed to count AMs in each of 10 areas for each tissue section and categorize each one as to presence or absence of iNOS or silica particles, using regular and polarized light consecutively.
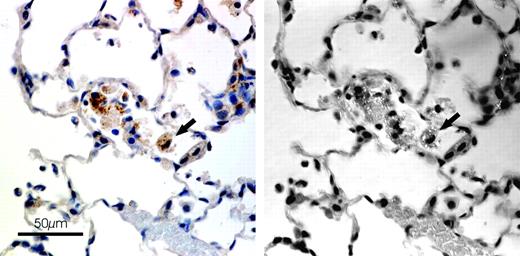
Localization of iNOS and silica in lung of rat exposed to silica for 40 days (0 days postexposure). Rats were exposed to either filtered air or silica (15 mg/m3, 6 h/day) for 20, 40, or 60 days. Some rats from each exposure time were sacrificed at 0 days postexposure, while another portion was maintained without further exposure for 36 days to examine postexposure recovery or progression. Localization of iNOS and silica was determined as described in Materials and Methods. On the left are AMs viewed with regular light; on the right, the same area with crossed Polaroid filters. Arrow—iNOS positive AM (left) with light scattering particles (right).
The total number of AMs in all silica-exposed groups was two- to three-fold higher than the corresponding air-exposed groups (Fig. 4A). Air-exposed animals had very few iNOS positive AMs and did not have any silica particles; their AM counts were not included in the detailed statistical analysis. When we examined the AMs for presence of iNOS (only in silica-exposed animals), we found an increase in numbers of AMs expressing iNOS between 0 and 36 days postexposure for each exposure group, but these increases were not statistically significant (p ≥ 0.05). The number of AMs not expressing iNOS remained relatively constant, except for a decrease between 0 and 36 days postexposure in the 20-day exposure group (Fig. 4B). When we categorized the AMs for both silica and iNOS, however, some significant differences emerged.
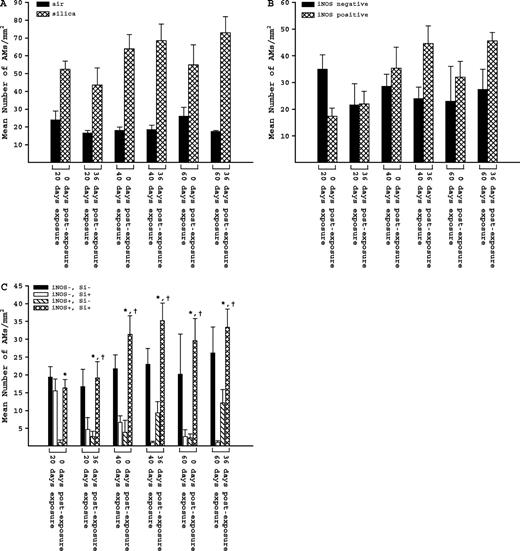
AMs in lung tissue sections from rats in each exposure and postexposure group. Rats were exposed to either filtered air or silica (15 mg/m3, 6 h/day) for 20, 40, or 60 days. Some rats from each exposure time were sacrificed at 0 days postexposure, while another portion was maintained without further exposure for 36 days to examine postexposure recovery or progression. (A) Total number of AMs in sampled areas of silica- and air-exposed rats. (B) Number of iNOS negative (−) and iNOS positive (+) AMs in silica-exposed rats. (C) Number of AMs in four different categories in silica-exposed rats: both iNOS and silica negative (iNOS−, Si−), iNOS negative and silica positive (iNOS−, Si+), iNOS positive and silica negative (iNOS+, Si−), and both iNOS and silica positive (iNOS+, Si+). Values represent mean ± SE (n = 5). An asterisk (*) indicates a significant difference (p ≤ 0.05) between (iNOS+, Si+) and (iNOS+, Si−); a dagger (†) indicates a significant difference (p ≤ 0.05) between (iNOS+, Si+) and (iNOS−, Si+).
The results for all categories of AMs (only in silica-exposed animals) are given in Figure 4C. There were no significant differences in numbers of (iNOS−, Si−) AMs within or between groups. The number of AMs positive for both iNOS and silica (iNOS+, Si+), however, was significantly higher than the number positive for iNOS and negative for silica (iNOS+, Si−) in every exposure and postexposure period. Also, except for the 20-day exposure group, the number of (iNOS+, Si+) AMs was significantly higher than the number negative for iNOS and positive for silica (iNOS−, Si+).
Zymosan-Stimulated AM Chemiluminescence
Both silica exposure and recovery affected significant changes in zymosan-stimulated AM chemiluminescence (Fig. 5). Comparison of silica-exposed rats to their corresponding air-exposed controls indicated silica exposure significantly (p ≤ 0.05) increased zymosan-stimulated AM chemiluminescence at all exposure and postexposure times. Comparison of silica-exposed rats at 0 and 36 days postexposure indicates that the 40-day exposure group had a significant (p ≤ 0.05) 6.44-fold increase in zymosan-stimulated AM chemiluminescence 36 days postexposure; similar comparisons for the 20- and 60-day silica-exposure groups were not significant (p ≥ 0.05).
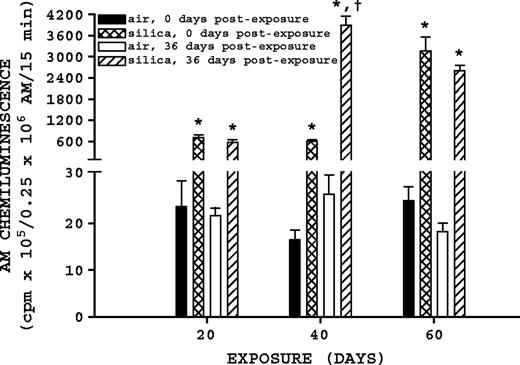
Zymosan-stimulated AM chemiluminescence. Rats were exposed to either filtered air or silica (15 mg/m3, 6 h/day) for 20, 40, or 60 days. Some rats from each exposure time were sacrificed at 0 days postexposure, while another portion was maintained without further exposure for 36 days to examine postexposure recovery or progression. Zymosan-stimulated AM chemiluminescence was measured as described in Materials and Methods. Values represent mean ± SE (n = 8). An asterisk (*) indicates a significant difference (p ≤ 0.05) between silica-exposed and corresponding air-exposed controls. A dagger (†) indicates a significant difference (p ≤ 0.05) between rats at 0 and 36 days postexposure within a silica exposure group (20, 40, or 60 days).
BAL Fluid SOD
BAL fluid SOD was significantly affected by silica exposure and time postexposure (Fig. 6). Comparison of air-exposed to their corresponding silica-exposed rats indicates silica exposure significantly (p ≤ 0.05) increased BAL fluid SOD at all exposure and postexposure times. Comparison of silica-exposed rats at 0 and 36 days postexposure indicates that all three exposure groups had significant increases (p ≤ 0.05) in BAL fluid SOD. Rats exposed to silica for 20 days had a 2.67-fold increase at 36 days postexposure, while the 40- and 60-day silica-exposure groups increased 1.55- and 1.56-fold, respectively.
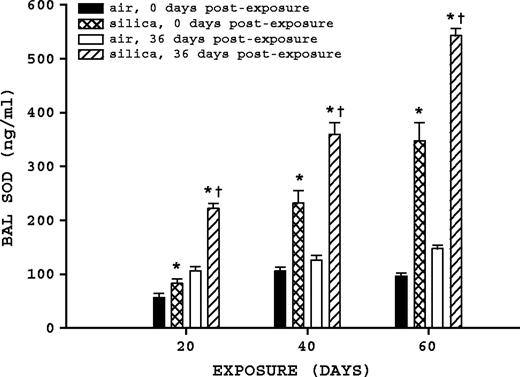
BAL fluid SOD. Rats were exposed to either filtered air or silica (15 mg/m3, 6 h/day) for 20, 40, or 60 days. Some rats from each exposure time were sacrificed at 0 days postexposure, while another portion was maintained without further exposure for 36 days, to examine postexposure recovery or progression. BAL fluid SOD was measured as described in Materials and Methods. Values represent mean ± SE (n = 8). An asterisk (*) indicates a significant difference (p ≤ 0.05) between silica-exposed and corresponding air-exposed controls. A dagger (†) indicates a significant difference (p ≤ 0.05) between rats at 0 and 36 days postexposure within a silica exposure group (20, 40, or 60 days).
Lung Lipid Peroxidation
Both silica exposure and time postexposure affected lung lipid peroxidation levels (Fig. 7). In comparison to air-exposed rats, silica-exposed rats at 20 days exposure at 0 days postexposure had a significant (p ≤ 0.05) increase in lung lipid peroxidation, whereas the silica-exposed rats 36 days postexposure had a significant decrease (p ≤ 0.05) compared to air-exposed rats; there was no significant (p ≥ 0.05) difference between either of the silica-exposed groups after 20 days exposure. For 40-day exposure groups, comparison of air-exposed to corresponding silica-exposed rats determined a significant (p ≤ 0.05) increase in lung lipid peroxidation at 36 days postexposure, but no significant difference was determined for the rats at 0 days postexposure. Comparison of 40-day silica-exposed rats at 0 and 36 days postexposure determined that lung lipid peroxidation levels in the 36-days-postexposure group were significantly (p ≤ 0.05) increased. For the 60-day exposure groups, comparison of air-exposed to corresponding silica-exposed groups indicated that peroxidation levels were significantly increased (p ≤ 0.05) at 0 and 36 days postexposure, but comparison of the silica-exposed groups (0 vs. 36 days) did not differ (p ≥ 0.05) significantly.
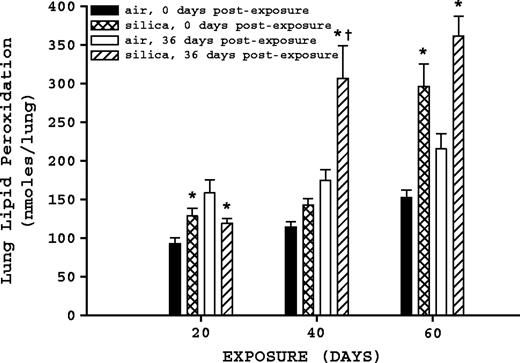
Lung lipid peroxidation. Rats were exposed to either filtered air or silica (15 mg/m3, 6 h/day) for 20, 40, or 60 days. Some rats from each exposure time were sacrificed at 0 days postexposure, while another portion was maintained without further exposure for 36 days to examine postexposure recovery or progression. Lung lipid peroxidation was measured as described in Materials and Methods. Values represent mean ± SE (n = 8). An asterisk (*) indicates a significant difference (p ≤ 0.05) between silica-exposed and corresponding air-exposed controls. A dagger (†) indicates a significant difference (p ≤ 0.05) between rats at 0 and 36 days postexposure within a silica exposure group (20, 40, or 60 days).
DISCUSSION
Three different exposure times were used in this study, namely 20, 40, and 60 days. These represent exposure times that have been previously determined in a silica inhalation time-course study, which did not include postexposure recovery groups, to result in elevated but controlled inflammation and damage without fibrosis (20 days), the transition from controlled inflammation and damage to rapidly increasing inflammation and damage with fibrosis beginning to develop (40 days), and rapidly increasing inflammation and damage with more severe fibrosis (60 days) (Porter et al., 2001, 2002b,c). Additionally, in a previous report from this rat silica inhalation study, we determined that the parameters of silica-induced pulmonary inflammation and damage increased with duration of silica inhalation, and these parameters of pulmonary inflammation and damage progressed during a postexposure period despite a decreasing silica lung burden (Porter et al., 2004), as well as a progression in the number of fibrotic nodules after 40 and 60 days of silica inhalation (Scabilloni et al., 2005). The similarity of this rat silica inhalation model to previously reported human pulmonary responses to silica suggested that this rat model could be used in future investigations of the mechanisms which may be responsible for these human pulmonary responses (Porter et al., 2004). In the present report, this same rat silica inhalation model was used to examine the oxidative mechanisms underlying the development of silica-induced pulmonary disease, primarily focusing on NO and ROS.
The initial objective of this investigation was to establish that the silica-exposed rat lungs were in a state of oxidative stress. It has been suggested that lung SOD can increase in response to the oxidant stress present in the lung as a defensive response, since SOD catalyzes the conversion of superoxide to hydrogen peroxide, which catalase can subsequently convert to water and oxygen (Vallyathan et al., 1995). In a previous silica inhalation study, we reported that BAL fluid SOD activity increased with increasing duration of silica exposure, adding support to the hypothesis that SOD can be upregulated in response to oxidant stress (Porter et al., 2002b). In this study, BAL fluid SOD in silica-exposed rats was higher than air-exposed controls for all three exposure groups. In addition, comparisons of BAL fluid SOD activity for silica-exposed rats with 0 days recovery shows a nearly linear, statistically significant increase, with exposure time, i.e., 20 days < 40 days < 60 days. These findings are consistent with results obtained from our previous silica inhalation time-course study (Porter et al., 2002b). A similar statistical analysis for silica-exposed rats with 20, 40, and 60 days exposure, but with 36 days recovery, determined these groups also had statistically significant increase with respect to exposure time. This suggests that silica exposure had induced oxidative stress. Interestingly, BAL fluid SOD was higher in rats at 36 days postexposure in comparison to those at 0 days postexposure for all three exposure times, suggesting that the silica-induced oxidative stress continued during this postexposure period.
Further evidence that the silica-exposed rat lungs were undergoing oxidative stress was obtained by measuring lung lipid peroxidation. Lung lipid peroxidation is a marker of oxidative tissue damage and combines the oxidative effects of ROS and NO. Specifically, NO can stimulate ROS-induced lipid oxidation as well as mediate oxidant-protective reactions in membranes at higher rates of NO production, and the pro-oxidant and anti-oxidant outcome critically depends on relative concentrations of the individual reactive species, i.e., ROS and NO (Rubbo et al., 1994). This is an important consideration in this study, given the changes in ROS and NO production at different exposure and postexposure times. Thus, lipid peroxidation incorporates both the pro-oxidant and anti-oxidant effects of NO, in combination with ROS, and thus is representative of the overall oxidant status of the lung.
In this study, lung lipid peroxidation had statistically significant increases in those rats with the longest period of silica exposure, and oxidant stress progressed after silica exposure had ceased for the 40- and 60-day exposure groups. Furthermore, the increase in BAL SOD activity does not appear to be sufficient to protect the lung from ROS-mediated damage. This is consistent with previous findings from our laboratory that determined that lung lipid peroxidation increased despite increases in BAL fluid SOD in a silica inhalation time-course study (Porter et al., 2002b).
Both noncellular and cellular ROS may contribute to silica-induced oxidative stress. ROS can be generated noncellularly from the surface of silica in the form of highly reactive hydroxyl radicals (Castranova et al., 1996a). The production of hydroxyl radicals by silica particles is dependent on numerous factors, including silica particle size and surface geometry, as well as inorganic contaminates, particularly iron due to its involvement in Fenton chemistries (Fubini, 1998). Freshly fractured silica produces more ROS via these noncellular reactions than does aged silica, due to the presence of hydroxyl radicals on the fracture planes and their reaction with water (Castranova et al., 1996a). Consistent with this determination, in comparison to aged silica, freshly fractured silica is more cytotoxic, when tested in a cellular in vitro system (Castranova et al., 1996b), and results in greater pulmonary inflammation and damage in vivo after inhalation (Vallyathan et al., 1995) and IT exposure (Porter et al., 2002a). It is not possible to estimate what proportion of ROS was produced by noncellular silica-mediated reactions and what proportion by cellular-mediated production. However, the use of aged silica with low inorganic contaminants reduced the noncellular silica-mediated reactions to the minimum that was technically achievable in this study.
Silica-induced cellular production of ROS was measured in this study as zymosan-stimulated AM chemiluminescence. In this study, we determined that silica exposure stimulates AM ROS production, as indicated by increased zymosan-stimulated AM chemiluminescence. This observation is consistent with data from our previous silica inhalation time-course study, which reported a similar increase after exposure to silica (Porter et al., 2002b). Together, these two sources of ROS, i.e., noncellular and cellular, would contribute to the oxidative stress and lipid peroxidation occurring in silica-exposed rat lungs. As with lipid peroxidation, AM chemiluminescence progressed during 36-day postexposure period after 40 days inhalation exposure.
The second major objective of this investigation was to characterize pulmonary NO production and how it relates to progression of silica-induced pulmonary inflammation and damage. Two parameters were measured to characterize pulmonary NO production, namely NO-dependent AM chemiluminescence and BAL fluid NOx. AMs isolated from silica-exposed rats exhibited a significant increase in NO production compared to their air-exposed controls. For silica-exposed rats with 0 days recovery, NO-dependent AM chemiluminescence was significantly higher after 60 days exposure in comparison to either the 20- or 40-day exposure groups. In addition, for rats exposed to silica for 40 days, NO-dependent chemiluminescence increased during the 36-day postexposure period, but did not significantly increase during the 36-day postexposure period for rats exposed to silica for 60 days. Zymosan-stimulated AM chemiluminescence is a marker of total cellular ROS and reactive nitrogen species (RNS) production, whereas NO-dependent AM chemiluminescence is the component of the total attributable to RNS. Thus, zymosan-stimulated AM chemiluminescence reflects the activity of two cellular enzyme systems, NADPH oxidase and iNOS. The lack of an increase in zymosan-stimulated AM chemiluminescence during the 36-day postexposure period for 60-day silica-exposed rats is most likely because the activity of NADPH oxidase and/or iNOS were at their maximum, and thus no further increase was possible even with further stimulation by silica.
However, AMs are not the only source of NO in the lung. We have previously reported that after IT instillation of silica, polymorphonuclear leukocytes also produce NO (Huffman et al., 2003), and immunohistochemical studies have indicated that alveolar type II cells stain positively for iNOS after inhalation of silica (Porter et al., 2002b). Thus, BAL fluid NOx is a more representative measure of pulmonary NO production, as it accounts for all NO sources in the lung. BAL fluid NOx from silica-exposed rats was significantly increased above air-exposed controls for all the silica-exposed groups. This is consistent with previous reports from our laboratory that determined that, after IT instillation of silica, iNOS mRNA was induced in AMs (Blackford et al., 1994), and expression of iNOS protein was elevated in AMs and alveolar type II cells after silica inhalation (Porter et al., 2002b). For rats exposed to silica for 20, 40, and 60 days with 0 days recovery, BAL fluid NOx had statistically significant increases in a nearly linear manner. As with NO-dependent AM chemiluminescence, BAL fluid NOx levels continued to increase at 36 days postexposure compared to levels measured immediately after 40 days inhalation of silica, but this was not the case for rats exposed for 60 days. The lack of an increase in BAL fluid NOx likely reflects that the activity of iNOS was at its maximum, and thus no further increase in lung NO production was possible, even with further stimulation by silica. This observation also adds support to the hypothesis that the lack of an increase in zymosan-stimulated AM chemiluminescence during the 36-day postexposure period for 60-day silica-exposed rats was due, in part, to the activity of iNOS being at its maximum, and thus no further increase was possible even with further stimulation by silica.
In a previous silica inhalation study, our laboratory reported qualitative data indicating colocalization of silica and iNOS (Porter et al., 2002b). In the present study, we demonstrate this association quantitatively using immunohistochemistry and polarized light microscopy. The number of AMs positive for both silica and iNOS in every silica and postexposure group was significantly higher than the number with iNOS but no silica. Also, the number of AMs positive for both silica and iNOS in all silica-exposed groups at 36 days postexposure, and in the groups at 40- and 60-day time points at 0 days postexposure, was significantly higher than the number with silica but no iNOS. The fact that many of the silica-positive AMs at the 20-day time point were not positive for iNOS indicates that other factors enter into activation of iNOS during chronic exposure to silica. Silica alone does not induce iNOS in cultures of macrophages (Huffman et al., 1998), but instillation of silica leads to increased levels of iNOS 24 h after silica instillation (Huffman et al., 2003), suggesting that intercellular mediators were involved in iNOS induction. In our previous study, significant iNOS expression was not detected with immunohistochemistry until 40 days of silica inhalation exposure (Porter et al., 2002b). In this study, we detected iNOS expression after 20 days of inhalation; the expression tended to increase further after 40 days of inhalation. Furthermore, there was a trend for iNOS expression to increase during the 36-day postexposure period. We have previously reported the presence of silica particles in areas localized in lipoprotein- and macrophage-rich aggregates in the alveoli, with apoptotic cells found in the same regions (Millecchia et al., 2000). It appears that the increased numbers of AMs expressing iNOS may be a result of a combination of factors, with silica as a participant. Since macrophages that show the presence of silica in chronic exposures are also engulfing lipoprotein and apoptotic cells, it is very possible that the latter load contributes to iNOS increases in the AMs.
Human epidemiologic studies have found that, even after occupational exposure has ended, silicosis may develop or progress (Hessel and Sluis-Cremer, 1987; Hnizdo and Murray, 1998; Hnizdo and Sluis-Cremer, 1993; Kreiss and Zhen, 1996; Miller et al., 1998; Ng et al., 1987), suggesting that in humans there maybe a threshold silica burden above which silica-induced pulmonary disease would progress without further exposure. In a previous silica inhalation study, we were able to reproduce this human response in a rat model (Porter et al., 2004). At that time, we suggested that, if a critical lung burden is exceeded, lung inflammation and damage would progress without further exposure. However, the mechanism(s) responsible for the progression of silica-induced pulmonary disease, despite decreasing silica lung burden, remained to be established. In our current study, we determined that NO and ROS production continue after cessation of silica exposure and thus may, in part, be responsible for disease progression. Furthermore, particulate silica was determined to be highly associated with iNOS in AMs, unlike other particles, such as carbon black (Millecchia, unpublished data) and diesel exhaust particles (Dong et al., 2005), which are not associated with increased iNOS in AMs. Whether the iNOS upregulation is a direct result of silica phagocytosis, or whether other signals are triggering iNOS increases remains to be determined.
Disclaimer: The findings and conclusions in this report are those of the authors and do not necessarily represent the views of the National Institute for Occupational Safety and Health.
References
Allen, R. C. (
Blackford, J. A., Jr., Antonini, J. M., Castranova, V., and Dey, R. D. (
Castranova, V., Dalal, N. S., and Vallyathan, V. (
Castranova, V., Huffman, L. J., Judy, D. J., Bylander, J. E., Lapp, L. N., Weber, S. L., Blackford, J. A., and Dey, R. D. (
Castranova, V., Jones, T. A., Barger, M., Afshari, A., and Frazer, D. G. (
Castranova, V., and Vallyathan, V. (
Dong, C. C., Yin, X. J., Ma, J. Y. C., Millecchia, L., Wu, Z.-X., Barger, M. W., Roberts, J. R., Antonini, J. M., Dey, R. D., and Ma, J. K. H. (
Grisham, M. B., Johnson, G. G., and Lancaster, J. R., Jr. (
Henderson, R. F., Driscoll, K. E., Harkema, J. R., Lindenschmidt, R. C., Chang, I. Y., Maples, K. R., and Barr, E. B. (
Hessel, P. A., and Sluis-Cremer, G. K. (
Hnizdo, E., and Murray, J. (
Hnizdo, E., and Sluis-Cremer, G. K. (
Huffman, L. J., Judy, D. J., and Castranova, V. (
Huffman, L. J., Prugh, D. J., Millecchia, L., Schuller, K. C., Cantrell, S., and Porter, D. W. (
Kreiss, K., and Zhen, B. (
Kuempel, E. D., Attfield, M. D., Vallyathan, V., Lapp, N. L., Hale, J. M., Smith, R. J., and Castranova, V. (
Lapp, N. L., and Castranova, V. (
Millecchia, L., Mercer, R., Schwegler-Berry, D., Willard, P., and Friend, S. (
Miller, B. G., Hagen, S., Love, R. G., Soutar, C. A., Cowie, H. A., Kidd, M. W., and Robertson, A. (
Ng, T. P., Chan, S. L., and Lam, K. P. (
Porter, D. W., Barger, M., Robinson, V. A., Leonard, S. S., Landsittel, D., and Castranova, V. (
Porter, D. W., Hubbs, A. F., Mercer, R., Robinson, V. A., Ramsey, D., McLaurin, J., Khan, A., Battelli, L., Brumbaugh, K., Teass, A., et al. (
Porter, D. W., Millecchia, L., Robinson, V. A., Hubbs, A., Willard, P., Pack, D., Ramsey, D., McLaurin, J., Khan, A., Landsittel, D., et al. (
Porter, D. W., Ramsey, D., Hubbs, A. F., Battelli, L., Ma, J., Barger, M., Landsittel, D., Robinson, V. A., McLaurin, J., Khan, A., et al. (
Porter, D. W., Ye, J., Ma, J., Barger, M., Robinson, V. A., Ramsey, D., McLaurin, J., Khan, A., Landsittel, D., Teass, A., et al. (
Rubbo, H., Radi, R., Trujillo, M., Telleri, R., Kalyanaraman, B., Barnes, S., Kirk, M., Freeman, B. A. (
Scabilloni, J. F., Wang, L., Antonini, J. M., Roberts, J. R., Castranova, V., and Mercer, R. R. (
Sheehan, D. C., and Hrapchak, B. B. (
Vallyathan, V., Castranova, V., Pack, D., Leonard, S., Shumaker, J., Hubbs, A. F., Shoemaker, D. A., Ramsey, D. M., Pretty, J. R., and McLaurin, J. L. (
Author notes
National Institute for Occupational Safety and Health, *Health Effects Laboratory Division, Morgantown, WV 26505 and †Division of Applied Research and Technology, Cincinnati, Ohio 45226

Comments