


Abstract
To properly assign mechanisms or causes for toxic effects of nanoscale materials, their properties and characteristics both outside and within the biological environment must be well understood. Scientists have many tools for studying the size, shape, and surface properties of particulates outside of the physiological environment; however, it is difficult to measure many of these same properties in situ without perturbing the environment, leading to spurious findings. Characterizing nanoparticle systems in situ can be further complicated by an organism's active clearance, defense, and/or immune responses. As toxicologists begin to examine nanomaterials in a systematic fashion, there is consensus that a series of guidelines or recommended practices is necessary for basic characterization of nanomaterials. These recommended practices should be developed jointly by physical scientists skilled in nano characterization and biological scientists experienced in toxicology research. In this article, basic nanoparticle characterization techniques are discussed, along with the some of the issues and implications associated with measuring nanoparticle properties and their interactions with biological systems. Recommendations regarding how best to approach nanomaterial characterization include using proper sampling and measurement techniques, forming multidisciplinary teams, and making measurements as close to the biological action point as possible.
INTRODUCTION
There is a growing consensus that complete and accurate particle characterization is an essential part of assessing the potential toxicity of nanoparticles in biological systems (Royal Society, 2004; Hood, 2004). Proper characterization of test materials is important to ensure that results are reproducible, and also to provide the basis for understanding the properties of nanoparticles that determine their biological effects. Because key parameters affecting biological activity of nanoparticles are largely unknown at this point, the characterization of test materials must be comprehensive and broad in scope. A study conducted with material that has not been characterized with respect to a property later found to be critical for toxicity will ultimately be of little value.
Complete characterization of nanoparticles includes such measurements as size and size distribution, shape and other morphological features (e.g., crystallinity, porosity, surface roughness), chemistry of the material, solubility, surface area, state of dispersion, surface chemistry, and other physicochemical properties. Exhaustive characterization of test materials is time consuming, expensive, and complex. To some extent, the characterization required depends on the objectives of the study. However, there are a number of fundamental properties that researchers in the field generally agree must be addressed (Bucher et al., 2004; Oberdorster et al., 2005a, 2005b). This subset forms the basis of a minimum set of characteristics that should be measured for test materials used in nanotoxicity studies. These include size and shape, state of dispersion, physical and chemical properties, surface area, and surface chemistry. In the following sections, each of these characteristics is considered, along with analytical techniques for their measurement.
CHARACTERIZATION METHODS
Particle Size Distribution and Shape Information
Experience with particles of micron size and larger indicates that size and shape can influence toxicity by affecting site(s) of deposition, clearance from the body, and biological responses such as inflammation. Although there are few systematic studies of the influence of size and shape on biological effects of nanoscale particles, presumably particle size and shape are important at nanoscale as well.
The definition of a nanoscale material or nano particle has been generally agreed on to include any material with at least one dimension smaller than 100 nm. The lower boundary demarcating nanoscale from the molecular has been defined generally in the area between 0.2 nm and 1.0 nm, but this is not yet agreed on (Roco, 2001; Royal Society, 2004).
Definition of size.
Particle systems are only occasionally perfect spheres, and even less often are monodispersed. Nevertheless, in the particle technology community, particle size is most often defined as the diameter of a sphere that is equivalent in the selected property to the particle measured. This “equivalent sphere” model makes it possible to conveniently plot size distributions of irregularly shaped systems using a single value (diameter) along a single axis. The property most often described is volume; that is, the diameter of a sphere of equal volume to the particle(s) in question—or volume diameter. (Note: There are other equivalent spheres such as aerodynamic diameter [diameter of a spherical particle with equivalent aerodynamic behavior], sedimentation diameter, hydrodynamic diameter, etc. [Allen, 2004a; NIST 960–1, 2001; BSI, 2005].)
Size distributions are normally depicted as a log-normal histogram with particle diameter on the abscissa and the quantity of particles in a given size class on the ordinate (Allen, 2004a; ISO, 2003). The selection of size classes is arbitrary, but most instrument manufacturers use geometrically increasing bins. The quantity axis can depict any property, but most often it is selected to represent the relative volume of particles, the relative number of particles, or the calculated surface area of the particles in each size class. Unless particle density varies with size, volume distributions are equivalent to mass distributions (ISO, 2003). Figure 1 illustrates how different a particle size distribution might appear if depicted as a number- or area-based distribution, rather than a volume-based distribution. By viewing only one depiction of the data, researchers may make erroneous conclusions regarding the breadth of the distribution or the state of agglomeration of this system. Multiple sizing techniques (especially microscopy) are also helpful to resolve these ambiguities.
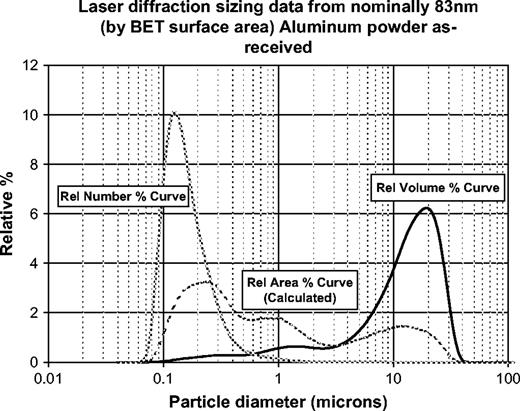
Laser diffraction size data for “nanoscale” aluminum powder used for in vitro toxicity experiments. Note the apparent difference in size when depicted as a number distribution versus an area or volume distribution. This occurs because volume scales as the cube of the particle diameter and calculated area scales as the square. Each curve, if presented by itself, would give an incomplete picture of the particle size distribution/state of agglomeration of the sample. The three curves will overlay only for an ideal spherical, monodisperse, unagglomerated system.
Measuring size and shape.
There is a wide variety of methods for determining nanoparticle size distributions, including light scattering, differential mobility analysis, time of flight mass spectroscopy (TOF-MS), microscopy, and surface area measurements, among many others. Guidelines for selecting and conducting these measurements are available from a variety of sources, including national and international standards organizations (International Standards Organization [ISO], American Society for Testing and Materials [ASTM], United States Pharmacopeia [USP]). The ISO develops and writes standard practices addressing over 10 different physical principles used for the measurement of particle size. At least six of these are applicable for size measurement into the sub-100-nm range. Determination of the primary size distribution of a sample requires a well-dispersed system and measurement of enough particles to achieve statistical reliability. For a monodisperse system, the latter requirement is relatively easy to meet. However, as polydispersity increases, it becomes necessary to measure a progressively larger number of particles to accurately portray the size distribution (Masuda, 1971). For nanoscale particles in an aqueous environment, an ensemble method of measurement such as centrifugal sedimentation or laser or dynamic light scattering is normally preferred, but this may not be practical, or the system may be difficult to maintain in a dispersed state. For dry as-received powders, differential mobility analysis can be used for dispersed material, or BET (Braunauer, Emmett, and Teller) surface area can provide an estimated average size based on a nonporous spherical model. The latter method has the added advantage of providing a direct measurement of specific surface area (SSA) and micro- or meso-porosity, both of which are key properties of interest.
Microscopy is one of the most powerful techniques and is often relied on exclusively to provide valuable information regarding size, shape, and morphology. For nanoparticles, electron microscopy is normally required to capture images with the necessary resolution, and it is the only technique that provides reliable information regarding shape at this scale. However, the microscopist should ensure that enough particles are examined to provide a statistically valid representation of the full size or shape distribution. This can be very difficult and time consuming, and may require the image analysis of literally thousands of individual particles. There are many commercial automated image analysis systems and computer software packages that are used for this purpose. However, care should be taken to validate the system used against standardized materials and sample preparation techniques. The quality of the images presented to these systems is of critical importance to their performance. It should also be noted that electron microscopy normally provides only two-dimensional images, so care must be taken to avoid bias introduced by orientation effects. High-resolution microscopy is subject to artifacts caused by sample preparation or special analysis conditions. For example, high-resolution transmission electron microscopy (TEM) requires high vacuum and thin sample sections or particles of limited diameter to enable the electron beam to penetrate through the sample. Tissue sample preservation, fixation, and staining require skill to preserve detail and to avoid introduction of artifacts. For a more complete treatment of microscopy techniques, the reader is referred to the many excellent texts in this area (Williams and Carter, 1996; Bozzola and Russell, 1992). Quantification of shape data can be complex, as there are numerous ways to express shape information and little standardization of definitions. It is important to emphasize that multiple techniques should be used wherever possible to develop a more complete understanding of particle characteristics. This is particularly important with respect to particle sizing and dispersion.
Size and shape measurement in the biological environment.
It is important to recognize that particle or agglomerate size distribution can, and often does, change as a material is prepared and used in toxicology studies. The size and shape of the material interacting with an organism may differ dramatically from its original form. Consider particles produced from an aerosol particle generator for animal inhalation studies. Upon creation, particles begin to agglomerate according to their size, concentration, temperature, residence time, pressure, and a variety of other conditions. Hard aggregates may be formed through viscous or chemical sintering; fine particles may adhere to surfaces because of static charges or thermal diffusion, and large particles may settle out of the gas. Thus, the size distribution “as dosed” might be quite different from that of “as-generated” or “as-received” material.
The vehicles by which nanoparticulates are administered also require special consideration. There are several issues associated with dosing animals or cell cultures. Is the vehicle realistic in terms of actual exposure conditions? Are we interested in primary particle interactions or agglomerate interactions? Should we create artificial conditions (e.g., add surfactants or alter pH) in order to present dispersed particles to the organism? How can we avoid changing the surface characteristics of the particles? One such issue involves the use of intratracheal instillation for animal studies instead of inhalation of aerosols (Warheit et al., 2005). There are no definitive answers to these questions. The best we can do is carefully consider the implications of the mode of administration, attempt to be realistic in terms of exposure conditions, and make the best measurements possible.
Where size and shape measurements should be made.
There are three forms in which particle size characterization should be addressed. The first form is the “as-received” powder. This is perhaps the most straightforward measurement, but as any particle scientist will attest, it is often not easy. The second form is the material “as-dosed” or “as-exposed.” Any experimental data will be of limited use if details regarding this form are undefined. The third form is at the point(s) of interaction within the organism. This is the most difficult measurement, because invasive techniques usually cannot be used without compromising the integrity of the organism and possibly invalidating the test. Although potentially confounded by issues of artifacts, insufficient statistical reliability, and difficulties in interpretation, an indirect way of assessing this form is through post-mortem evaluation, examining the size and shape distribution of particles in cells, tissues, and organs after exposure.
All methods of size analysis are subject to a variety of pitfalls, and the analyst should be knowledgeable and skilled in the techniques employed. Multiple techniques should be used wherever possible to develop a more complete understanding of the system. Table 1 shows a number of techniques used to measure particle size in the nanometer range, along with advantages, disadvantages, and an appraisal of their usefulness in exposure media (aerosols and biological fluids).
Ensemble Particle Sizing Techniques Applicable to Sub-100 nm Particle Systems
As-dosed | ||||||
|---|---|---|---|---|---|---|
| Sizing technique | Nominal size range | Advantages | Disadvantages | Suspension in biological fluid | Aerosol | |
| Dynamic light scatteringa,b | 4 nm–6 μm | Ensemble method, can also be used for zeta potential | Less reliable as size distribution broadens | Yes | Maybe | |
| Centrifugal sedimentationa,b | 5 nm–10 μm | Good for broad size distributions | Cumbersome | Yes | No | |
| Laser diffraction/Static light scatteringb | 40 nm–3 mm | Broad dynamic range—wet or dry measurements | Assumes spherical particles; shape effects unknown | Yes | Yes | |
| Low pressure impacter and electrical low Pressure Impactor (ELPI)g | 20 nm – 10 μm | Measures aerodynamic diameter | Dry low pressure technique, small sample sizes | No | Yes | |
| Scanning/differential mobility analysisb | 2 nm–2 μm | Good for size distributions | Dry low pressure technique, small sample sizes | No | Yes | |
| Field flow fractionationb | 2 nm–200 μm | Good resolution of size distributions | Must be used in conjunction with other techniques (e.g., light scattering) | Yes | No | |
| Size exclusion chromatographyc,d | 1 nm–2 μm | Good resolution, small sample volume | Slow; requires good calibration | Yes | No | |
| Acoustic Techniquese | 20 nm–10 μm | Good for concentrated systems | High concentration required (>1wt%), poor resolution | Yes | No | |
| Electron microscopya,f | 0.3 nm– several microns | Good resolution and imaging | Artifacts from sample preparation and vacuum | Possible with cryo-techniques | No | |
| Time of flight Mass spectroscopyg | 1 nm–3 μm (100 to >100MDa) | Can be used with laser ablation for particle chemical composition analysis | Expensive; sampling difficult; multiple detectors required for full range | No | Yes | |
| Atomic force microscopyb | 5 nm–several mirons | Good resolution and 3-D imaging (wet or dry) | Can only see surface; prone to tip- induced artifacts; tedious | Maybe | No | |
| Specific surface areah (BET, titration, diffusion charging) | 5 nm–several microns | Straightforward and applicable to most systems. | Particle size is estimated based on monodisperse spherical assumption with no porosity | Titration techniques only | Yes (diffusion charging) | |
aBootz et al. (2004); bJillavenkatesa and Kelly (2002); cFritz et al. (1997); dBootz et al. (2005); eDukhin et al. (1999); fSjostrom et al. (1995); gBorchert et al. (2005); hLowell et al. (2004); Burtscher (2005).
State of Dispersion
Definition of dispersion.
The state of dispersion of nanoparticle systems refers to the relative number (or mass) of primary (single) particles in a suspending medium in comparison to agglomerates (clusters of primary particles held together by weak forces) (BSI, 2005). These agglomerates may be formed directly from attractive inter-particle forces (e.g., Van der Waals and hydrophobic interactions) or through the binding of adsorbed molecules (e.g., polymers, proteins, polysaccharides). The state of dispersion is one of the most important characteristics of a nanoparticle system, yet it is one of the most difficult to quantify.
Measurement of state of dispersion or agglomerate size.
In polydisperse systems, it is often difficult to differentiate between primary particle size distribution and agglomerate size. In liquids, the dispersion of nanoparticle systems is controlled by an intricate balance of surface and intermolecular forces involving particle–particle interactions, as well as those between the particles and their environment. Slight perturbations in solution properties such as pH, ionic strength, and concentrations of molecular constituents can significantly alter the dispersion of nanoparticle systems. Consequently, the state of dispersion is dynamic and determined primarily by the environment of the nanoparticles. For dry aerosolized powders, the situation can be even more complex as the concentration and diffusion characteristics of the aerosol can cause the state of dispersion to change over time.
The state of dispersion is typically assessed using comparative particle size measurements. This requires a reliable method of measuring the baseline primary particle size distribution or “fully dispersed size distribution” of the material. Shear, sonication, and dispersion aids or surfactants are commonly used to disperse wet nanoparticulate systems. These are acceptable tools to probe as-received powders, but they may damage cells and interfere with toxicity testing if used in living systems. Dispersion of dry aerosol nanosystems is even more problematic, and it is normally not possible to achieve a “fully redispersed” dry aerosol once a dry nanopowder has aggregated.
By comparing changes in particle size distribution to that of an “ideal” dispersion, a qualitative assessment of the degree of agglomeration can be made. One such method, the average agglomeration number (AAN), is derived from the ratio of the volume based median particle size to the average equivalent spherical volume derived from BET gas adsorption (NIST 960–3, 2001). Agglomeration rate and strength (or floc strength) studies should be pursued when there is evidence of agglomerate-induced effects. Experimental protocols for these experiments have been reviewed elsewhere (Jarvis et al., 2005).
Measurement of dispersion in the biological environment.
Assessing the degree of dispersion in the biological environment is a function of the ability to make size distribution measurements. Size distribution measurements are feasible in simulated biological fluids, but there are few techniques available to directly measure agglomerate size in living cells or tissues. Post-mortem microscopy is the primary technique for qualitatively assessing the state of dispersion. For example, Figure 2 shows a TEM micrograph of aluminum nanoparticles inside an endosome. Individual particles and agglomerates can be resolved, but it is still unclear whether agglomeration took place before or after particle uptake by the cell.
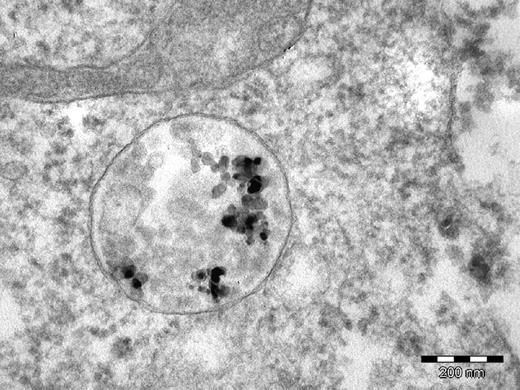
Aluminum nanoparticles inside an endosome of an A549 cell from an in vitro toxicity experiment.
Physical and Chemical Properties
Physical and chemical properties include a wide range of particle characteristics, such as elemental composition, density, crystal structure, chemical reactivity, solubility, and physical constants such as conductivity, melting point, hardness, and optical properties. For many nanoparticles, these properties are the same or similar to the properties of the material in conventional scale. However, one of the principal reasons that nanoparticles are of interest is the propensity for some of these properties to change as particle size decreases, generally to below 100 nm, and particularly below about 10 nm.
There are several reasons why this change in physical and chemical behavior can occur. First, various thermodynamic properties may be altered by the nanoparticle's high radius of curvature and high surface area and surface free energy. Second, quantum confinement and tunneling can lead to size-dependent electro-optical phenomena. Finally, there is the simple fact that, as particles decrease in size, the proportion of atoms found at the particle's surface increases dramatically. For example, approximately 50% of the mass of a 3-nm silica particle consists of surface atoms that differ in chemistry and physical properties from the atoms that comprise the particle's interior. In some nanomaterials, such as single-wall carbon nanotubes and fullerenes, virtually every atom in the particle is exposed on the surface.
Measurement of physical and chemical properties.
The physical and chemical properties of nanoparticles can be measured through a variety of standard techniques. Typically, the researcher will already have some idea of how the properties of nanoparticles deviate from those of conventional forms, as it is these properties that make the materials interesting. For example, quantum dots exhibit quantum confinement and unusual optical properties, carbon nanotubes exhibit novel mechanical and electrical properties, and nano-aluminum particles exhibit increased reactivity over larger-scale materials of the same elemental makeup. If it has been previously demonstrated that the conventional physicochemical properties of the material are unchanged at the size range of interest, it is often acceptable to use literature or manufacturer's values for most physiochemical properties. When in doubt, however, the property should be measured.
Physical and chemical properties in the biological environment.
Physicochemical properties of materials often do not change in the biological environment. For example, it is thought that inert organic and inorganic particles tend to retain their crystal structure and other properties, although there is recent evidence that surface crystallinity may change in an aqueous environment (Zhang et al., 2003). Solubility and chemical reactivity are a function of both the particle and the environment, and therefore should be measured under conditions as close to the biological environment as possible. This can sometimes be accomplished by measuring these properties using ex vivo physiological fluids or in vitro solutions simulating conditions found in the organism.
Surface Area and Porosity
Interactions between nanomaterials and biological organisms typically take place at the particle's surface; therefore, surface area is of primary importance in determining possible toxic effects. Indeed, several investigations have shown that the biological consequences of insoluble nanoparticle exposures scale with surface area rather than mass (Brown et al., 2001; Donaldson et al., 1998, 2002; Oberdorster et al., 1992; Tran et al., 2000). For this reason, it is recommended that the specific surface area (e.g., m2/g) of the dosed particles always be reported. The geometric surface area is a function of the number and shape of particles and square of the particle diameter. As particles become smaller, the specific surface area (usually expressed as m2/g) increases rapidly, and it is not unusual for nanomaterials to have geometric specific surface areas in the hundreds of square meters per gram. The generation of reactive oxygen species, rate of dissolution, equilibrium solubility, etc., can be dramatically enhanced by such large surface areas.
Definition of surface area and porosity.
Surface area is the area of the material that is exposed to the environment or, alternatively, the interfacial area of the material. Surface area can be external (geometric surface area) as well as internal if the material is porous. Microporous or mesoporous powders exhibit much higher surface areas than nonporous powders. Materials with pores less than 2 nm are generally considered to be microporous. Pores between 2 nm and 50 nm are termed mesopores. Although rarely applicable to nanoparticles, pores 50 nm and above are called macropores and require different techniques to quantify.
Measurement of surface area.
The surface area for nanoparticles is normally measured through gas adsorption using the BET method or other theoretical treatments (Webb et al., 1997; Allen, 2004b). Measurement of surface area by gas adsorption is a high vacuum method and requires a clean, dry sample of the nanomaterial. Nitrogen is the most common adsorbate, although many other gases such as argon, carbon dioxide, or krypton are also used. Because of the small size of the adsorbate molecules, the measured surface area is only marginally affected by the degree of agglomeration. Porosity is measured using the same principle, although special techniques and higher vacuum are required for micropore analysis. Other methods for measuring or estimating surface area include surface titrations (wet chemical) and aerosol diffusion chargers (Burtscher, 2005).
Surface area and porosity in the biological environment.
The effective surface area and porosity of nanoparticles in the biological environment can change as the result of adsorption of biomolecules or agglomeration. Measuring the surface area or porosity in the biological environment is limited to solution techniques conducted under simulated physiological conditions. Some estimate of surface area is possible if the size and shape of particles can be quantified by microscopy or other techniques (Maynard, 2003).
Surface Chemistry
Definition of surface chemistry.
Surface chemistry consists of a wide variety of properties that govern the way in which particles interact with their environment, in this case, the biological environment. Surface chemistry includes elements of solubility equilibrium, catalytic properties, surface charge, surface adsorption and desorption of molecules from solution, etc. Most of these properties are functions of the atomic or molecular composition of the surface and the physical surface structure. It is important to note that the surface chemistry of particles can change in a variety of ways, particularly through the adsorption or coating of the particles with proteins or other species from the biological fluid surrounding them. Particle coatings in particular are problematic, because details such as the coating thickness, continuity, homogeneity, and persistence must all be considered. Quantifying these characteristics can be quite difficult.
Measurement of surface properties.
It is not practical to characterize the full spectrum of surface properties for every nanoparticle system, although at a minimum, some effort should be made to assess the surface composition and structure of the nanoparticle, the surface energy (wettability), surface charge or zeta potential, reactivity, and the presence and chemical nature of any adsorbed species. These should be accomplished both as-received and on the materials as close to physiological conditions as practical. When possible, measurements should also be performed on the particles after exposure. It is also suggested that a sample of the particles (as-received and as-dosed) be stored under stable conditions (e.g., under argon gas for dry powders, or frozen for the preservation of particle suspensions) for future analysis. Table 2 lists several common methods for the physical analysis of surfaces.
Common Surface Analysis Techniques Applicable to Sub-100 nm Particle Systems
Techniques | Sample volume required | Penetration depth* | Applications | Limitations |
|---|---|---|---|---|
| AESa | μg–mg | 1–5 nm | Surface composition | Insulators cannot be used due to significant charging, surface damage, HV-UHV |
| EELS, HREELSb | <μg | Few nm | Surface composition and elemental mapping | Done with TEM and thus requires thin sections, HV–UHV |
| SEMc | mg | Microns | Surface morphology | Sample charging, HV–UHV |
| SIMSd | μg–mg | Few Å | Surface elemental analysis with depth profiling | Not quantitative, surface damage, low mass resolution, HV–UHV |
| TEM, HR-TEM, STEMb,d | <μg | <100 μm | Local structure and morphology | Sample preparation difficult, e-beam can damage organic materials,HV–UHV |
| XESe | Few mg | Few Å | Surface composition | HV–UHV |
| XPS, ESCAf | μg–mg | 1–5 nm | Surface chemical analysis | Poor spatial resolution, not suitable for trace analysis, HV–UHV |
Penetration depth of radiation source; AES—auger electron spectroscopy; EELS—electron energy loss spectroscopy; HREELS—high resolution electron energy loss spectroscopy; SEM—scanning electron microscopy; SIMS—secondary ion mass spectroscopy; TEM—transmission electron spectroscopy; HR-TEM—high resolution TEM; STEM—scanning TEM; XES—x-ray emission spectroscopy; XPS—x-ray photoelectron spectroscopy; ESCA—electron spectroscopy for chemical analysis; HV—high vacuum; UHV—ultra high vacuum.
Surface composition.
The molecular composition and structure of the surface of nanoparticles will ultimately define its chemistry. It is often difficult to directly measure the atomic composition of surfaces because many of these systems are subject to trace surface contaminants that may not be detectable by general chemical analysis. Electron spectroscopy for chemical analysis (ESCA), x-ray photoelectron spectroscopy (XPS) and secondary ion mass spectroscopy (SIMS), in particular, have been extensively used for characterizing nanoparticles as well as correlating biomaterial surface properties to physiological endpoints (Ratner, 1996). These techniques are equally applicable to nanoparticle surface examination post-exposure; however, the washing and removal of biomolecules from the surface of the particles is likely to be a necessary step. Care must be taken to prevent or identify artifacts from this process.
Surface energy/wettability.
The surface energy and wettablity of nanoparticle systems are particularly important for understanding nanoparticle aggregation, dissolution, and bioaccumulation. In the biomaterials community, the role of surface energy in implant biocompatibility has been recognized for several decades (Ratner, 1996). The surface energy of nanoparticle systems can be measured through heat of immersion microcalorimetry studies or through contact angle measurements with various liquids. Multiple theories for deriving surface energy can potentially be used, such as those devised by Zismann, Van Oss, and Folkes (Neumann and Spelt, 1996).
Surface charge.
The surface charge of nanoparticles is important for two reasons: (1) it is a major factor in determining the particle dispersion characteristics and (2) it will influence the adsorption of ions and biomolecules, which may change how cells “see” and react to the particles. Classically, the surface charges of particle systems are approximated through zeta potential measurements (Adamson and Gast, 1997). The zeta potential is a function of the surface charge of the particle, adsorbed species on its surface, and the composition and ionic strength of the surrounding solution. Zeta potential measurements are normally performed in pure water with a small amount (1–10 mM) of monovalent background electrolyte. A titration is used to find the isoelectric point (IEP), defined as the pH where the zeta potential is zero. Typically, the IEP of a material under controlled conditions should be reported in addition to the zeta potential (sign and magnitude) under anticipated physiological conditions (pH and ionic strength). Zeta potentials of nanoparticles are typically measured by light-scattering electrophoresis or electro-acoustophoresis methods. Potentiometric titrations can also be used to acquire surface charge information. In particular, the pKa values of particle surface functional groups can be determined along with information on surface charge density.
Surface reactivity.
The surface reactivity of nanoparticles can be measured through comparative microcalorimetry, via the use of probe molecules that are monitored for either degradation or changes in oxidative state, or through a number of electrochemical methods. All of these techniques can potentially be used to monitor particle reactivity in biological fluids, although artifacts and losses in sensitivity are likely. The choice of method will depend on the types of molecular transformations that occur at the particle surface.
Adsorbed species.
Nanoparticles will adsorb proteins, resulting in changes to the surface of the particle as well as changes in the structure and activity of the adsorbed protein (Jiang et al., 2005; Mueller et al., 2001; Vertegel et al., 2004). Protein/biomolecule adsorption has traditionally been measured through the use of radiolabeled molecules; however, this approach is limited to certain classes of biomolecules (Ratner, 1996). In recent years, mass spectroscopy (e.g., matrix assisted laser desorption ionization microscopy/microscopy [MALDI-MS/MS]) has become widely used for this type of study.
CONCLUDING REMARKS
The characterization of particles is not a new problem. Particle scientists have dealt with the issue for decades and have developed many recommended practices that are recorded in literature, texts, and national and international standards (e.g., ISO technical committees, ASTM). Many of these practices have been adapted for difficult measurement environments similar to those facing the toxicology community. Years of experience have resulted in five general rules for approaching basic particle characterization:
Because of the large number of particles in a given mass of a nanoparticle system, it is imperative that the sample of particles measured be representative of the material. This is the foremost principle of particle characterization. The broader the size distribution, the more significant the errors will be if the sample is not representative.
Primary particle size and shape characteristics should be measured in the most dispersed state achievable.
The most appropriate physical principle of measurement and instrumentation should be selected for the intended application.
Enough particles must be measured to ensure that the desired limits of precision and accuracy are achieved. For broad particle size distributions, this may amount to tens of thousands of particles.
The particle characteristics should be measured under conditions as close to the point application as possible. For toxicology studies, this should include, if possible, the biological environment. For example, if in vitro cell studies are being conducted, the particle size should be measured in cell culture media or at least under the same pH and ionic strength conditions.
The underlying mechanisms in nanotoxicology need to be identified in order to anticipate and prevent widespread exposure to potentially harmful nanomaterials. For this to be achieved, detailed physical and chemical characterization of these nanomaterials is imperative. We have briefly addressed several nanoparticle attributes that may influence their toxicological properties and have identified techniques and protocols that can be used for their evaluation. Regardless of the technique applied, careful consideration should be given to sample preparation procedures, equipment limitations, and measurement protocols to ensure that reliable data are obtained. When possible, relevant national and international standardized practices should be consulted as guides for performing measurements. Several national and academic centers can be contacted for assistance in characterization. In particular, the National Nanotechnology Infrastructure Network (NNIN, 2005) has been established by NSF and the Nanotechnology Characterization Laboratory by NIH (NCI, 2005) to aid researchers with nanocharacterization issues. Finally, the formation of multidisciplinary collaborations between toxicologists, physical scientists and engineers is an essential element in developing reliable techniques and protocols for developing a complete picture of particle characteristics and effects on biological organisms.
References
Allen, T. (
Allen, T. (
Bootz, A., Russ, T., Gores, F., Karas, M., and Kreuter, J. (
Bootz, A., Vogel, V., Schubert, D., and Kreuter, J. (
Bozzola, J. J., and Russell, L. D. (
Brown, D. M., Wilson, M. R., MacNee, W., Stone, V., and Donaldson, K. (
BSI PAS 71:25. (
Bucher, J., Masten S., Moudgil B., Powers K., Roberts S., and Walker N. (
Burtscher, H. (
Chakraborty, B. R., Haranath, D., Chander, H., Hellweg, S., Dambach, S., and Arlinghaus, H. F. (
Donaldson, K., Li, X. Y., and MacNee, W. (
Donaldson, K., Brown, D., Clouter, A., Duffin, R., MacNee, W., Renwick, L., Tran, L., and Stone, V. (
Duffin, R., Gilmour, P. S., Schins, R. P., Clouter, A., Guy, K., Brown, D. M., MacNee, W., Borm, P. J., Donaldson, K., and Stone, V. (
Dukhin, A. S., Shilov, V. N., Ohshima, H., and Goetz, P. J. (
Fritz, H., Maier, M., and Bayer, E. (
Guo, J. (
ISO 9276 (
Jarvis, P., Jefferson, B., Gregory, J., and Parsons, S. A. (
Jiang, X., Jiang, J., Jin, Y., Wang, E., and Dong, S. (
Jillavenkatesa, A., and Kelly, J. F. (
Kim, S. H., Jeong, J. H., Chun, K. W., and Park, T. G. (
Lowell, S., Shields, J. E., Thomas, M. A., and Thommes, M. (
Masuda, H. I. K. (
Maynard, A. (
Mueller, W. G., Walker, D., Hager, G. L., and McNally, J. G. (
NIST 960-1. (
NIST 960-3, (
NNIN (
Oberdorster, G., Ferin, J., Gelein, R., Soderholm, S. C., and Finkelstein, J. (
Oberdorster, G., Oberdorster, E., and Oberdorster, J. (
Oberdorster, G., Maynard, A., Donaldson, K., Castranova, V., Fitzpatrick, J., Ausman K., Carter, J., Karn, B., Kreyling, W., Lai, D., et al. (
Park, S. H., Oh, S. G., Mun, J. Y., and Han, S. S. (
Ratner, B. D. (
Roco, M. C., (
The Royal Society. (
Sjostrom, B., Kaplun, A., Talmon, Y., and Cabane, B. (
Tran, C. L., Buchanan, D., Cullen, R. T., Searl, A., Jones, A. D., and Donaldson, K. (
Unterhalt, H., Rupprechter, G., and Freund, H. J. (
Vertegel, A. A., Siegel, R. W., and Dordick, J. S. (
Warheit, D. B., Brock, W. J., Lee, K. P., Webb, T. R. and Reed, K. L., (
Webb, P., and Orr, C. (
Williams, D., and Carter, C. (
Author notes
*Particle Engineering Research Center, University of Florida, Gainesville, Florida 32611; †Department of Materials Science and Engineering, University of Florida, Gainesville, Florida 32611; and ‡Center for Environmental and Human Toxicology, University of Florida, Gainesville, Florida 32611

Comments