


Abstract
Hyperspectral reflectance tools have been used to detect multiple pathogens in agricultural settings and single sources of infection or broad declines in forest stands. However, differentiation of any one disease from other sources of tree stress is integral for stand and landscape-level applications in mixed species systems. We tested the ability of spectral models to differentiate oak wilt, a fatal disease in oaks caused by Bretziella fagacearum ``Bretz'', from among other mechanisms of decline. We subjected greenhouse-grown oak seedlings (Quercus ellipsoidalis ``E.J. Hill'' and Quercus macrocarpa ``Michx.'') to chronic drought or inoculation with the oak wilt fungus or bur oak blight fungus (Tubakia iowensis ``T.C. Harr. & D. McNew''). We measured leaf and canopy spectroscopic reflectance (400–2400 nm) and instantaneous photosynthetic and stomatal conductance rates, then used partial least-squares discriminant analysis to predict treatment from hyperspectral data. We detected oak wilt before symptom appearance, and classified the disease with high accuracy in symptomatic leaves. Classification accuracy from spectra increased with declines in photosynthetic function in oak wilt-inoculated plants. Wavelengths diagnostic of oak wilt were only found in non-visible spectral regions and are associated with water status, non-structural carbohydrates and photosynthetic mechanisms. We show that hyperspectral models can differentiate oak wilt from other causes of tree decline and that detection is correlated with biological mechanisms of oak wilt infection and disease progression. We also show that within the canopy, symptom heterogeneity can reduce detection, but that symptomatic leaves and tree canopies are suitable for highly accurate diagnosis. Remote application of hyperspectral tools can be used for specific detection of disease across a multi-species forest stand exhibiting multiple stress symptoms.
Introduction
Plant pathogens that infect trees have had devastating impacts in the forests of North America and globally. The oak genus (Quercus), in particular, which comprises nearly 30% of forest biomass in the USA and Mexico (Cavender-Bares 2019), is a host to multiple pathogens. Oak wilt, caused by the fungus Bretz (de Beer et al. 2017) and considered one of the most destructive threats to oak trees in the USA (Wilson 2005), can be effectively controlled when detected early (Juzwik et al. 2011). Hyperspectral methods of plant stress detection have proven successful in detecting tree decline or pathogen infections in agricultural settings (e.g., Pontius et al. 2005a, 2005b, 2008, Zarco-Tejada et al. 2018). However, we have yet to differentiate specific diseases from other causes of forest tree decline, limiting the scope of current methods.
Hyperspectral methods can be used to measure complex biological signals or processes, including species identification from leaf reflectance (Cavender-Bares et al. 2016) and changes in physiological function and water status (Serbin et al. 2012, Barnes et al. 2017, Cotrozzi et al. 2017). Foliar infections in the leaves of poplars and oaks have been shown to cause declines in photosynthesis and increases in volatile compound emissions (Copolovici et al. 2014, Jiang et al. 2016), which are detectable using known spectral indices (Peñuelas et al. 2013). In agricultural settings, hyperspectral measurements and classification are deployed in pathogen detection for precision agriculture (Mahlein et al. 2018), diagnosing and differentiating among multiple foliar pathogens in sugar beets (Rumpf et al. 2010) and among multiple pathogens and nutritional deficiencies in avocado groves, even when symptoms are similar in appearance (Abdulridha et al. 2018, 2019). Infections of the bacterium Xylella fastidosa were detected in olive groves in advance of visual symptoms with greater than 80% accuracy, using a combination of spectroscopic data, thermal stress indicators and high-resolution fluorescence linked to photosynthetic traits (Zarco-Tejada et al. 2018). In forest stands, measurements of decline due to single pathogens have been very successful using multiple remote sensing approaches (Pontius et al. 2005a, 2005b, 2008, Pontius and Hallett 2014, Hanavan et al. 2015). Aerial color infrared imagery was used for detection of oak wilt-infected trees among healthy oaks in known infection pockets (Everitt et al. 1999). However, spectral evidence of stress responses due to different causes can be quite similar (Carter and Miller 1994), complicating detection; in a drought and oak wilt-inoculation factorial design, water and greenness indices were not significantly different between treatments (Weissling et al. 2005). Explicitly testing the ability to differentiate oak wilt from other stresses, within multiple species, is integral to advance our understanding of methods of spectral detection of disease.
The physiological processes of change in oaks that are infected by oak wilt are not completely understood. Occlusion of xylem vessels, from both accumulated fungal metabolites and tyloses formed by the plant to impede pathogen spread, contributes to hydraulic dysfunction and leaf wilt (Marchetti 1962, Jacobi and MacDonald 1980, Juzwik et al. 2011, Yadeta and Thomma 2013). Fungal toxins and host responses alter leaf growth and structure, disrupt cell integrity and eventually lead to leaf necrosis and loss (Wilson 2005). Oak species of the red oak section (Lobatae), including Quercus ellipsoidalis and Quercus rubra, appear to have inefficient immune responses (sensuYadeta and Thomma 2013) compared with white oaks (Quercus, e.g., Quercus macrocarpa, Quercus alba) (Jacobi and MacDonald 1980, Juzwik et al. 2011). Rapid translocation of spores in the larger diameter vessels of red oaks occurs before the plants have formed adequate tyloses, leading to broader stem infection and more hyphal growth within the plant (Jacobi and MacDonald 1980, Kozlowski and Winget 1963). Complete crown wilt in red oak species may occur within as little as 4 weeks of tree infection (Juzwik et al. 2011). By contrast, white oaks form more effective tyloses and other blockages early in response to infections and have anatomical differences, like isolated groupings of xylem vessels, that halt the spread of infection (Marchetti 1962, Kozlowski and Winget 1963, Jacobi and MacDonald 1980). Oak wilt infections are often compartmentalized within branches of white oaks and infected trees may persist for years with only partial canopy effects (Juzwik et al. 2011). Differences in species disease response and symptom progression may require different approaches in spectroscopic diagnosis.
Symptoms of oak wilt may superficially appear like that of other abiotic stresses, especially drought, or of other oak pests or pathogens, despite differences in the physiological effects of these stresses. The incidence of many of these stresses may increase with changes in climate. Bur oak blight, caused by Tubakia iowensis (T.C. Harr. & D. McNew) infections in the white oak Q. macrocarpa, leads to leaf wilt and eventual discolored scorching, and confusion with oak wilt is possible until the advanced disease stages of bur oak blight are exhibited (Harrington et al. 2012). Bur oak blight appears to only cause mortality in some genotypes (Pokorny 2017), yet the wetter spring conditions that are currently observed and forecast for much of the Q. macrocarpa range may increase the infection potential and virulence of bur oak blight (Swanston et al. 2018). Drought stress, in the absence of pathogen infection, can cause hydraulic dysfunction, leaf desiccation and leaf wilting patterns that can be mistaken for oak wilt. Lengthened drought seasons may cause shifts in forest structure, leaving more trees dying from drought (Swanston et al. 2018), and red oak species are particularly vulnerable to drought mortality in the central and southern USA (Allen et al. 2010). With earlier spring warming, the sap feeding beetles that can spread oak wilt are active and potentially spreading the fungus prior to seasonal tree-cutting restrictions, an important method of reducing above-ground spread (Jagemann et al. 2018). Because oak wilt primarily spreads via conidia in the sap stream of grafted roots, management requires root severing and stem removal. As oak populations are already in decline in much of the central and eastern USA (Fei et al. 2011), limiting the impact of oak wilt on oak communities requires rapid methods that identify oak wilt and reduce false positives.
Here we ask: (i) Can we accurately differentiate oak wilt from drought, bur oak blight and healthy plants? (ii) Can we detect oak wilt at early infection stages? (iii) Are there spectral regions uniquely associated with, or diagnostic of, oak wilt? (iv) Are physiological changes in response to drought and pathogen inoculation associated with spectroscopic changes in leaves and canopies? We established seedling experiments, with controls, using northern pin oak (Q. ellipsoidalis ``E.J. Hill'') and bur oak (Quercus macrocarpa ``Michx.''), and either inoculated the plants with B. fagacearum or T. iowensis, or subjected the plants to chronic drought. We measured leaf and canopy hyperspectral reflectance, leaf water potential and instantaneous gas exchange rates, and monitored stress symptoms throughout the experiment from treatment imposition to advanced drought or disease stages.
Materials and methods
Experimental design
We performed two separate experiments, in 2017 and expanded in 2018, both using northern pin oak, Q. ellipsoidalis and bur oak, Q. macrocarpa. We purchased the plants each year as 2-year-old winterized seedlings (Lawyer Nursery, Plains, Plains, MT, USA). We repotted seedlings into 1.7 gallon tree pots (Steuwe and Sons, Tangent, OR, USA) in 1:1 potting soil:sand mix during the early spring and allowed plants to leaf out in the greenhouses. We watered pots individually with soil drip irrigation and used halogen grow lamps to augment light. We imposed the same treatments in both experiments: (i) stem inoculation with B. fagacearum, (ii) leaf inoculation with T. iowensis (Q. macrocarpa only), (iii) reduced watering regime to induce chronic drought or (iv) control (Table 1). In 2018, five to seven individuals of each species by treatment combination were used for whole-canopy spectral reflectance measures. We spaced pots with a pot-width gap on all sides to minimize any risk of contamination and arranged plants in a stratified way across benches to have roughly equal numbers of each species by treatment combination on all greenhouse benches.
Experimental sample sizes. Oak seedling sample sizes by treatment included in 2017 and 2018 experiments. In 2018, 25 plants of each treatment were allotted for leaf-level measurements and 5–7 plants of each treatment were used for whole-plant measurements.
| Species | Control | Drought | Oak wilt | Bur oak blight | Totals | Annual totals | |
|---|---|---|---|---|---|---|---|
| 2017 | Q. ellipsoidalis | 19 | 19 | 20 | 58 | ||
| Q. macrocarpa | 17 | 17 | 17 | 18 | 69 | 127 | |
| 2018 | Q. ellipsoidalis | 25/7 | 25/6 | 25/6 | 94 | ||
| Q. macrocarpa | 25/5 | 25/7 | 25/7 | 25/7 | 126 | 220 |
Treatments: drought and fungal inoculations and drought monitoring
We inoculated plants and imposed drought treatments when the majority of canopy leaves were matured (13 July 2017 and 2 July 2018). We cultured an isolate of B. fagacearum, obtained from a naturally infected Q. ellipsoidalis tree in Stacy, MN in 2016, for 2 weeks, then flooded the Petri plates with 5 ml of sterile deionized water and gently scraped the culture with a rubber spatula. We filtered the conidia suspension through three layers of cheesecloth and diluted to a concentration of 1 × 10⁶ spore·ml−1 water. We inoculated plants with the oak wilt fungus (hereafter, oak wilt treatment) by puncturing the stems to the sapwood with a 26 gauge sterile syringe 3 cm above the root collar and applying a single hanging droplet (~0.01 ml) of the homogenized B. fagacearum conidia solution to the wound for passive uptake (Fenn et al. 1975). We inoculated leaves of Q. macrocarpa with bur oak blight fungus (hereafter, bur oak blight treatment) by puncturing the midveins abaxially (leaf base to distal end every 1 cm) using sterile dissecting teasing needles. Immediately after puncturing, we applied, with a paintbrush, a homogenized 1 × 10⁶ spore·ml−1 water solution of T. iowensis spores (from an isolate obtained from Ames, IA, in 2017) in sterile deionized water to the length of the midvein. In 2017 we inoculated all leaves of each treated plant, and in 2018 we inoculated or injured only five upper canopy leaves of each plant. After bur oak blight inoculation, we misted the inoculated plant canopies with sterile deionized water and covered them with a clear plastic bag for 48 h (Harrington et al. 2012). All individuals were given negative stem and leaf inoculations with deionized water to control for inoculation injury.
We imposed drought treatments by removing irrigation spouts and allowing soil to dry down to a target of 3% soil volumetric water content (VWC), watering as needed. We monitored soil moisture using a Fieldscout TDR 300 meter (Spectrum Technologies, Inc.,Aurora, IL, USA) fitted with 7′′ rods. We kept well-watered plants at a soil VWC of 16.5% (±4) and 18% (±5.1), in 2017 and 2018, respectively. After the third week, drought plants were at a soil VWC of 3.1% (2017) and 3.2% (2018). We measured pre-dawn water potential on asymptomatic leaves of four plants per species by treatment combination nearly weekly throughout the experiments.
Symptom monitoring
We monitored symptoms of the fungal diseases (2017 and 2018) and drought (2018 only) at least once weekly on all non-control plants. We counted numbers of healthy leaves (leaves not exhibiting chlorosis, browning or bronzing discoloration, obvious loss of turgidity or necrosis), wilting (loss of turgidity, desiccation, necrosis due to either drought or oak wilt stress), and abscissed leaves. On bur oak blight plants, we only counted inoculated leaves, but on all other non-control plants, we tracked symptoms throughout the canopy of each seedling. We converted counts to canopy fractions of each symptom type.
Spectral reflectance measurements
We measured adaxial leaf spectral reflectance (2017 and 2018) and whole-canopy spectral reflectance (2018) from 400 to 2400 nm using a Spectra Vista HR 1024i spectroradiometer (Spectra Vista Corporation, Poughkeepsie, NY, USA) and Spectra Vista Leaf Reflectance Probe (25o field of view (FOV) fiber optic and integrated white Zenith disc). Leaf measurements were done differently in 2017 and 2018. In 2017, we marked four upper canopy leaves per plant and repeatedly measured those leaves over the course of the experiment. In 2018, we measured three upper canopy leaves on each individual in each of the four following categories, as available: (i) visually asymptomatic leaves, (ii) green tissue available on any stage of symptomatic leaves, (iii) transitioning zones between green tissue and symptomatic tissue and (iv) symptomatic tissue (chlorotic, wilting or necrotic). In each year, we measured a subset of plants each week of the experiment (Tables S1 and S2 available as Supplementary Data at Tree Physiology Online).
We measured canopy reflectance by placing seedlings within a low-reflectance black box (painted in a black matte paint of reflectance <4%). We fixed the Spectra Vista fiber optic cable (25o FOV) 65 cm over the base of the box (maximum 28.8 cm diameter horizontal field of view, HFOV) and used a 72 W halogen flood lamp (Panasonic, 2880 K) affixed within 10o of vertical of the fore-optic as a light source. We measured seedlings so that initial seedling maximum canopy height was 24.5 cm (± 0.7) above the box base (40 cm below the fore-optic or 17.7 cm HFOV on the uppermost canopy). We turned pots to measure each plant four times at fixed positions to capture different canopy views and treated each view as pseudo-independent measurement. We measured five to seven plants per species by treatment combination (Table 1). Before measurement of each individual, we referenced light conditions using a Spectralon Diffuse Reflectance Standard (30.5 × 30.5 cm, 99% reflectance, Labsphere, Sutton, NH, USA). We used low reflectance black felt (<2% in measurement range, Creatology, Michael’s Stores, Inc., Irving, TX, USA) as a background for canopy measurements. We found that our light source had high variation above 1890 nm in white reference measurements and excluded wavelengths >1890 nm from our analyses of canopy spectra.
Leaf gas exchange
We used a LI-6400XT with a leaf chamber fluorometer attachment (LI-COR Environmental, Lincoln, NE, USA) to measure instantaneous photosynthetic and stomatal conductance rates on asymptomatic leaves (and symptomatic leaf tissue as available in 2018) during the same periods as we collected leaf-level spectral reflectance. In 2017, we kept CO2 constant at 400 p.p.m. and relative humidity at 45%. In 2018, we kept those parameters at ambient levels. In both years, we fixed other parameters: PAR = 600 μmol m−2 s−1, flow rate = 300 μmol s−1, block temperature = 24°C, based upon average ambient light and temperature in the greenhouse during the measurement period. We let all leaves equilibrate in the chamber before measurement. In analyses, we used both relative change from control and actual rate differences from control as a variable of interest. We found mean control values for each species by experimental week, then calculated relative change as 1 – (measured rate/mean control) and difference from control as measured rate – mean control.
Spectral processing and data analysis
We performed all data processing and analyses in R (v. 3.5 or greater, dynamic R ref: www.r-project.org). We used the spectrolab package (Meireles et al. 2018) for all raw spectra importing, smoothing, resampling and averaging. For diagnostic modeling, we removed from analyses spectra with low reflectance at 770 nm (leaf level spectra threshold <35%, canopy <20%) as a quality control on poor measurements. To reduce model dimensions, we resampled spectra every 10 nm from 400 to 2400 nm (ending at 1890 nm in whole-seedling canopy measurements because of variation in light source at or above 1900 nm). We used four different datasets for our models: (i) 2018 symptomatic (and control) leaf reflectance, (ii) 2018 asymptomatic (and control) leaf reflectance, (iii) 2018 canopy reflectance and (iv) 2017 leaf reflectance (Table 2). Leaf spectra collected on the same day were averaged to individual. We also subset these datasets by experimental week for time explicit analyses (Table S1 available as Supplementary Data at Tree Physiology Online), species for species–specific classification, or specific symptomatic tissue type (different types of tissue on a symptomatic leaf).
Spectral measurement sample sizes in each dataset. Values are the number of individual plants at any measurement time (spectra averaged to individual) except in the case of whole-plant canopy spectra, where each spectra represents a different view of a plant. Symptomatic data were resampled for balanced sample sizes in analyses.
| Year | Dataset | Q. ellipsoidalis | Q. macrocarpa | Total | |||||
|---|---|---|---|---|---|---|---|---|---|
| Control | Drought | Oak wilt | Control | Drought | Oak Wilt | Bur oak blight | |||
| 2018 | Symptomatic leaves | 1531 | 18 | 53 | 1561 | 32 | 38 | 134 | 2751 |
| 2018 | Asymptomatic leaves | 153 | 149 | 135 | 156 | 147 | 153 | 154 | 1047 |
| 2018 | Canopy | 97 | 68 | 60 | 74 | 81 | 90 | 105 | 575 |
| 2017 | Leaves | 71 | 72 | 73 | 66 | 65 | 70 | 66 | 483 |
1Control leaf reflectance measurements were added to the symptomatic leaf dataset for analyses and are not included in row totals.
We used partial least-squares discriminant analysis (PLS-DA), a method of linear discriminant analysis when using a large number of predictive components (Barker and Rayens 2003), to predict likelihood of belonging to any of the treatments: control, oak wilt, drought or bur oak blight (Q. macrocarpa only). In datasets with small sample sizes (responses subset to experimental week or specific symptomatic tissue types), we condensed responses to only “oak wilt” or “not oak wilt” (all other treatments). We used PLS-DA to classify and test the accuracy of species classification in each dataset. For all models, we chose a model component number that either maximized Kappa, a model performance statistic that quantifies model performance as better than random (Cohen 1960), or approximated the inflection point of Kappa in response to the number of components. We normalized and split the data into 50:50 test and training sets (balanced for factor of interest) and used probability methods of classification within the caret and pls packages (Kuhn 2008, Mevik et al. 2018). Each PLS-DA model is the averaged result of 100 iterations of fitting with a new training and test dataset. In datasets where the treatment samples sizes were unbalanced, we pseudo-randomly resampled the data in each iteration into balanced sample sizes based upon the number of the least-represented treatment (Table 2). Hereafter, we refer to the average results (with standard deviation) of 100 iterations as the PLS-DA model for each dataset.
We used the PLS-DA results to determine whether there were spectral regions unique, or diagnostic, to oak wilt-infected plants. We extracted the weighted importance of predictive variables (wavelengths) using the varImp() function in caret (Kuhn 2008) when fitting 100 iterative PLS-DA models and calculated mean weights for each variable in the dataset. To reduce the number of possible important regions to those with the highest weights, we selected the 20 variables of greatest weight from each averaged model, aggregated those with the values from other averaged models (i.e., 20 variables from the asymptomatic leaf model, 20 from the symptomatic leaf model), removed duplicates and extracted reflectance values (from spectra resampled every 1 nm) for each important wavelength from each spectral dataset. We also calculated common reflectance indices that have been found to indicate declines in tree health (Pontius et al. 2005b): photochemical reflectance index (PRI, Gamon et al. 1990, 1997), chlorophyll fluorescence (Mohammed et al. 1995), Carter and Miller Stress Index (chlorophyll content, Carter and Miller 1994), water band index (Tucker 1980, Carter 1993, Penuelas et al. 1997), R683 (chlorophyll a, Carter 1993), R760 (water, Osborne and Fearn 1986), R952 (water, Williams and Norris 1987) and R1653 (benzene rings, Williams and Norris 1987). We resampled the spectra every 1 nm because several of these reflectance indices use specific values requiring that resolution.
We used the reflectance values of potentially important variables to test for oak wilt diagnostic values. We tested for the effects of treatment, species and experimental week on reflectance and reflectance index values using linear regression and found the mean difference in reflectance between oak wilt and all other treatments. In any cases where treatment showed a significant effect (P < 0.001), we checked for pairwise differences (post hoc Tukey test, alpha = 0.001) between oak wilt and all other treatments. In any cases where species was a significant effect (P < 0.001), we checked within species data subsets for pairwise differences in spectral reflectance between oak wilt and all other treatments. We then assessed whether this smaller set of oak wilt diagnostic wavelengths could be used to classify the disease. To reduce duplication of correlated wavelengths from among regions represented by several consecutive wavelengths, we chose wavelengths that were associated with the largest absolute mean difference in reflectance values between oak wilt and other treatments or, if the reflectance values of consecutive regions were similar, wavelengths that were well annotated in the literature. We used this subset of wavelengths to fit a reduced dimension PLS-DA model.
We used linear models to evaluate the effect of relative change (or mean difference from control) of oak wilt treatment gas exchange rates on classification accuracy. We also used linear models to evaluate the effect of mean canopy symptom prevalence, treatment, species and leaf symptom status on treatment relative change in gas exchange rates.
Spectra, physiological and symptom data are available online from the Data Repository for the University of Minnesota, DRUM, https://doi.org/10.13020/cgy7-256, and Ecological Spectral Information System, EcoSIS, http://ecosis.org, https://doi.org/doi:10.21232/h90m-mg68 and https://doi.org/doi:10.21232/dr6e-n634 (1 nm spectra).
Results
Symptoms progressed differently between treatments and species
Predawn leaf water potentials were significantly lower in plants within the drought treatment than in all other treatments (P < 0.05) by the beginning of the second week of the experiment in 2018. There were no significant differences between the water potentials of other treatments (Figure S1 available as Supplementary Data at Tree Physiology Online). In 2017, Q. ellipsoidalis water potential remained higher in the drought treatments than the drought-treated Q. macrocarpa. Drought treatments had significantly (P < 0.05) lower predawn water potentials than control treatments by week 5 in 2017.
Bur oak blight symptoms appeared within a few days after inoculation and over 50% of bur oak blight inoculated leaves were eventually lost during the experiment (Figure S2 available as Supplementary Data at Tree Physiology Online). Quercus macrocarpa maintained a higher percentage of healthy leaves in oak wilt treatments and fewer wilted leaves than Q. ellipsoidalis in drought or oak wilt treatments (Figure S2 available as Supplementary Data at Tree Physiology Online). Oak wilt and bur oak blight treatment plants had higher rates of abscission than droughted plants. Symptom prevalence of any type was highly correlated (>|0.80|) with experimental week within both drought and oak wilt treatments, and rates of abscission were correlated with experimental duration in bur oak blight treatments (r = 0.97, Table 3).
Correlations of symptom type with experimental week. Correlations of experimental week with leaf symptom percentages (week 1 = inoculation) for each treatment type Bur oak blight leaves were not classified as wilted (NA) during the experiment.
| Oak wilt | Drought | Bur oak blight | |
|---|---|---|---|
| % Healthy | −0.98 | −0.98 | −0.41 |
| % Wilted | 0.92 | 0.94 | NA |
| % Abscissed | 0.97 | 0.82 | 0.97 |
| Oak wilt | Drought | Bur oak blight | |
|---|---|---|---|
| % Healthy | −0.98 | −0.98 | −0.41 |
| % Wilted | 0.92 | 0.94 | NA |
| % Abscissed | 0.97 | 0.82 | 0.97 |
Oak wilt classification model comparisons: high sensitivity to oak wilt in symptomatic leaves
Model sensitivity to oak wilt (correct classification of oak wilt treatments, reported as average percentage of treatments classified, followed by standard deviation) differed significantly between leaves of different symptom status and leaf or canopy measurements, when data from all experimental times were pooled (Figure 1). Models fit to symptomatic leaf data far out-performed models fit to canopy and asymptomatic leaf datasets (P < 0.001): 79.2% ±8 of oak wilt individuals correctly classified (Figure 1, Table S3 available as Supplementary Data at Tree Physiology Online), overall model accuracy (77.9% ±4) and model Kappa (70.5 ± 5). Model sensitivity to oak wilt was high regardless of type of tissue measured on the symptomatic leaf, but was highest among advanced symptomatic tissue (88% ±5, Figure S3 available as Supplementary Data at Tree Physiology Online). In canopy reflectance, oak wilt sensitivity was 60.2% ±6 (accuracy = 61.2% ±3, Kappa = 47.6 ± 4). Oak wilt sensitivity was 54.5% ±2 in asymptomatic leaves (accuracy = 62% ±2, Kappa = 48 ± 3). Models fit to 2017 leaf measurements had the lowest oak wilt sensitivity, 45.3% ±7 (accuracy = 46.3% ±3, Kappa = 26.1 ± 5, Figure 1). All models had greater than 59% sensitivity to drought. Drought and oak wilt plants were more often confused for one another in symptomatic leaves or canopy measurements, while control and oak wilt plants were most often confused for one another in leaf reflectance measurements that included asymptomatic leaves (Figure 2). False positives were generally rare in the symptomatic dataset (Figure 2a), where less than 4% of each other treatment was misclassified as oak wilt. Oak wilt confusion for other treatments was low (≤10%). Classification sensitivity was 74% or greater for all treatments in the symptomatic dataset. False positive classifications as oak wilt were higher in PLS-DA models that included asymptomatic leaves: 13.2% (±3) of control canopy measurements were misclassified as oak wilt, while 20.1% (±4) and 33.7% (±7) of controls were misclassified as oak wilt in 2018 asymptomatic leaves and 2017 leaves, respectively (Figure 2).
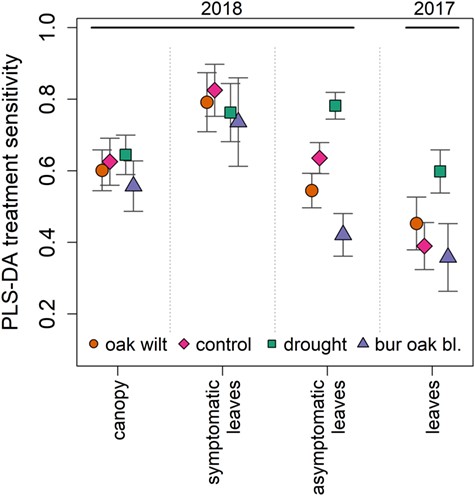
Highest oak wilt and other treatment PLS-DA model sensitivities are in symptomatic leaves. Model sensitivity (percent of each treatment correctly assigned) to each treatment in four datasets, using spectra from all measurement times. Asymptomatic and symptomatic lleaf datasets both include control leaf measurements. Error bars show one standard deviation from 100 iterative fits PLS-DA models for each dataset. All model sensitivities to oak wilt are significantly different (P < 0.001) Points are offset for display.
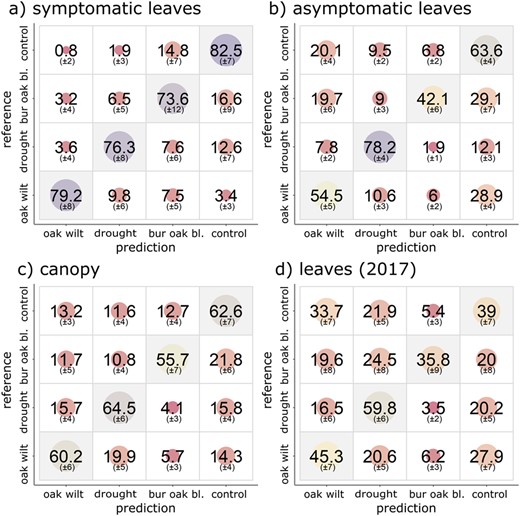
Confusion matrices of PLS-DA treatment classification models. Average percentage of classifications (and one standard of deviation) into each group from 100 PLS-DA model-fitting iterations of (a) symptomatic (and control) leaves, (b) asymptomatic (and control) leaves, (c) canopy and (d) leaves (2017, repeated measures of marked leaves regardless of symptom status). Vertical axis is applied treatments and horizontal axis is predicted classification.
Oak wilt model sensitivity increases with symptom prevalence, to a point
While visible oak wilt symptoms were nearly zero (week 2, 1.7% canopy leaves wilted), oak wilt classification sensitivity in asymptomatic leaves was 48% ±12 and 66% ±9 in canopy measurements (Figure S4 available as Supplementary Data at Tree Physiology Online). Model sensitivity to oak wilt improved with time in canopy spectral models and was highest in the last week of measurement (maximum at week 16, 82% ±14; Figure S4 available as Supplementary Data at Tree Physiology Online). Model sensitivity increased with canopy oak wilt symptom prevalence, to a point (Figure S5 available as Supplementary Data at Tree Physiology Online). Model sensitivity was highest in week 9 in asymptomatic leaves (72.1% ±11) and week 8 in symptomatic leaves (97.3% ±5), and then declined in subsequent weeks. These maxima in oak wilt sensitivity in leaf-based models were correlated with oak wilt symptom prevalence of 18–23% wilted leaves (Table S5 available as Supplementary Data at Tree Physiology Online). We lacked symptom prevalence data after week 11, but symptom prevalence gradually increased during the latter part of the experiment (Figure S2 available as Supplementary Data at Tree Physiology Online).
Highly accurate species classification and species-specific models do not outperform a single model
PLS-DA models fit to leaf level data that included asymptomatic leaves were the most accurate at classifying species (Figure 3a and Table S6 available as Supplementary Data at Tree Physiology Online). From 2018 asymptomatic leaf level reflectance models, we correctly classified 99.5% (±0.4) of Q. ellipsoidalis and 99.8% (±0.2) of Q. macrocarpa, and values were nearly as high in models fit to 2017 leaves. Species classification successes were also high among symptomatic leaves: 92.7 (±4%) and 98.4% (±1) in Q. ellipsoidalis and Q. macrocarpa, respectively.
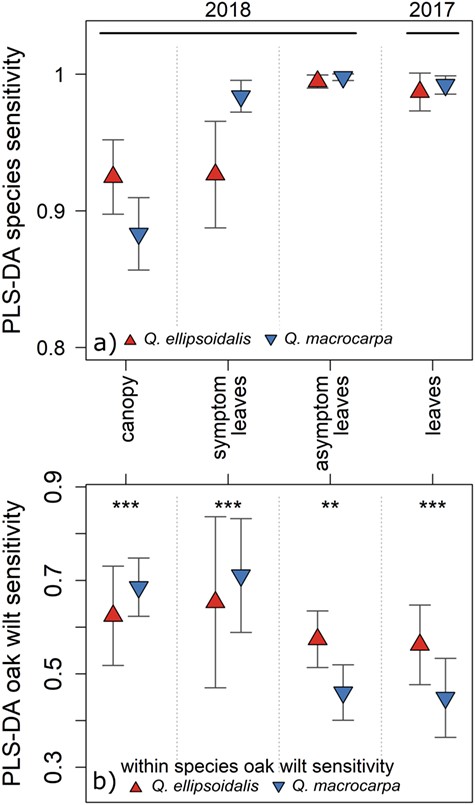
PLS-DA models classify species with very high sensitivity and within species PLS-DA model performance depends upon tissue type. (a) PLS-DA model classification of each species. (b) PLS-DA oak wilt sensitivity in species data subsets. Asterisks denote significant differences in oak wilt sensitivities between species-specific models (**P < 0.01 and ***P < 0.001). Error bars are one standard of deviation from 100 iterative PLS-DA model fits.
When data were subset by species, sensitivity of PLS-DA models to oak wilt remained highest in symptomatic leaves, where it was classified at a significantly higher sensitivity in Q. macrocarpa (71.1% ±12) than in Q. ellipsoidalis (65.3% ±18) (P > 0.001, Figure 3b, Figures S6, S7 and Table S4 available as Supplementary Data at Tree Physiology Online). Classification of oak wilt was also higher in whole-canopy reflectance models in Q. macrocarpa (68.6% ±6) than in Q. ellipsoidalis (62.4% ±11). In symptomatic Q. ellipsoidalis models, drought and oak wilt treatments were frequently misclassified as one another (29% Types I and II errors). That confusion also occurred within Q. macrocarpa but at lower rates (9% Type I and 15% Type II errors), and oak wilt was often misclassified as bur oak blight (13.4%; Figure S6 available as Supplementary Data at Tree Physiology Online). Model sensitivity to oak wilt was overall lower in asymptomatic leaves, and in models based on asymptomatic leaves, sensitivity was significantly greater in Q. ellipsoidalis (57.4% ±6) than Q. macrocarpa (46% ±6) (P < 0.001, Figure 3b). In asymptomatic leaves of both species, confusion rates were highest between control and oak wilt (15–27%). In asymptomatic leaves of Q. macrocarpa, oak wilt and bur oak blight were often confused (15–20%; Figure S6 available as Supplementary Data at Tree Physiology Online). When we excluded bur oak blight individuals from PLS-DA analysis (only Q. macrocarpa were inoculated) in symptomatic or asymptomatic leaves, we found that oak wilt sensitivity within Q. macrocarpa improved dramatically (symptomatic = 80.8% ±11, asymptomatic leaves = 69.6% ±4; Figure S6 available as Supplementary Data at Tree Physiology Online).
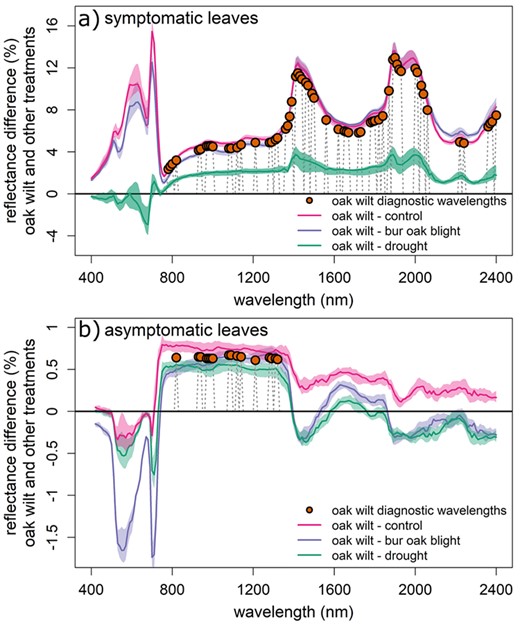
Oak wilt-diagnostic spectral regions and differences between treatment spectral signatures. Orange points are wavelengths at which oak wilt reflectance values were significantly different than all other treatments (mean differences between oak wilt-inoculated reflectance values and all other treatments, pairwise comparisons, P < 0.001). Spectra are median values of percent reflectance differences between oak wilt-inoculated individuals and the median value of other treatments. (a) Symptomatic (and control) leaves. (b) Asymptomatic (and control) leaves.
Wavelengths associated with oak wilt in the near infrared and shortwave infrared
We tested for effects of treatment, experimental week and species at 106 wavelengths important to our different oak wilt models and eight indices and reflectance wavelengths from Pontius et al. (2005b). We found reflectance values for oak wilt treatment individuals to be significantly different from all other treatments—or diagnostic of oak wilt—at 66 different wavelengths, including three known indices/single wavelength reflectance values (Table S3 available as Supplementary Data at Tree Physiology Online, Figure 4). In asymptomatic leaves and canopy measurements, oak wilt diagnostic wavelengths were all within or near the near-infrared region and low shortwave infrared, 820–1320 nm (Figure 4b). The mean differences in reflectance between oak wilt and all other treatments (an estimate of the diagnostic power at that wavelength) in asymptomatic leaves were smaller in canopy reflectance (−0.22 to 0.33%) than in leaves (0.61–0.67%). Differences in reflectance values of spectra between oak wilt and all other treatments were quite similar in the near-infrared, while differences were the greatest (absolute value) between oak wilt and bur oak blight in the visible and oak wilt and control in the shortwave infrared (Figure 4b). In canopy spectra, the interaction of experimental week and treatment was a significant predictor of reflectance values (Table S3 available as Supplementary Data at Tree Physiology Online). We found oak wilt diagnostic wavelengths across a broader part of the spectrum in symptomatic leaves: reflectance differences were larger (3.2–5.3%) in the near infrared and low shortwave infrared and extended to portions of the spectrum out to 2400 nm (4.8–13%, Figure 4a and Table S3 available as Supplementary Data at Tree Physiology Online). There were large differences between oak wilt symptomatic leaves and both symptomatic bur oak blight treatments and healthy control leaves in the visible spectra, but differences were small when compared with drought treatments (Figure 4a). Reflectance values were significantly different between species in several oak wilt diagnostic regions (780–1390, 1490–1870 and 2000–2400 nm; Table S3 available as Supplementary Data at Tree Physiology Online). However, mean differences in reflectance between oak wilt and all other treatments within either species were usually similar in magnitude. In asymptomatic leaves, where reflectance differences were generally quite small, we found consistently smaller differences in reflectance between oak wilt inoculated Q. macrocarpa and other treatments.
We used a reduced set of 30 (of 66) diagnostic wavelengths (Table S3 available as Supplementary Data at Tree Physiology Online) as predictors of oak wilt in PLS-DA models. Model sensitivity to oak wilt in symptomatic leaf measurements was nearly as high as when using the full set of 200 wavelengths (74.1% ±10, Figure S8 available as Supplementary Data at Tree Physiology Online): false positives were low (control = 0.3%, bur oak blight = 2.9% and drought = 6.7%) as was oak wilt misclassification as drought (14.8% ±8). Oak wilt sensitivity was significantly reduced in asymptomatic leaves or canopy models (41% ±4 and 48.5% ±6, respectively, Figure S8 available as Supplementary Data at Tree Physiology Online).
Changes in physiological function were associated with oak wilt model sensitivity
Spectroscopic sensitivity to oak wilt among time specific (weekly) PLS-DA was positively correlated with relative change between oak wilt and control rates of instantaneous photosynthesis (R2 = 0.61, P < 0.01, F1,10 = 15.6, Figure 5a) or stomatal conductance (R2 = 0.53, P < 0.001, F1,10 = 11.3, Figure 5b). This was true regardless of leaf symptom status (not significant at P < 0.1) and also true when the predictor was actual differences from control (Figure S9 available as Supplementary Data at Tree Physiology Online).
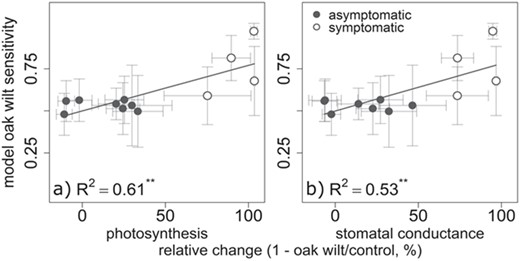
PLS-DA model oak wilt sensitivity increases with photosynthesis and stomatal conductance relative change from control. Mean weekly PLS-DA oak wilt sensitivity by relative change ratio of oak wilt-inoculated individual leaf gas exchange rates. Error bars are standard error of oak wilt sensitivity and standard error of the mean relative change, **P < 0.01. (a) Instantaneous photosynthetic assimilation rate relative change and (b) instantaneous stomatal conductance rate relative change.
Treatment and leaf symptom status (asymptomatic or symptomatic), but not species, were significant predictors of differences from control in photosynthesis (R2 = 0.57, P < 0.001, F6,51 = 11.5) and stomatal conductance (R2 = 0.47, P < 0.001, F4,53 = 11.9). In oak wilt-inoculated plants, relative changes in gas exchange rates in asymptomatic leaves were significantly correlated with canopy symptom prevalence, especially wilted canopy fraction, but not in symptomatic leaves (P < 0.05, Figure 6 and Figure S10 available as Supplementary Data at Tree Physiology Online). Oak wilt symptomatic leaves had significantly greater declines in gas exchange than asymptomatic leaves (P < 0.001, Table S2 available as Supplementary Data at Tree Physiology Online, Figure 6). In drought treatments, relative declines in gas exchange were not significantly different between leaf types (P > 0.05, Table S2 and Figure S11 available as Supplementary Data at Tree Physiology Online), and gas exchange rate changes in both leaf types were significantly predicted by wilted canopy fractions (Figure 6). In symptomatic bur oak blight leaves, we observed significantly greater declines in instantaneous photosynthesis (P < 0.05, Table S2 available as Supplementary Data at Tree Physiology Online).
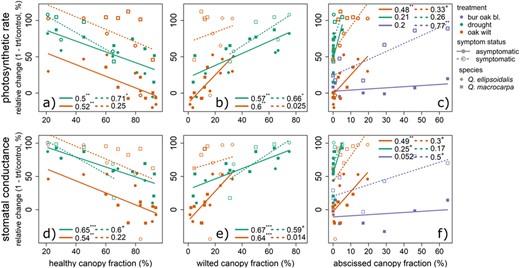
Gas exchange rate relative change from control correlated with symptom progression in canopies. Mean weekly treatment relative change by mean symptom prevalence in canopy for symptomatic and asymptomatic leaves. Species are shown by squares (Q. ellipsoidalis) and circles (Q. macrocarpa). Values are R2 followed by significance (+P < 0.1, *P < 0.05, **P < 0.01 and ***P < 0.001). Instantaneous photosynthetic rate relative change (a–c) or mean stomatal conductance relative change (d–f) by mean canopy fraction of healthy, wilted and abscissed leaves.
Discussion
This work shows that oak wilt can be accurately detected and differentiated from other stressors in multiple oak species using spectral data. At the leaf level, we were able to diagnose the disease in the majority of affected plants before symptoms were apparent, yet we could most accurately classify plants after the appearance of symptoms, and canopy-level detection was greatest when 20% of the canopy was symptomatic. Classification models fit to spectra of symptomatic tissue rarely gave false positive errors, and we seldom misclassified healthy plants or those stressed from other factors. We found that there were differences in oak wilt sensitivity in species-specific models, but those models did not consistently outperform a single model including both species. We also found that there are multiple spectral regions in the near-infrared and shortwave infrared, associated with water content, structural and non-structural carbohydrates and photosynthetic function, where oak wilt-reflectance values are significantly different from the other treatments. In the visible spectral regions, oak wilt-affected plants remain similar to droughted plants. We found that photosynthetic and stomatal conductance rates declined differently between bur oak blight, oak wilt and drought stressed plants, even when symptoms were similar in appearance. Leaves of oak wilt plants had the largest variation in decline in gas exchange between asymptomatic and symptomatic leaves. PLS-DA model sensitivity to oak wilt increased as oak wilt-affected plants diverged in physiological function from control.
The heterogeneity of disease effects and symptom appearance is the primary issue behind oak wilt-classification errors. Oak wilt conidia must move horizontally through the host xylem and upward through the sapstream, and oaks form tyloses to halt this or, in the case of white oaks, have vessel groupings that also limit the spread, causing oak wilt infection to affect only parts of the plants, at least initially (Marchetti 1962, Kozlowski and Winget 1963, Jacobi and MacDonald 1980, Yadeta and Thomma 2013). In contrast, chronic drought stress results in an overall decline in plant water status and physiological function of treated seedlings, regardless of symptom status, early on in treatment. In models that included asymptomatic leaves, the class sensitivity was higher for drought than all other classes, likely because water deficiency causes detectable and uniform changes in plant status relatively quickly. In both oak wilt and bur oak blight, asymptomatic and symptomatic leaves were physiologically functioning in different ways. Models that included asymptomatic leaves, including canopies, were not, early in infection, highly sensitive to oak wilt, and oak wilt and control treatments were often confused for one another. The element of timing of disease spread is apparent in canopy models, where model performance improved significantly with symptom prevalence in the canopy. And in asymptomatic leaves, if measured for longer periods of time, the effects of large fractions of wilted canopy improve detection even in healthy-appearing leaves. In the 2017 leaf models, including asymptomatic leaves and measuring plants for a shorter time period reduced classification success. When we eliminated the problem of simply detecting the oak wilt disease signal among asymptomatic leaves by using (i) only control and symptomatic leaves of any stress, (ii) canopies showing increasing oak wilt symptom prevalence or (iii) the remaining asymptomatic leaves on plants that can no longer maintain high physiological function, then we detected oak wilt with high sensitivity and accurately distinguished it from other stresses. Bur oak blight detection is even more tricky because unlike a vascular wilt, it affects the function of other leaves indirectly, and in our case, the infection was limited to inoculated leaves. Yet we were able to detect the disease with high sensitivity in symptomatic leaf measurements. Many tree diseases are compartmentalized by host responses or the slow progression of infection (Shigo and Marx 1977, Beier et al. 2017), and understanding the extent to which a stress affects a whole plant or not will improve the accuracy of detection measurements.
The potential oak wilt diagnostic wavelengths demonstrate possible mechanisms of plant disease response and fungal infection. We found multiple spectral areas associated with water content and canopy water content that were significantly different even between oak wilt and drought affected plants in asymptomatic leaves (952, 970, 1000 and 1210 nm; Curran 1989, Williams and Norris 1987, Pontius et al. 2005b, Kumar 2007), and that these expanded to include water absorbance features in the shortwave infrared in symptomatic leaves (1460, 1930 nm; Curran 1989) as well as reflectance regions known to correlate with leaf water potential (1470, 1840–1890 nm; Cotrozzi et al. 2017). While we may have expected water content changes to be quite similar between drought and oak wilt, or more exaggerated in drought, the oak wilt fungus causes cell rupture in the leaves, altering the leaf cellular structure (800–820, 1120, 1210, 1490, 1820 and 2360 nm, Curran 1989) and permanently altering the water availability in the leaves (Wilson 2005). In symptomatic leaves in oak wilt treatments, we observed much greater declines in stomatal conductance than in drought-treated plants, even when canopy wilting was not prevalent.
The potential oak wilt diagnostic wavelengths show that the underlying causes of photosynthetic decline are likely quite complex and the result of both hydraulic dysfunction and further plant-fungal interactions. We found that there were multiple regions that are associated with leaf starch and sugar content (970, 990, 1210, 1460, 1490, 1780, 1900 and 2000 nm; Curran 1989). Starch is a main product of photosynthesis (Zeeman et al. 2004) and differences in starch content may simply be a signal of declining photosynthetic machinery. We found oak wilt-specific reflectance features at several wavelengths associated with Rubisco and leaf nitrogen (1670, 1930, 2060, 2220 and 2360 nm; Curran 1989, Elvidge 1990, Serbin et al. 2012). However, leaf starch content has also been shown to decline in water-stressed seedlings, when starch hydrolysis may be used for osmotic adjustment (Épron and Dreyer 1996). The fungus can also directly reduce sugar content through consumption (Oliva et al. 2014) or indirectly cause a reduction in non-structural carbohydrates due to ethylene production, which triggers the process of leaf senescence and abscission (Wilson 2005), which would include nutrient recycling, pigment breakdown and metabolisms of sugars and lipids (Iqbal et al. 2017). We did observe higher rates of leaf abscission in both fungal diseases than in the drought treatment. Foliar fungal infections have been observed to increase volatile isoprene emissions in oaks (Copolovici et al. 2014), which are highly correlated with the PRI (Gamon et al. 1990, 1997, Peñuelas et al. 2013), but we observed no significant differences in PRI associated with the oak wilt vascular infection. With calibration to a suite of physiological processes, spectroscopic tools may be used to monitor fungal infections and host responses, and understand the mechanisms of decline in infected trees.
We can detect oak wilt with a single model, regardless of the species measured, even when symptom progression and disease response is different. We found that we could classify species with virtually no error (>99% in asymptomatic leaves), showing that there are strong detectable spectral differences. We also found there were differences between the species specific models of oak wilt, and found significant species differences in reflectance at oak wilt-specific wavelengths, yet we did not find consistently better oak wilt classification within one species model than in the joint model. The photosynthetic and stomatal conductance responses we observed to oak wilt stress were not significantly different among species. The differences in species model performance may be due to the differences in disease progression: oak wilt symptoms advanced more rapidly in Q. ellipsoidalis, and, like other red oaks, fungal conidia are expected to spread more rapidly throughout the vascular system of the plant because of anatomical differences between species and because red oaks have less effective tylosis formation and thus compartmentalization (Jacobi and MacDonald 1980, Juzwik et al. 2011). In asymptomatic leaves of Q. ellipsoidalis, reflectance differences between oak wilt and other treatments were greater and oak wilt classification was significantly higher than in Q. macrocarpa. This may be because of the rapid impact of the infection on the whole plant, even in otherwise healthy leaves, while Q. macrocarpa more successfully compartmentalizes the disease. We had greater rates of success of oak wilt classification in Q. macrocarpa in symptomatic leaves, yet overall, reflectance values in each species were very similar in magnitude in symptomatic leaves. Moderate to advanced disease symptoms may overwhelm species differences in some ways: we found that we were able to classify species from spectra less well in symptomatic leaves (or canopies which included symptomatic leaves). We also observed declines in model performance in weekly data subsets after canopy oak wilt symptom prevalence exceeded moderate values (greater than 23%), perhaps due to the loss of signal within completely necrotic tissue. In our study, models may have become overwhelmed with the signal of dead tissue over oak wilt infected and dying tissue, and this effect would have been more pronounced because of the rapid symptom onset in Q. ellipsoidalis.
Conclusions
As climate change causes increased plant stress and vulnerability to present and newly introduced pathogens, explicitly and accurately diagnosing manageable diseases across landscapes using remote sensing tools is increasingly important. We show that we can use spectroscopic tools to accurately diagnose a disease from other possible stresses present in common co-occurring forest species. This diagnosis is possible due to spectral signals that are correlated with physiological changes due to plant response or plant–fungal interactions. Heterogeneity in symptom appearance in the canopy, possibly due to disease compartmentalization within the plant, can reduce the spectral signal. Measurements of explicitly symptomatic tissue, or whole-tree canopies with a high prevalence of symptoms, increase detection, making remote spectral detection of disease a viable tool at a stand or forest scale.
Acknowledgments
Research was conducted in USDA Forest Service greenhouse facilities on the University of Minnesota campus on occupied Dakota land. Lillian Legg, Mason Martinez, Jake Botkin, Shan Kothari, Jose Eduardo Meireles, Anna Schweiger, Marisol Cruz Aguilar, Kali Hall, Alex Feltmeyer and Mark Moeller helped to collect data or inoculate seedlings. David Sannerud, Ingrid Holstrom, Sam Graf, Ellie McNairy and Kirsten Rosenberger assisted in potting oak seedlings. Paul Castillo and Melanie Moore (USDA Forest Service) managed the greenhouse facilities, and Geoffrey Harms constructed an apparatus for canopy spectral measurements. Jose Eduardo Meireles, Anna Schweiger and Tom Corl provided valuable advice on data collection, especially on the methods for measuring whole-canopy spectra.
Conflict of interest
None declared
Funding
This project was funded with a University of Minnesota Grand Challenges Research Grant (Co-primary investigators (PIs) J.C.-B., J.J., R.A.M.), a Minnesota Invasive Terrestrial Plants and Pests Center Grant (PI J.C.-B.) and Minnesota Agricultural Experiment Station funding (project MIN-42-060, R.A.M.).
Authors’ contributions
J.C.-B., J.J., and R.A.M. conceived of and obtained funding for the project, I.A., B.F., C.N., and A.Y. carried out the experiments and data collection, and B.F. analyzed the data. B.F. and J.C.-B. wrote the manuscript.
