


Abstract
Due to the increase in atmospheric CO2 concentrations, the ratio of carbon fixed by assimilation to water lost by transpiration through stomatal conductance (intrinsic water-use efficiency, iWUE) shows a long-term increasing trend globally. However, the drivers of short-term (inter-annual) variability in iWUE of tropical trees are poorly understood. We studied the inter-annual variability in iWUE of three South Asian tropical moist forest tree species (Chukrasia tabularis A.Juss., Toona ciliata M. Roem. and Lagerstroemia speciosa L.) derived from tree-ring stable carbon isotope ratio (δ13C) in response to variations of environmental conditions. We found a significantly decreasing trend in carbon discrimination (Δ13C) and an increasing trend in iWUE in all the three species, with a species-specific long-term trend in intercellular CO2 concentration (Ci). Growing season temperatures were the main driver of inter-annual variability of iWUE in C. tabularis and L. speciosa, whereas previous year temperatures determined the iWUE variability in T. ciliata. Vapor pressure deficit was linked with iWUE only in C. tabularis. Differences in shade tolerance, tree stature and canopy position might have caused this species-specific variation in iWUE response to climate. Linear mixed effect modeling successfully simulated iWUE variability, explaining 41–51% of the total variance varying with species. Commonality analysis revealed that temperatures had a dominant influence on the inter-annual iWUE variability (64–77%) over precipitation (7–22%) and atmospheric CO2 concentration (3–6%). However, the long-term variations in iWUE were explicitly determined by the atmospheric CO2 increase (83–94%). Our results suggest that the elevated CO2 and concomitant global warming might have detrimental effects on gas exchange and other physiological processes in South Asian tropical moist forest trees.
Introduction
Atmospheric CO2 is one of the main greenhouse gases affecting life forms and their surrounding environments (Anderson et al. 2016). Since the industrial revolution, atmospheric CO2 concentration has been rising exponentially, with a sharp increase in the most recent decades (Keeling et al. 1976, 1995, Betts et al. 2016). As recorded in the Mauna Loa Earth Observatory in Hawaii, atmospheric CO2 concentration increased by nearly 29% during the past 65 years. This consistent rise in atmospheric CO2 resulted in many environmental changes, including a rise in global temperatures, and the occurrence of extreme climatic events around the world (IPCC 2013). These environmental changes have already been proved to affect the physiology, ecology and biology of plants from individual to biome scale (Silva and Anand 2013, Swann et al. 2016). Most studies conducted on plants’ responses to environmental changes have focused on the short-term response in manipulation experiments (Körner 2006, Leuzinger et al. 2011, Norby and Zak 2011). However, long-term responses of plants to global environmental changes are poorly studied so far due to the lack of long-term experimental data (Hovenden and Newton 2018). Nevertheless, understanding the long-term physiological responses of plants, especially trees in tropical regions, is important because tropical trees are a crucial component of global biogeochemical cycles (Zuidema et al. 2013).
In the absence of long-term ecophysiological experiments in the tropics, tree-ring stable isotopes provide a good proxy to study the long-term responses of trees to environmental changes (McCarroll and Loader 2004, Zuidema et al. 2013, van der Sleen et al. 2017,b) from multi-decadal to centennial scale. During carbon sequestration and water uptake by roots and subsequent wood formation processes, heavier isotopes are discriminated against the lighter ones. However, the rate of discrimination is influenced by the prevailing environmental condition and thus may imprint the environmental signal in tree-rings (McCarroll and Loader 2004). It is important to note that discrimination rate is also affected influenced by the variation in intercellular CO2 concentration (Ci), which is driven by stomatal conductance and photosynthesis (Farquhar et al. 1982). Thus, variations in stable carbon isotopes (δ13C) in tree-rings provide deeper insight into changes in intrinsic water-use efficiency (iWUE), which is the ratio of carbon fixed by assimilation to water lost by transpiration through stomatal conductance (Farquhar et al. 1982, McCarroll and Loader 2004).
Intrinsic water-use efficiency derived from tree-ring stable carbon isotope ratios (δ13C) has already been used as a potential proxy for the past physiological responses of tropical trees to environmental changes (Hietz et al. 2005, Brienen et al. 2011, Gebrekirstos et al. 2011, Nock et al. 2011, van der Sleen et al. 2014). Nonetheless, how changes in the δ13C-derived iWUE in tropical trees are related to climate has not been adequately understood so far. Besides, the large and rapid on-going changes in atmospheric CO2 concentrations may also be reflected in iWUE trends in tropical tree-rings (van der Sleen et al. 2014). Yet, the relative importance of climate and atmospheric CO2 in determining the iWUE variability has not been explored for many tropical trees and ecosystems, although it is crucial for advancing our understanding of long-term physiological responses of tropical trees to elevated CO2 and climatic changes.
Long-term physiological responses of trees to environmental changes may vary across biomes, sites, species and even within the individual tree level (Peñuelas et al. 2011, Silva and Anand 2013, Battipaglia et al. 2014, Rahman et al. 2019,b). Water-use efficiency response to environmental changes varied between species (Martínez-Sancho et al. 2018, Liu et al. 2019), within the species distributed in mesic and xeric sites (Lévesque et al. 2014) and between different forest management practices (Rezaie et al. 2018). It is thus important to study how tropical tree species of different functional types differ in their water-use response to elevated CO2 and climate. The currently available studies on the impact of climate on iWUE variability of tropical trees were mostly conducted in dry tropical regions (e.g., Gebrekirstos et al. 2011), highlighting the research gap in moist tropical forests.
The moist tropical forests in Bangladesh are rich in tree diversity (Sobuj and Rahman 2011a, 2011b, Rahman et al. 2012, Sarker et al. 2015), but are highly vulnerable to climate change (Khaine and Woo 2015). It is therefore of high relevance to test if different moist forest tree species in Bangladesh show variable responses in iWUE to environmental changes. We conducted a tree-ring based stable carbon isotope study on three tropical moist forest tree species (Chukrasia tabularis A.Juss., Toona ciliata M. Roem. and Lagerstroemia speciosa L.) in a moist tropical forest in Bangladesh, which differ in their shade tolerance, growth rates, xylem porosity and growing habitat preferences. Chukrasia tabularis is an intermediate shade-tolerant, fast-growing, diffuse-porous species. Toona ciliata is a shade-intolerant, fast-growing, (semi)ring-porous species, while L. speciosa is a shade-tolerant, slow-growing, ring-porous species. The main objective of this study was to investigate the short-term (inter-annual) variability and long-term patterns of iWUE in the three species in response to elevated CO2 and climate. We tested the following hypotheses:
(i) In response to rising atmospheric CO2 concentration (Ca), there is a species-independent long-term positive trend in stable carbon isotope ratios (δ13C), carbon discrimination (Δ13C), intercellular CO2 concentration (Ci) and iWUE.
(ii) Climate exerts an overriding influence on inter-annual variability of iWUE over atmospheric CO2, whereas atmospheric CO2 shapes the long-term pattern of iWUE.
Materials and methods
Study sites and climate
The study was conducted in the 1795 ha large nature reserve Rema-Kalenga Wildlife Sanctuary (RKWS) (24°06′–24°14′N and 91°36′–91°39′E) in Bangladesh. Tree sampling was conducted in Rema, Kalenga and Chonbari forest reserves within the RKWS, which is a part of the Indo-Burma biodiversity hotspot (Brooks et al. 2002). The study sites consist of floodplain areas and hills up to 100 m above the sea level. Hill tops are represented by sandy loamy soils, whereas flood plain areas comprise of clay loamy soils. The study sites experience a humid monsoon climate with total annual precipitation of 2363 mm and mean annual temperature of 24.8 °C calculated over 1950–2015. There is a distinct seasonality, with a dry season (monthly precipitation <100 mm) extending from November to February (Figure 1A). Taking the climate seasonality pattern and the phenological behavior of trees into account, we assumed that March–October is the growing season of our studied species. The main monsoon season extends from May to August. March–April is the pre-monsoon and September–October is the post-monsoon season in our study area.
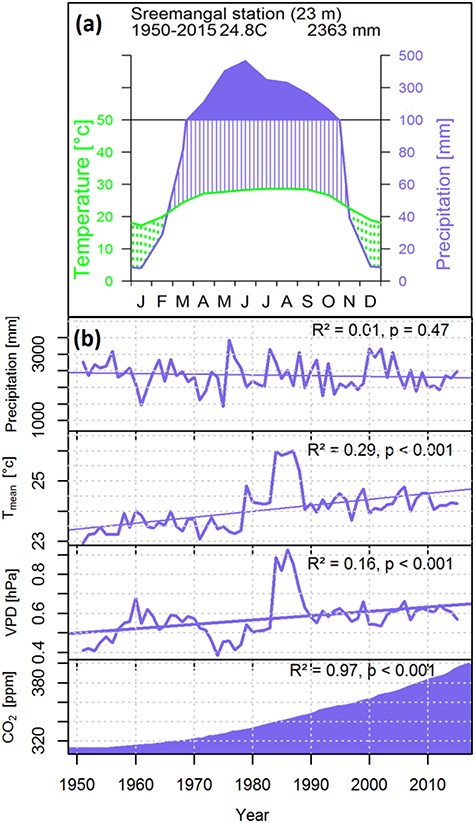
(A) Climate diagram based on the climate data over 1950–2015 recorded at the nearest climate station Sreemangal, 23 km away from the study site. Green dotted areas represent the dry season with monthly precipitation <100 mm. Dark shaded areas represent the wet season with monthly precipitation >100 mm. (B) Inter-annual variability and long-term trends in precipitation, mean temperature, vapor pressure deficit (VPD) and atmospheric CO2 concentration from 1950 to 2015.
Study species and wood sample collection
Recent studies on several species in Bangladeshi moist tropical forests revealed species-specific growth responses to the climate change (Rahman et al. 2018). Species-specific drought resilience and hydraulic conductivity response to water stress were observed in the functionally different moist forest species in Bangladesh (Islam et al. 2018, Rahman et al. 2019a). We therefore selected two species from the top canopy (C. tabularis and T. ciliata, Meliaceae), and one species from the middle canopy (L. speciosa, Lythraceae). Species selection was based on the formation of distinct wood anatomical growth-ring boundaries, xylem porosity, ecological guild and their wide distribution in tropics. All three species form fairly distinct and annual growth-ring boundaries (Rahman et al. 2018). The main characteristics of the species are described in Table 1.
Characteristics of three South Asian tropical moist forest tree species.
| Species name | Family | Distribution1 | Phenology2 (Kalinganire and Pinyopusarerk 2000; Williams et al. 2008; Orwa et al. 2009) | Shade tolerance3 (Kalinganire and Pinyopusarerk 2000; Williams et al. 2008; Orwa et al. 2009) | Max. height (m) | Growth-ring boundary features4 (Islam et al. 2018) | Wood density (g cm3) (Zanne et al. 2009) | Growth rate |
|---|---|---|---|---|---|---|---|---|
| Chukrasia tabularis | Meliaceae | SA, EA, SEA | Brevi-deciduous | PST | 40 | MP | 0.59 | Fast growing |
| Toona ciliata | Meliaceae | SA, SEA, Af, A | Deciduous | P | 45 | P, MP, FWT | 0.38 | Fast growing |
| Lagerstroemia speciosa | Lythraceae | SA, EA, SEA | Deciduous | ST | 30 | P, MP, FWT | 0.64 | Slow growing |
1SA, South Asia; EA, East Asia; SEA, South-East Asia; A, Australia; Af, Africa.
2Deciduous: tree leafless for >4 weeks; brevi-deciduous: tree briefly or only partially leafless.
3P, pioneer; PST, partially shade tolerant; ST, shade tolerant.
4MP, marginal parenchyma band (terminal or initial); P, porosity; FWT, thick-walled latewood fibers.
We collected 210 increment cores from 105 trees, and one stem disc of C. tabularis. Cores were extracted at breast height (1.3 m) using a 5-mm Suunto increment borer (Vantaa, Finland). After air drying in the laboratory, cross-sectional surface of the cores were sanded by increasingly fine sand papers (80–2000 grit) until growth-rings were visible with the naked eye (Stokes and Smiley 1968). To improve the contrast of vessels from the surrounding tissues, we used white chalk on the wood surface to fill the vessels. The stem disc and cores were then scanned with a flatbed scanner (Epson Expression 10000XL, Long Beach) at a resolution of 2000 d.p.i.
Ring-width measurement and cross-dating
Ring-width measurement was performed on polished wood surface using Lintab 6 and on the scanned images using the CooRecorder image analysis software (Cbis, Saltsjöbaden, Sweden) at a precision level of 0.01 mm. First, two or three cores or disc radii of a tree were cross-dated using the TSAP-Win software (Rinntech, Heidelberg, Germany). Cross-dating of cores from different directions within a tree allowed identifying false rings, wedging rings and missing rings (Worbes et al. 2002). Cross-dating within trees was statistically checked using t-test and GLK values (Eckstein and Bauch 1969). Cross-dating accuracy was checked by computer program COFECHA (Grissino-Mayer 2001). Finally, we successfully cross-dated 115 cores from 70 trees of three species.
Cellulose extraction, stable carbon isotope measurements and analysis
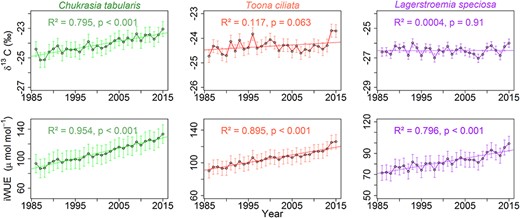
Annual variability and long-term trends in δ13C (corrected for atmospheric CO2 increase) and intrinsic water-use efficiency (iWUE) of three South Asian tropical moist forest tree species.
Data preparation
To develop standard chronologies, we detrended iWUE time series by fitting a 10-year cubic smoothing spline curve with a 50% frequency response (f = 0.50) using dplr package in R (Bunn 2008). For long-term analysis, we used a conservative detrending method (mean) to retain the low frequency signals in the chronology (Nock et al. 2011, Sullivan et al. 2016). The ‘mean’ function fits a horizontal line using the mean value of the series, thus indexing them while preserving all low-frequency variations contained in the original data. Thus, we worked with two data sets: spline-filtered chronologies and mean-indexed original chronologies. Spline-filtered chronologies were used for dendroclimatic analysis, modeling and commonality analysis (CA). Mean-indexed chronologies were used to calculate long-term trends in tree-ring variables (Bunn 2008). Inter-series correlation between individual trees (rbar.bt) and expressed population signal (EPS) were calculated using the commonly accepted equations (Briffa and Jones 1990).
Data analyses
We analyzed monthly mean temperatures, vapor pressure deficit (VPD) and annual precipitation data for the period after 1950. Temperature and precipitation data were collected from the nearby meteorological station Sreemangal, which is 23 km away from the study site. The VPD was calculated from monthly temperature and relative humidity data following the equation: VPD = ((100 − RH)/100) × SVP, where saturated vapor pressure (SVP) = 0.610 exp × ((17.27 × T)/(T + 237.3)), T = temperature and RH = relative humidity.
To test if the tree-ring time series have any long-term trends, we performed simple linear regression analysis of the mean chronologies of all the tree-ring variables. Pearson correlation analysis was performed to explore the association between iWUE and climate variables. Intrinsic water-use efficiency was simulated using linear mixed effect (LME) modeling, taking climate variables as fixed factors and tree-height and DBH as random factors. Tree-height can influence estimates of iWUE (Brienen et al. 2017) and was reconstructed applying height-diameter allometric equations developed from the region–environment–structure model (Feldpausch et al. 2011). Best model selection was based on the Akaike information criterion (AIC), Bayesian information criterion (BIC) and log likelihood ratio (loglik). The best model results in the lowest AIC and BIC and the highest loglik values. Commonality analysis was performed to disentangle the effects of multiple factors (temperature, precipitation and atmospheric CO2) on iWUE. One of the advantages of CA is that it can separate the relative contribution of a particular predictor in explaining the variance of response variable as well as providing the relative contribution shared by multiple predictors (Huang et al. 2017). All analyses were performed within the R statistical programming environment (R Development Core Team 2016).
Results
Long-term trends in δ13C, Δ13C, Ci and iWUE
We observed a significantly increasing trend in δ13C in C. tabularis (R2 = 0.80, P < 0.001) over the past three decades. In contrast, T. ciliata and L. speciosa did not show any significant long-term trends in δ13C (Figure 2). However, all three species showed a significantly decreasing trend in Δ13C, with C. tabularis displaying the highest decrease in Δ13C (14%). In contrast to the decreasing trend in carbon discrimination, we observed strongly significant increasing trend in iWUE in all three species (Figure 2). The iWUE of C. tabularis showed the highest increase, by 29–46%. Nonetheless, divergent long-term trends were observed in Ci, with C. tabularis showing decreasing trend, whereas T. ciliata and L. speciosa showing increasing trends. The percentage change in Ci in L. speciosa was almost double (9%) that in the other two species. The descriptive statistics of all tree-ring variables are presented in Table 2.
Descriptive statistics of the tree-ring variables of three South Asian tropical moist forest tree species.
| Species | Variables | Minimum | Maximum | Mean | SD |
|---|---|---|---|---|---|
| C. tabularis | δ13C | −25.15 | −23.05 | −24.10 | 0.51 |
| Δ13C | 14.96 | 17.98 | 16.49 | 0.77 | |
| Ci | 187.34 | 208.84 | 197.72 | 5.03 | |
| iWUE | 86.58 | 133.46 | 107.98 | 12.56 | |
| T. ciliata | δ13C | −24.73 | −23.69 | −24.32 | 0.26 |
| Δ13C | 15.65 | 17.57 | 16.72 | 0.43 | |
| Ci | 190.57 | 211.20 | 201.73 | 5.26 | |
| iWUE | 90.20 | 125.87 | 105.47 | 8.72 | |
| L. speciosa | δ13C | −27.03 | −25.98 | −26.50 | 0.28 |
| Δ13C | 18.05 | 19.64 | 19.00 | 0.40 | |
| Ci | 225.10 | 255.99 | 239.11 | 7.84 | |
| iWUE | 71.03 | 99.27 | 82.11 | 7.11 |
T, temperature; P, precipitation; VPD, vapour pressure deficit; py = previous year.
Climatic influences on iWUE
A significant increasing trend was observed in mean temperature and VPD concurrent with the increasing atmospheric CO2 concentration over 1950–2015 (Figure 1B). However, local precipitation showed a high inter-annual variability but did not show a significant trend over 1950–2015.
The high inter-series correlations (rbar.bt) and EPS values of δ13C chronologies (Table S2 available as Supplementary Data at Tree Physiology Online) indicate that the iWUE chronologies, which are derived from the mean δ13C series (detrended by fitting a smooth spline curve) of all the three species are robust and contain a common signal which can be related to climate variables. Both Tmean and VPD in the current year April had negative associations with iWUE in C. tabularis (Figure 3). Water-use efficiency was also inversely related with previous year precipitation (August and November). The current year June temperature was negatively correlated with iWUE in T. ciliata. However, the strongest correlation of iWUE in T. ciliata was observed with previous year June temperature (Figure 3). Precipitation and VPD had no significant influence on iWUE in T. ciliata in our study sites. Water-use efficiency in L. speciosa was strongly negatively connected with the current year June temperature (r = 0.64, P < 0.001) and August precipitation. Overall, climate variables explained 41–51% of the total variation in iWUE, depending on species. The highest and lowest amounts of variation were explained for L. speciosa and C. tabularis, respectively (Figure 4). The LME model results are shown in Table 3.
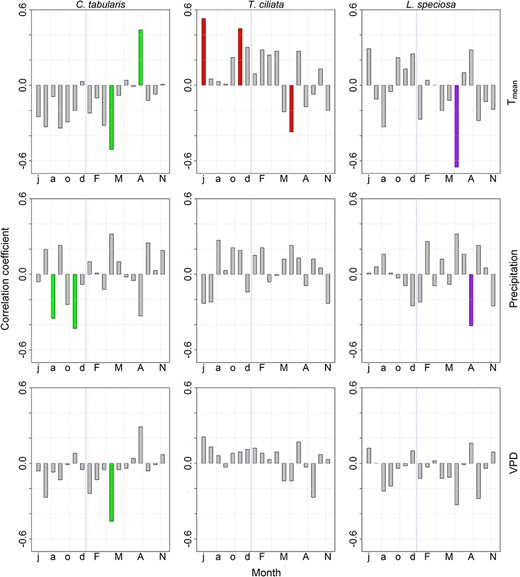
Relationships between climate variables and intrinsic water-use efficiency (iWUE) (detrended, spline-filtered chronologies) for three South Asian tropical moist forest tree species. The upper-case letters indicate months of the current year. The lower-case letters indicate months of the previous year.
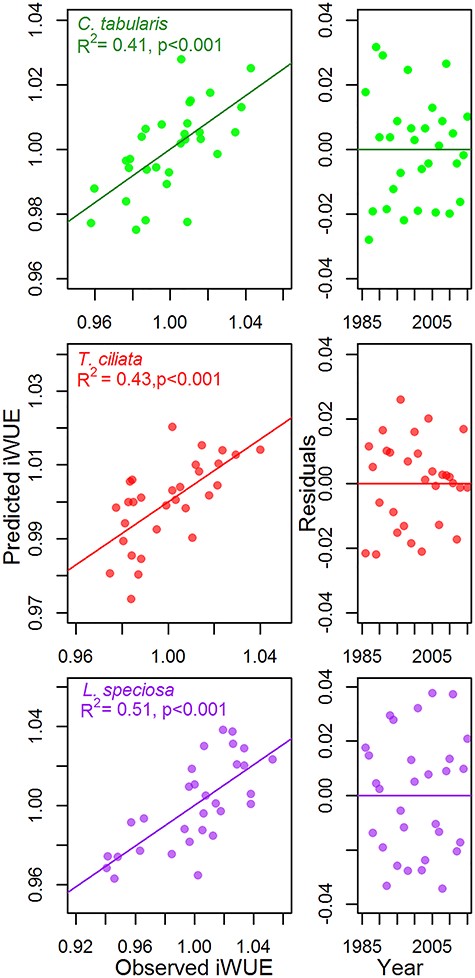
Relationships between observed and predicted intrinsic water-use efficiency (iWUE) and the residual values of the predicted models for three South Asian tropical moist forest tree species. Climate and atmospheric CO2 were included as the fixed factors (see Table 3). Tree-height and diameter at breast height were considered as random factors in the mixed effect model for the three species.
Relative contribution of Ca and climate in iWUE variability
We disentangled the effects of the climate variables and atmospheric CO2 on iWUE by CA. Since iWUE was calculated from Ca, examining iWUE as a role of Ca is somewhat circular in reasoning. Therefore, we examined Ci/Ca instead of iWUE in CA and thus, the influence of Ca was factored out and changes in iWUE remained independent of long-term trend in Ca. Commonality analysis revealed a dominant influence of climate on the Ci/Ca of all the three species when analyzed with detrended data (Figure 5A). The relative contribution of temperature was higher than the other variables in explaining Ci/Ca variability, ranging between 49 and 74% depending on the species. The pure effect of temperature was highest in T. ciliata (74%) and lowest in C. tabularis (49%). On the other hand, the highest and lowest pure effects of precipitation were found in C. tabularis and T. ciliata, respectively. The maximum pure effect of Ca was found in L. speciosa (11%), whereas the least pure effect of Ca was found in C. tabularis (0.5%). The joint effect of temperature and precipitation was highest in C. tabularis (31%) and lowest in T. ciliata (13%).
When long-term trends were retained in the iWUE values, the influence of Ca became prominent over the climate variables (Figure 5B). The pure effect of Ca ranged between 68 and 94%, with highest and lowest percentages in T. ciliata and L. speciosa. The highest pure effect of temperature was found in L. speciosa (25.1%). The maximum joint effect was shared by Ca and precipitation observed in T. ciliata (7%).
Discussion
Long-term changes in tree-ring variables
In general, we observed an increasing iWUE and a decreasing Δ13C in our studied species. Increasing water-use efficiency is a common response to rising atmospheric CO2 concentration observed in all studies conducted in different tropical forest sites (Silva and Anand 2013, van der Sleen et al. 2014). However, the magnitude of increase in iWUE varied across species and sites (Nock et al. 2011, Silva and Anand 2013, van der Sleen et al. 2014, Fu et al. 2017). In our studied species, iWUE increased between 29 and 46% over the past three decades. The high variation in the increase in iWUE might be attributed to the topographic variation of the species occurrence. Chukrasia tabularis grows on the slopes of hills, whereas L. speciosa is found in low lying flood plain areas. In the floodplain, L. speciosa likely optimized its carbon fixation without strong stomatal regulation due to sufficient water supply from high soil moisture content in the clayey loamy soils, resulting in low iWUE. On the other hand, C. tabularis growing on sandy loamy soils on hill slopes containing lower moisture content showed highest economic use of water for carbon gain, leading to a higher iWUE.
The range of increase in iWUE in our studied species is much higher than the iWUE increase of 30–35% observed in an earlier study conducted on 12 tree species in three tropical forest sites and calculated over 150 years (van der Sleen et al. 2014). A lower increase in iWUE (10–17%) over the period from 1950 to 2005 was also observed in subtropical forests in Brazil and Argentina (Silva et al. 2009, Sun et al. 2010). The difference in the magnitude of change in iWUE might be linked to differences in site conditions (e.g., annual precipitation amount) between tropical forest sites (Yu et al. 2005). It is also possible that differences in the methods to remove ontogenetic effects on iWUE might have caused this variation in iWUE trend between two studies. van der Sleen et al. (2014) followed the size-class isolation method to remove the effects of tree size (diameter) on iWUE. In our study, we detrended iWUE series by fitting a spline function and thus removed low frequency signals that are mostly associated with ontogenetic trends. We further used tree-height as a random factor in a mixed effect model to avoid effects of tree-height on iWUE, because tree-height strongly affects iWUE in tropical trees (Brienen et al. 2017). With increasing tree-height, iWUE may double or even triple over a tree’s lifespan (Brienen et al. 2017). A stronger increase in iWUE may also be caused by site degradation due to increasing disturbance intensity over time (Yu et al. 2005). However, our sampling sites represent the core zone of a nature reserve and thus were not subjected to large-scale anthropogenic disturbances. Consistent with our results, a similar magnitude of increase in iWUE (40%, during the past four decades) was found in Mimosa acantholoba from a tropical dry forest of the southern Mexico (Brienen et al. 2011), although the authors did not control for ontogenetic effects, and thus their estimate may contain a juvenile effect.
Increasing water-use efficiency in association with decreasing carbon discrimination generally implies that trees are growing under water-stress conditions at least for a part of growing season (Korol et al. 1999). It is, however, possible that decreasing carbon discrimination may be a result of atmospheric CO2 increase, increase in photosynthesis rates or temperature effects on mesophyll conductance. Taking the mesophyll conductance effect into account improved model estimates for iWUE (Cintra et al. 2019). Their model took both mesophyll conductance and photorespiration effects together into account (Farquhar and Von Caemmerer 1982, Seibt et al. 2008), which is currently not addressed in our study. Nevertheless, von Caemmerer and Evans (2015) investigated the temperature response of mesophyll conductance for nine species, including both trees and herbs. Herb species showed strong responses to temperature, while cool environment and tropical trees were relatively insensitive to temperature. Quantification of the temperature effect on carbon isotope discrimination during diffusion through mesophyll in tropical trees therefore calls for further studies.
Most of the long-term variation in iWUE in our studied species was explained by rising atmospheric CO2 concentration (Figure 5B). Explanation of nearly 86% of the total variation by Ca indicates that long-term iWUE trends are driven mainly by the increasing Ca and not by temperatures or precipitation changes. In line with our findings, increased assimilation rate due to rising atmospheric CO2 drove long-term increase in iWUE in tropical (Nock et al. 2011, van der Sleen et al. 2014), temperate (Rezaie et al. 2018), boreal (Xu et al. 2018, Giguère-Croteau et al. 2019), Mediterranean (Granda et al. 2014, Martínez-Sancho et al. 2018) and subtropical forests (Li et al. 2017, Weiwei et al. 2018).
Restricted maximum likelihood parameter estimates and model skills of linear mixed effect models (fixed effects) predicting iWUE of three South Asian tropical moist forest tree species.
| Species | Estimates | Value | SEM | DF | t-value | P-value | R2 | AIC | BIC | logLik |
|---|---|---|---|---|---|---|---|---|---|---|
| C. tabularis | (Intercept) | 0.73 | 0.35 | 25 | 2.09 | 0.05 | 0.41 | −110.93 | −101.18 | 63.47 |
| T_Apr | −0.19 | 0.13 | 25 | −1.39 | 0.18 | |||||
| T_Aug | 0.47 | 0.30 | 25 | 1.57 | 0.13 | |||||
| VPD_Apr | −0.01 | 0.03 | 25 | −0.36 | 0.72 | |||||
| P_py_Nov | 0.00 | 0.00 | 25 | −1.20 | 0.24 | |||||
| T. ciliata | (Intercept) | 0.65 | 0.28 | 26 | 2.33 | 0.03 | 0.43 | −144.20 | −135.40 | 79.10 |
| T_py_Jun | 0.43 | 0.18 | 26 | 2.43 | 0.02 | |||||
| T_Jun | −0.26 | 0.17 | 26 | −1.47 | 0.15 | |||||
| T_py_Nov | 0.17 | 0.09 | 26 | 1.98 | 0.06 | |||||
| L. speciosa | (Intercept) | 2.23 | 0.27 | 27 | 8.21 | 0.00 | 0.51 | −105.06 | −97.28 | 58.53 |
| T_Jun | −1.20 | 0.27 | 27 | −4.37 | 0.00 | |||||
| P_Aug | 0.00 | 0.00 | 27 | −2.20 | 0.04 |
T, temperature; P, precipitation; VPD, vapour pressure deficit; py = previous year.
However, increasing iWUE and decreasing Δ13C may not always be reflected by long-term trends in stem radial growth. Our previous studies on the radial growth of the same species found no sign of any long-term increase in tree growth (Rahman et al. 2017), but rather found strong negative relationships with temperatures and a projected tree growth decline with higher expected future temperatures (Rahman et al. 2018). The positive relationship between iWUE and tree growth was also absent in a previous study across the tropics (van der Sleen et al. 2017a), indicating either an absence of CO2 fertilization in tropical trees, or that tree growth in tropical regions is limited by other factors than atmospheric CO2. It is, however, important to note that detecting the CO2 radial growth fertilization effect is not straightforward, since also multiple biases related to tree demography might influence long-term growth trends (Brienen et al. 2016)
Intrinsic water-use efficiency and climate: inter-annual variation
Overall, mixed models successfully simulated the iWUE in our studied species. Climate variables explained 41–51% of the total iWUE variability (Figure 4). Adjustment in water-use efficiency might be one of the adaptation strategies of plants to cope with water limitation (Tardieu et al. 2014, Blankenagel et al. 2018). Intrinsic water-use efficiency is a function of assimilation rate and water loss by stomatal conductance (Farquhar et al. 1982). Thus, the rising atmospheric CO2 concentrations might be linked with tree-ring δ13C-derived iWUE (Battipaglia et al. 2013). However, water loss by transpiration can be influenced by stomatal conductance as well as by climatic conditions, particularly leaf-to-air VPD (Turner et al. 1984), suggesting that iWUE might also be linked with climate (Rezaie et al. 2018). We simulated iWUE, taking climate variables as the fixed factors and tree-height as the random factor in a mixed effect model and found that current and previous year temperature and precipitation as well as current year VPD significantly influenced iWUE in our studied species (Table 3).
In response to increasing temperature, ability to increase iWUE is a competitive advantage for C3 plants (Tardieu et al. 2014). Some earlier studies reported positive relationships between iWUE and high air temperature (Seibt et al. 2008; Battipaglia et al. 2014). In contrast to earlier findings, our species negatively responded to higher temperatures (Figure 3). The iWUE in one of the studied species (C. tabularis) reacted negatively to high VPD. These findings are in line with the results of an experimental study conducted in a reforestation site that reported negative relations of iWUE with VPD (Grossnickle et al. 2005). A strong negative correlation of iWUE with pre-monsoon and monsoon temperature and VPD likely implies that higher temperature might have caused photosynthetic limitation and higher evapotranspiration, leading to a decrease in iWUE (Seibt et al. 2008). Multiple evidences suggest that leaf-level photosynthesis in many tropical forests might already have reached a high temperature threshold (Mau et al. 2018, Pau et al. 2018). It was also reported that water limitation significantly suppressed leaf-level photosynthesis (Urban et al. 2017a). It is therefore possible that, in unusually warm years, elevated temperatures induce increased stomatal conductance, restrict photosynthesis and thus limit iWUE in our sites (Urban et al. 2017b).
The species-specific differences in iWUE responses to climate as observed in the current study might be linked with species-specific life history strategies. Nonetheless, there is evidence that shade-tolerant and light-demanding species do not differ in their leaf-level water-use efficiency (Poorter 2005), suggesting that both pioneer and climax species fix the same amount of carbon per unit water loss. It was also reported that fast-growing pioneer species show higher iWUE than slow-growing late successional tropical trees (Wang et al. 2013). In contrast, Bonal et al. (2000) found higher iWUE in shade-tolerant species than in pioneer species. These contradictory reports may imply that more studies are required to test the iWUE response to climate across the leaf and wood economic spectrum of tropical tree species.
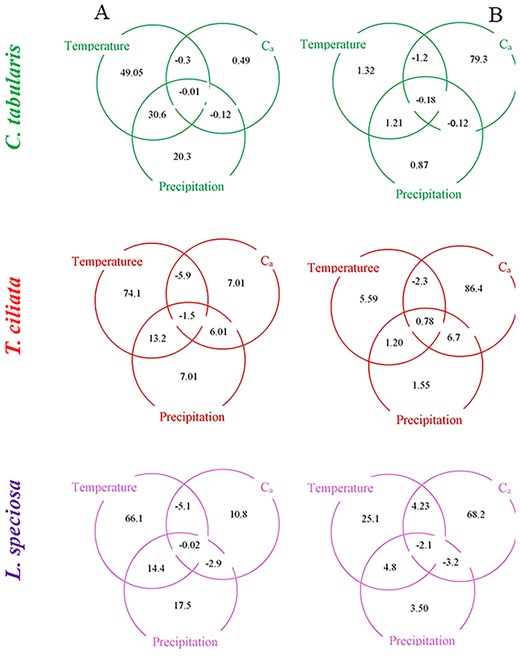
Commonality analysis results displaying the proportion of contribution (%) of temperature, precipitation and atmospheric CO2 in explaining the variability of Ci/Ca three South Asian tropical moist forest tree species. In case of climate variables, only the monthly values that were significant in the direct correlations (Figure 3) were used. (A) Ci/Ca values were detrended to remove the long-term trend and retain the inter-annual variability (spline-filtered chronologies). (B) Non-detrended Ci/Ca (original values) and atmospheric CO2 values were used.
According to the mixed model results, iWUE in L. speciosa showed the highest sensitivity to climate (R2 = 51, P < 0.001). Possible causes might be linked with tree stature and canopy position in natural forest conditions. Lagerstroemia speciosa is a slow-growing, shade-tolerant species attaining a lower height than the two other studied light-demanding species. Existing evidence suggests that iWUE increases with tree-height (Brienen et al. 2017). Light availability also directly influences iWUE (Navarro-Cerrillo et al. 2016, Brienen et al. 2017). It is thus likely that lower tree-height and light availability made L. speciosa more vulnerable to photosynthetic limitation. An increase in temperature above the optimal level for photosynthesis in the main growing season may further reduce assimilation, affecting iWUE negatively as we observed in L. speciosa (Figure 3). Some studies suggest that many tropical forests have already reached the temperature threshold for leaf level photosynthesis (Mau et al. 2018, Pau et al. 2018). In our study site, the maximum temperature exceeded 32 °C on >50% of the days during the wet season (April–October) (data not shown). It is therefore possible that iWUE in L. speciosa (with height and canopy limitations) showed higher climate sensitivity. It is also likely that L. speciosa is more climate sensitive because of higher transpiration due to higher stomatal conductance. However, further studies are needed to support this hypothesis.
What triggers iWUE variability in tropical trees: atmospheric CO2, climate or both?
Temperature exerted a dominant influence on the inter-annual variability of Ci/Ca in all three study species as revealed by the CA (Figure 5A). Temperature had the highest pure effects, although the relative importance of temperature, precipitation and Ca in explaining iWUE variability varied between species. The inter-species difference in the relative importance of each variable implies that tree’s life history strategies (ecological guild) are important in determining gas exchange response of tropical trees to global change factors (Mastrotheodoros et al. 2017, Zhang et al. 2018). For instance, the strong light-demanding pioneer T. ciliata showed higher sensitivity of iWUE to temperature than the partial shade-tolerant C. tabularis and shade-tolerant L. speciosa. Likewise, precipitation sensitivity of Ci/Ca was higher in C. tabularis than in the two other species, likely because of lower tolerance of water logging in the late monsoon season (Orwa et al. 2009). The weaker influence of precipitation than of temperatures probably lies in the fact that our study sites receive ~2400 mm rainfall annually (Figure 1A), providing sufficient soil moisture for tree growth. However, higher temperatures might increase evapotranspiration, leading to soil moisture deficit (Rahman et al. 2019a), which results in higher sensitivity to water stress aggravated by elevated temperature in our studied species. A very small contribution of Ca (0.5–11%) in explaining inter-annual variability of iWUE in our studied species suggests that atmospheric CO2 is not so important in explaining the short-term (inter-annual) variability in Ci/Ca.
Above all, we demonstrate that the ecophysiological responses to the past environmental changes can be reconstructed from the stable carbon isotope fractionation in South Asian tropical moist forests. We identified the driving factors of inter-annual variability and long-term patterns of iWUE in three tropical moist forest tree species in Bangladesh and disentangled their relative contributions. Inter-annual variability in iWUE was mainly triggered by climatic factors, whereas the long-term variation in iWUE was explained by atmospheric CO2. Among the climatic factors, temperatures had the dominant influence on the inter-annual variability in iWUE in all the three species over precipitation. Our analysis suggests that the global warming is detrimental to the gas exchange response of South Asian tropical moist forest species.
Acknowledgments
We sincerely acknowledge the support of Bangladesh Forest Department during the field work. We are thankful to Roswitha Hoefner-Stich and Christoph Mayr for their support during the cellulose extraction and isotope analysis. We also acknowledge the support of Iris Burchardt during the wood sample preparation and cellulose homogenization.
Conflict of interest
None declared.
Funding
Research Grants-Doctoral Program in Germany 2015–2016 provided by the German Academic Exchange Service (DAAD) (Grant no. 57129429).
