


Abstract
Gap formation increases the light intensity in the forest understorey. The growth responses of seedlings to the increase in light availability show interspecific variation, which is considered to promote biodiversity in forests. At the leaf level, some species increase their photosynthetic capacity in response to gap formation, whereas others do not. Here we address the question of whether the interspecific difference in the photosynthetic response results in the interspecific variation in the growth response. If so, the interspecific difference in photosynthetic response would also contribute to species coexistence in forests. We also address the further relevant question of why some species do not increase their photosynthetic capacity. We assumed that some cost of photosynthetic plasticity may constrain acquisition of the plasticity in some species, and hypothesized that species with larger photosynthetic plasticity exhibit better growth after gap formation and lower survivorship in the shade understorey of a cool-temperate deciduous forest. We created gaps by felling canopy trees and studied the relationship between the photosynthetic response and the subsequent growth rate of seedlings. Naturally growing seedlings of six deciduous woody species were used and their mortality was examined for 8 years. The light-saturated rate of photosynthesis (Pmax) and the relative growth rate (RGR) of the seedlings of all study species increased at gap plots. The extent of these increases varied among the species. The stimulation of RGR over 4 years after gap formation was strongly correlated with change in photosynthetic capacity of newly expanded leaves. The increase in RGR and Pmax correlated with the 8-year mortality at control plots. These results suggest a trade-off between photosynthetic plasticity and the understorey shade tolerance. Gap-demanding species may acquire photosynthetic plasticity, sacrificing shade tolerances, whereas gap-independent species may acquire shade tolerances, sacrificing photosynthetic plasticity. This strategic difference among species would contribute to species coexistence in cool-temperate deciduous forests.
Introduction
Gap formation caused by disturbances or senescence of canopy trees increases light intensity in the forest understorey, which is essential for tree regeneration in forests (Ellenberg 1939, Watt 1947, Naka 1982, Nakashizuka and Numata 1982, Denslow et al. 1990, Ryel and Beyschlag 2000). Most understorey seedlings are not able to grow into a canopy tree without gap formation (Denslow 1987, Whitmore 1996, Bungard et al. 2000). The increase in irradiance enhances photosynthesis rates and stimulates the growth of seedlings (Pearcy 1983, Canham 1988). Space for the young trees to expand their branches is also provided by gap formation. Subsequent to gap formation, the growth responses of seedlings to the increase in light availability show interspecific variation, which is considered one of the factors contributing to the coexistence of species and may promote biodiversity in forests (Phillips et al. 1994, Grubb et al. 1996, Hiura et al. 1996, Aiba and Kohyama 1997, Beckage and Clark 2003, Pearson et al. 2003, Silvertown 2004, Poorter and Kitajima 2007). If the response to gap formation was similar among different species, the coexistence of these species may become difficult because of the competitive exclusion principle. However, the interspecific variation in response to gap formation indicates niche separation in terms of using light resources (Aiba and Kohyama 1997). Therefore, the growth response to the increase in light availability has been studied in many species (Langenheim et al. 1984, Whitmore and Brown 1996, Poorter 1999, Valladares et al. 2000).
At the leaf level, changes in photosynthetic capacity occur in response to gap formation. These changes can be achieved by the acclimation of leaves that have already developed before gap formation and/or by the production of new leaves with different properties. Which of these responses occurs has been found to vary with species (Loach 1967, Pearcy and Sims 1994, Valladares et al. 2000, Yamashita et al. 2000, Oguchi et al. 2005, Rodriguez-Calcerrada et al. 2008). Some species increase their photosynthetic capacity per leaf area to maximize the efficiency of light use under the higher light condition, whereas others do not respond or even decrease their photosynthetic capacity, often as a result of photoinhibition (Chazdon 1992, Mulkey and Pearcy 1992, Lovelock et al. 1998, Krause et al. 2001).
Does this interspecific difference in the photosynthetic response contribute to the variation in the growth response subsequent to gap formation and contribute to species coexistence in forests? The answer to this question remains unclear. Not only the photosynthetic capacity of leaves, but also the morphological traits such as the leaf area ratio (LAR; leaf area per plant mass) and specific leaf area (SLA; leaf area per leaf mass), affect the growth rates of seedlings (Grubb et al. 1996, Wright and Westoby 2000). Besides, both photosynthetic capacity and the morphological parameters could be acclimating to the newly formed gap condition (Loach 1970, Grime 1979, Valladares et al. 2000); thus, both acclimation processes—physiological and morphological—may affect the subsequent growth of seedlings. For example, in within-species responses, high photosynthetic capacity per leaf area requires a high nitrogen cost per leaf area (Hikosaka and Terashima 1995, Terashima et al. 2001), therefore some plants might be required to decrease total leaf area to increase their photosynthetic capacity per leaf area, especially when nitrogen resources are limited. This may mitigate the contribution of the photosynthetic response to the carbon uptake. Actually, many species show lower LAR in high light compared with low light, and such morphological plasticity varies among species (Loach 1970, Valladares et al. 2000). If the within-species plasticity of the morphological traits shows a large interspecific variation in response to gap formation, the interspecific variations of growth after gap formation may depend not on the photosynthetic plasticity but on the morphological plasticity. Many studies have examined the photosynthetic response of seedlings to changes in the light environment, which mimicked gap formation (Naidu and Delucia 1997a, 1997b, Yamashita et al. 2000). For example, in Kitajima (1994), morphological and photosynthetic traits of seedlings were studied in sun and shade conditions and morphological variables showed stronger correlations with the mortality in shade than photosynthetic variables among 13 tropical species. In Valladares et al. (2000), the gap species showed a higher mean phenotypic plasticity of seven photosynthetic and morphological traits than shade species. However, the previous studies examined relatively short-term (<1 year) growth responses of newly germinated seedlings, which may be affected by seed quality and other nursery environments and not necessarily reflect the actual performance of understorey young plants. Besides, most of the studies were conducted with tropical or subtropical species and studies with temperate deciduous species, which have considerably smaller range of leaf lifespan compared with the tropical species, are still scarce (e.g., a study with two deciduous species by Einhorn 2007).
One more question remains regarding photosynthetic plasticity: why does the photosynthetic acclimation capacity vary among species? The costs of high photosynthetic capacity, e.g., high respiration rate, high nitrogen content and high light compensation point, have been reported by previous studies (Boardman 1977, Mooney and Gulmon 1979, Björkman 1981), therefore maintaining high photosynthetic capacity is considered to be too costly for success in the shade conditions (Mooney and Gulmon 1979). However, photosynthetic plasticity does not require such costs of high photosynthetic capacity in shade, because photosynthetic plasticity is the ability to develop shade leaves with lower photosynthetic capacity in low light condition and to develop sun leaves with higher photosynthetic capacity only in high light conditions. If this photosynthetic light acclimation could improve the subsequent growth of seedlings, why is it that some species do not increase their photosynthetic capacity subsequent to gap formation? Although previous studies, especially in the 1970s and 1980s, studied what type of species show high photosynthetic plasticity (Loach 1967, Grime 1979), the physiological mechanisms underlying the interspecific variation of plasticity have note yet been elucidated, and the eco-physiological meaning of the interspecific variation is still unclear. For example, it has been hypothesized that pioneer species should be expected to exhibit greater phenotypic plasticity than late-successional species (Bazzaz 1979, Bazzaz and Carlson 1982). However as Rijkers et al. (2000) suggested, increasing evidence has indicated that plasticity is not necessarily related to the successional status of a species (Turnbull 1991, Popma et al. 1992). We assumed that the photosynthetic plasticity may incur costs, such as maintenance, production, information acquisition (e.g., cost of sensors and signal transduction pathways), developmental instability (i.e., noise caused by developmental error and environmental uncertainty) and genetic costs, which were originally suggested as potential costs of phenotypic plasticity by DeWitt et al. (1998). For example, we previously showed that plants need to cope with production cost to have an extra leaf thickness for acquiring the light acclimation capacity of fully developed leaves (Oguchi et al. 2003, 2005). Fully developed leaves usually lost the ability to change their thickness, therefore extra leaf thickness to possess the space for increasing the amount of chloroplasts is necessary for the plasticity to respond to the increase in irradiance. Because the frequency of gap formation is much less than the frequency of seedling germination and not all seedlings can benefit from gap formation, the strategy underlying the investment in the photosynthetic light acclimation capacity should vary among species. If the species is not gap demanding, an investment in the cost of the photosynthetic light acclimation would be wasteful and thus the acclimation capacity would not be acquired. In fact, some previous studies detected a reduction in fitness related to phenotypic plasticity in several traits such as leaf petiole and internode lengths, suggesting that these costs may constrain the evolution of these plasticities in some species (Dorn et al. 2000, Weijschede et al. 2006, Dechaine et al. 2007, Bell and Galloway 2008). Although there are not enough clues to suggest a particular cost of photosynthetic plasticity so far (see Lambers et al. (2008) for the mechanism of photosynthetic plasticity), the present study considered that the cost of the photosynthetic plasticity would negatively affect the survivorship in shade conditions. A meta-analysis by Walters and Reich (1999) suggested that there was no clear correlation between photosynthetic plasticity and shade tolerance. However, they used a wide variety of species that do not coexist in a forest, and the shade tolerance was not based on mortality measurement but on published tolerance classifications. In the present study, we hypothesized that if we compare multiple coexisting species in one forest, species with larger photosynthetic plasticity will show better stimulation of growth after gap formation and lower survivorship in the shade understorey.
To test the hypothesis and answer the above questions, we conducted a long-term monitoring of photosynthetic capacity, growth rate and mortality of naturally grown tree seedlings, which responded to gap formations created by felling canopy trees in a natural cool-temperate deciduous forest. The forest has not been planted or managed by humans nor grazed by livestock until the creation of three gaps, which imitates canopy tree falling because of strong winds. We used six deciduous woody species belonging to three different life forms. In our previous study, we reported interspecific differences in the mechanisms underlying photosynthetic light acclimation in already fully developed leaves during the first year subsequent to gap formation as well as the effect of the photosynthetic responses of the already developed leaves on the leaf carbon balance (Oguchi et al. 2006, 2008). In the present study, we further report on the responses of newly developed leaves during the years following the gap formation and their effect on the growth rates of the seedlings. The photosynthetic responses and growth rates were continuously examined for 4 years, and the mortality was analysed 8 years after the gap formation.
Materials and methods
The study site
The study site is located in the Tomakomai Experimental Forest (TOEF), Hokkaido University, Hokkaido, Japan (42°41′N, 141°36′E, 65 m elevation; see Hiura (2001) for details). The study site is 50 m wide and 120 m long, and was established on a flat plateau in the temperate deciduous broad-leaved forest. In this forest, canopy leaf expansion begins during the middle of May and leaf abscission begins during the middle of October. Seedlings expand their leaves after the canopy leaf expansion (Maeno and Hiura 2000, Takafumi et al. 2010). The densities of trees, which showed diameter from 10 to 100 mm and >100 mm, were 3164 and 718 ha−1, respectively. These values are comparable to that of other cool-temperate deciduous forests (Hiura 1995, Masaki et al. 1999). The monthly mean air temperature of the site from 1986 to 2000 ranged from −3.2 to 19.1 °C. The average annual rainfall of the site in the 15 years was 1200 mm. The soil at the study site was volcanogenous regosol comprising mainly classic pumice and sand (Shibata et al. 1998). The dominant species in the site were Quercus crispula, Acer mono, Sorbus alnifolia, Tilia japonica and Acer amoenum. Except for A. amoenum, these species are common dominant species of the forest, according to surveys in 38 other sites in the forest (Hiura 2001). Because of a large volcanic eruption that occurred ∼300 years prior to the current study, the age of the forest is relatively young. In addition, a large typhoon devastated the forest in 1954 (the Touya-maru typhoon), resulting in most of the canopy trees falling at that time. The average canopy height at the site was ∼18 m, and no canopy gaps larger than 2 m across existed before the experiment. The understorey of this mature secondary forest was mainly covered by ferns, among which Dryopteris crassirhizoma was the most dominant species. The dry mass of the foliage of understorey herbal and woody plants, which are <1 m tall, was 30–40 g m−2 (Takafumi and Hiura 2009).
On 19 July 2002, three gaps (each 10 m in diameter) were created along the longer axis of the site by pulling down one or two canopy trees using a cable attached to a bulldozer winch from outside the site. The size of the created gaps was equivalent to the size of naturally formed gaps most commonly observed in natural forests (Denslow 1987, Yamamoto 1989, Denslow et al. 1998). We called these three gap areas ‘gap plots’. We also established three plots for controls in the site near the gaps (see Figure S1 available as Supplementary Data at Tree Physiology Online).
During September 2004, i.e., 2 years after the initiation of the present study, a large typhoon (number 18) had major effects on the natural forest, causing many branches and leaves to fall. Although the damage was less severe than in a nearby area of densely planted forest, the light intensity at the control plots was increased by the damage (see Figure S2 available as Supplementary Data at Tree Physiology Online). The strike of a large typhoon is so infrequent in this area of Japan (Hokkaido island) that this increase in light intensity at control plots was an unexpected event. The geophysical data on the same typhoon, which hit other research forests on Hokkaido island, have been reported by Toda et al. (2011).
Plant materials
We studied naturally growing seedlings of six woody species: (i) Kalopanax pictus, (ii) Magnolia obovata, (iii) Q. crispula, (iv) A. mono, (v) Acer japonicum and (vi) Fraxinus lanuginosa (Table 1). These species belong to three different life forms. Kalopanax pictus and M. obovata are fast-growing canopy trees, Q. crispula and A. mono are dominant canopy trees and A. japonicum and F. lanuginosa are sub-canopy trees. Kalopanax pictus and M. obovata possess an orthotropic branching pattern, which is often seen in fast-growing species (Poorter et al. 2006), although their shade tolerance is high and they often grow up in gaps from saplings that already existed before gap creation (Yamamoto 1989, Cao and Ohkubo 1998, Hoshino et al. 2003). It should be also noted that M. obovata possesses extraordinarily large leaves for a northern cool-temperate forest tree (up to 30 cm long). Acer mono is characterized by its slow and less plastic growth, indicating that it is a typical slow-growing, shade-tolerant species (Koike 1988, Umeki 2001, Nabeshima and Hiura 2004). Quercus crispula is one of the dominant tall tree species, which form mature forests on alluvial plains in central and northern Japan (Sakai et al. 1999). Fraxinuslanuginosa and A. japonicum rarely reach the canopy layer (Hara 1985, Ishida and Hiura 1998, Nabeshima and Hiura 2008). At least two individuals per species were identified at each plot, and from 6 to 12 plants in total per species per condition (gap or control) were used. None of the seedlings was derived from vegetative regeneration. Most of the seedlings were 10–30 cm tall and the age of these seedlings was estimated to be 2–10 years old, based on the height-growth curves published for the study species by Fujimoto and Motai (1981). Although both study sites of the present study and that of Fujimoto and Motai (1981) were not fenced to exclude large herbivores, there was no observation of plants eaten by large herbivores, because of the low density of large herbivores.
The maximum height (Hmax), the branching pattern, the order of the shade tolerance observed in the present study (the inverse order of the 8-year mortality in the control plot) and the life forms of the six tree species that were used in the present study.
| Species | Hmax (m) | Branching pattern | Shade tolerance | Life forms |
|---|---|---|---|---|
| Kalopanax pictus | 25 | Orthotropic | Third | Fast-growing canopy tree |
| Magnolia obovata | 30 | Orthotropic | First | Fast-growing canopy tree |
| Quercus crispula | 30 | Ordinary | Sixth | Dominant canopy tree |
| Acer mono | 20 | Ordinary | Second | Dominant canopy tree |
| Acer japonicum | 10 | Ordinary | Fourth | Sub-canopy tree |
| Fraxinus lanuginosa | 15 | Ordinary | Fifth | Sub-canopy tree |
Environmental factors
During the first year after gap formation irradiances and air temperatures were measured every 15 min at the three gap and control plots (luxmeter, HLI and SLA08 for irradiance, thermistor WTA32-05+37 for the air temperature, Onset Computer Corp., Bourne, MA, USA) from 7 July to 18 August. Sensors were placed 30 cm above the ground. Luxmeters for gap plots and control plots were calibrated by a photosynthetic photon flux density (PPFD) sensor (LI-190SA, LI-COR Inc., Lincoln, NE, USA) using the diurnal variation in insolation in the forest understorey of a forest gap and a control plot, respectively, to convert lux into PPFD. Temperature sensors were covered with a plastic shade to avoid exposure to direct sunlight. Relative irradiance was calculated based on simultaneous measurements of irradiance at the gap or control plots and above the forest canopy. These measurements were conducted 20 times at each plot using two quantum sensors (LI-190SA) during a cloudy day before (6 July 2002) and after gap formation (9 September 2002). For every seedling, hemispherical canopy photographs were taken using a digital camera (Coolpix 990; Nikon, Tokyo, Japan) equipped with a fish-eye lens (FC-E8, Nikon). The hemispherical photographs were taken every summer from 2002 to 2005 to analyse the change in the light environment after gap formation. The top element of the lens was positioned 5–10 cm above the leaves and the camera was carefully levelled. The hemispherical photographs were analysed using the software program CanopOn2 (free software programmed by A. Takenaka available from: http://takenaka-akio.org/etc/canopon2/), assuming a standard overcast sky condition.
Mean air temperature was 0.2 °C higher at the gap plots than that at the control plots, although the mean maximum temperature at the gap plots was ~1 °C higher than that at control plots (Table 2). No significant differences in the mean air temperature between control and gap plots were reported in previous studies, although the maximum air temperature significantly increased when gap plots were exposed to direct sunlight (Naidu and Delucia 1998, Schmidt et al. 1998, Clinton 2003). Soil nitrogen availability did not show a large change after the gap formation (Oguchi et al. 2006).
Relative photosynthetic photon flux density (PPFD) calculated from the simultaneous measurements of irradiance at the gap and control plots and above the forest canopy, mean daily integrated PPFD, mean air temperature, and mean maximum and mean minimum air temperature at gap and control plots before and after the gap formation during 2002 (from 7 July to 18 July, and from 20 July to 18 August, respectively). The mean ± standard error are shown. The data are from Oguchi et al. (2006).
| Gap | Control | ||
|---|---|---|---|
| Relative irradiance (%) | Before | 1.77 ± 0.14 | 2.19 ± 0.28 |
| After | 10.6 ± 3.7 | 2.55 ± 0.40 | |
| Mean daily irradiance (mol m−2 day−1) | Before | 0.74 ± 0.13 | 0.54 ± 0.15 |
| After | 3.07 ± 0.41 | 0.54 ± 0.06 | |
| Mean temperature (°C) | Before | 17.5 ± 0.02 | 17.5 |
| After | 18.3 ± 0.01 | 18.1 | |
| Mean maximum/minimum temperature (°C) | Before | 19.9/15.8 | 19.8/15.8 |
| After | 21.8/16.3 | 20.8/16.3 |
Photosynthesis and leaf characteristics
Every mid-August from 2002 to 2005, photosynthetic rates were determined using a portable open gas exchange system (LI-6400, LI-COR Inc.). Light was provided by a light emitting diode (model 6400-02B, LI-COR Inc.). During the first year (2002), only leaves that ceased expansion before gap formation were used for the photosynthetic measurements. From the second year, the uppermost fully developed leaves were used. The photosynthetic rate was measured at 1500 μmol m−2 s−1 to obtain the light-saturated rate of photosynthesis per leaf area (Pmax). The leaf temperature was adjusted to 25 °C and the CO2 concentration was 380 μmol mol−1. Leaves were kept in the chamber for 10 min before the measurements. Because leaves were already photosynthesizing in the natural condition before the measurements, the changes in the stomatal conductance after clipping with the chamber were small, which was supported by the strong within-species correlation between Pmax and nitrogen content per leaf area (Narea) or chloroplast volume per leaf area (Oguchi et al. 2006). Each year, subsequent to photosynthesis measurements, three leaf discs (each 1 cm in diameter) were punched out of the leaf and dried at 80 °C in an oven for >3 days. After dry mass determination for calculating leaf mass per area (LMA), nitrogen content was determined using NC and element analysers (NC-80, Shimadzu, Kyoto, Japan and Vario EL III, Elementar Analysensysteme GmbH, Hanau, Germany).
Growth analysis, mortality observation and plasticity evaluation
The all branch length including main stem divided by height of the seedling was used for the indicator of the branching characteristic of species (see Figure S3 available as Supplementary Data at Tree Physiology Online).
Statistics
Statistical analyses were performed using the R software (ver. 3.1.1, available from http://www.R-project.org). The two-tailed t-test was used to test the effect of gap formation on Pmax, LMA, Narea and all branch length per height. The two-way factorial ANOVA was used to test the effect of gap formation and species on Pmax, LMA, Narea and canopy openness. The Pearson correlation test was performed to analyse the correlations among variables.
Results
Changes in environmental conditions
Subsequent to the gap formation during 2002, instantaneous relative PPFD under diffused sunlight increased from 1.77 to 10.6% and mean daily PPFD increased from 0.74 to 3.07 mol m−2 day−1 (Table 2). The average above-canopy daily PPFD from 19 July to 18 August 2002, observed at a flux tower near the plot, was 20.9 mol m−2 day−1. On a sunny day, PPFD of the gap plots was approximately twofold greater than that of the control plots under diffuse sunlight and was >10-fold greater than that of the control plots when exposed to direct sunlight. The mean temperature and mean vapour pressure deficit did not show a large change after gap formation; thus, we assumed that the increase in irradiance was the primary factor facilitating the photosynthetic acclimation and growth response (see Oguchi et al. 2006 and 2008 for details).
The fraction of open area in the canopy evaluated from the hemispherical photographs increased from 8 to 19% on average after the gap formation (P < 0.001 in the two-way factorial ANOVA). There was no significant difference in the fraction of open area among species (P = 0.244). Interaction between ‘gap formation’ and species for canopy openness was not significant either, as indicated by the two-way factorial ANOVA. The fraction of open area showed little change during 2003 and 2004, but increased during 2005 at the control plots, which was caused by the typhoon of 2004 (see Figure S2 available as Supplementary Data at Tree Physiology Online). As background information, the annual solar radiation obtained at a flux tower in the experimental forest showed little change from 2000 to 2008 (see Figure S4 available as Supplementary Data at Tree Physiology Online).
Responses of leaf traits
Figure 1 shows the yearly change in the photosynthetic capacity (Pmax) of the seedlings of the six deciduous trees species. The data in 2002 showed Pmax 30 days after the gap formation. All species showed a statistically significant increase in Pmax at the gap plots, although the extent of the increase was similar among these species. In 2003, new leaves that developed under the gap condition showed significant variation in Pmax among the six species. Magnolia obovata showed the smallest increase in Pmax (24.2% with no statistical difference), whereas Q. crispula showed the largest increase (82.7%). Pmax for all species at the gap plots in 2004 and 2005 showed little difference from that in 2003, except for K. pictus. After the hit of the typhoon in 2004, Pmax for all species at the control plots increased in 2005.
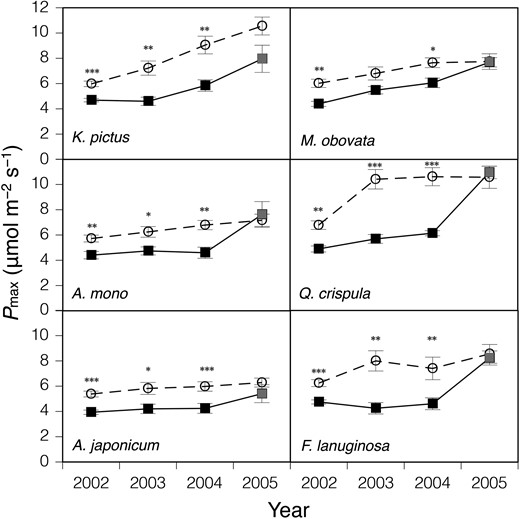
The change in light-saturated photosynthetic rate per leaf area (Pmax) after the gap formation, which was carried out on 19 July 2002. Seedlings of six deciduous species growing naturally at the control (closed squares) and gap (open circles) plots were used. The measurements were conducted with only leaves that ceased expansion before the gap formation in 2002, and with the uppermost newly developed mature leaves from 2003 to 2005. Bars denote ± standard error of the mean. *P < 0.05, **P < 0.01, ***P < 0.001. In September 2004, a large typhoon hit the northern part of Japan, which resulted in an increase in light intensity, particularly at the control plots in 2005 (see Figure S1 available as Supplementary Data at Tree Physiology Online). The increase in Pmax at the control plots in 2005 (grey squares) would be because of the typhoon disturbance (see text for details). See text for the full scientific names of the materials.
Leaf mass per area and Narea of the six species showed similar responses to Pmax (Figures 2 and 3), suggesting that the acclimation responses of leaf morphology contributed to the increase in Pmax from the next year of the gap formation, although the increases in LMA and Narea were not as great as those in Pmax in many cases. Leaf mass per area and Narea of understorey seedlings also increased in 2005 when the understorey light intensity was increased by the typhoon. In 2009, LMA and Narea of the gap condition decreased to a level similar to that before the gap formation, which suggested that the light intensity at the gap understorey had been decreased by the growth of canopy and young trees, although the canopy gap remained incompletely closed.
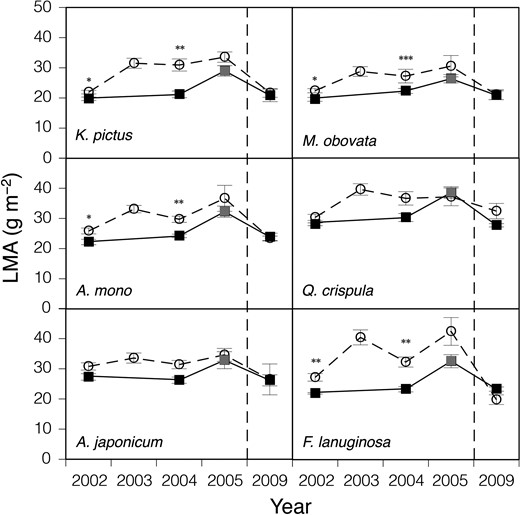
The change in LMA after the gap formation. Seedlings of six deciduous species naturally growing at the control (closed squares) and gap (open circles) plots were used. Bars denote ± standard error of the mean. *P < 0.05, **P < 0.01, ***P < 0.001. See legend of Figure 1 and text for details of leaves used and the full scientific names of the materials.
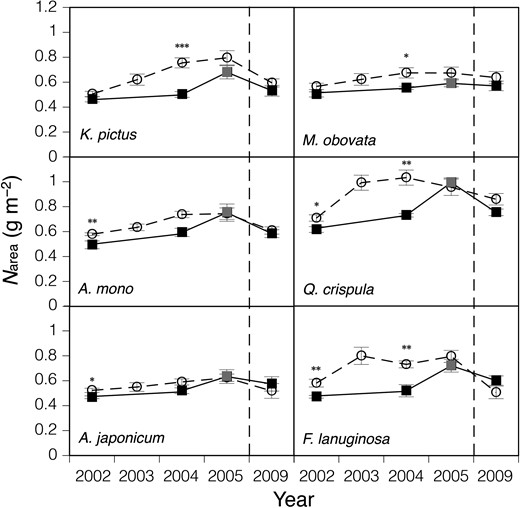
The change in nitrogen content per leaf area (Narea) after the gap formation. Seedlings of six deciduous species growing naturally at the control (closed squares) and gap (open circles) plots were used. Bars denote ± standard error of the mean. *P < 0.05, **P < 0.01, ***P < 0.001. See legend of Figure 1 and text for details of used leaves and the full scientific names of the materials.
Responses of growth rates and the effects of photosynthetic acclimation
The seedlings of all six species showed higher RGRs at the gap than at the control plots (Figure 4). The extent of the increase in RGR varied among the species and it was not significantly correlated to RGR at the control plots (P = 0.471). At the gap plots, Q. crispula and A. mono showed the highest and the lowest RGR, respectively, and at the control plots, M. obovata and A. japonicum showed the highest and the lowest RGR, respectively.
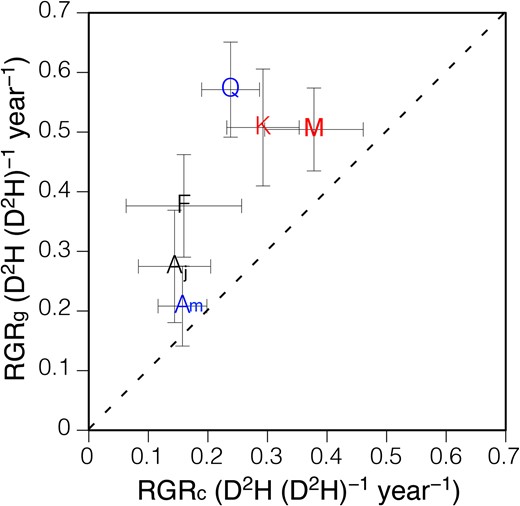
The relationship between relative growth rates (RGRs) of seedlings grown naturally at the gap plots (RGRg) and RGR of seedlings grown naturally at the control plots (RGRc) for six temperate deciduous tree species. Each point indicates a species mean and error bars denote the standard error. RGR was calculated from the change in D2H from 2002 to 2005. The initials M, K, F, Aj, Q and Am indicate Magnolia obovata, Kalopanax pictus, Fraxinus lanuginosa, Acer japonicum, Quercus crispula and Acer mono, respectively. Red symbols, black symbols and blue symbols indicate fast-growing canopy tree species, sub-canopy tree species and dominant canopy tree species, respectively. The dashed line indicates Y = X line.
When the control and the gap data were combined, Pmax in both 2002 and 2003 showed a significant correlation with RGR from 2002 to 2005 and from 2003 to 2005, respectively (Figure 5), although the correlation was not significant when the control and gap data were separated. The growth rates of the seedlings were better explained by Pmax of new leaves developed subsequent to gap formation than by Pmax of already developed leaves, which showed smaller gap response than the new leaves (Figure 1). Two fast-growing canopy tree species, M. obovata and K. pictus, were observed to show higher RGR than the other species when compared at the same Pmax (Figure 5b). As written in the previous section, Pmax in 2004 was similar to that in 2003, therefore the correlation between the average of Pmax from 2003 to 2004 and RGR from 2003 to 2005 was similar to the correlation between Pmax in 2003 and RGR from 2003 to 2005 (see Figure S5 available as Supplementary Data at Tree Physiology Online).
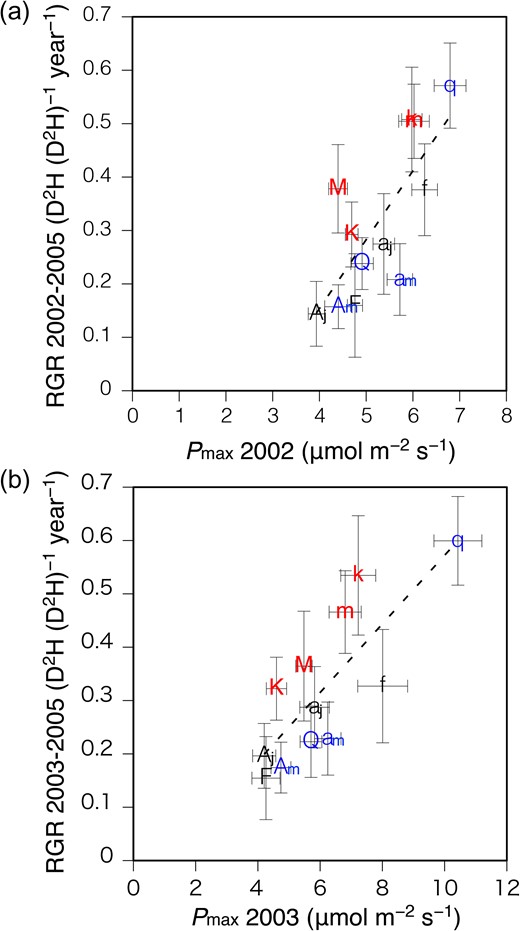
Relationship between light-saturated photosynthetic rate (Pmax) at 2002 and relative growth rate (RGR) from 2002 to 2005 (a), and relationship between Pmax at 2003 and RGR from 2003 to 2005 (b), among six tree species grown at control plots (capital letter symbols) and gap plots (small letter symbols). Error bars denote the standard error. The initials M, K, F, Aj, Q and Am indicate Magnolia obovata, Kalopanax pictus, Fraxinus lanuginosa, Acer japonicum, Quercus crispula and Acer mono, respectively. Red symbols, black symbols and blue symbols indicate fast-growing canopy tree species, sub-canopy tree species and dominant canopy tree species, respectively. Regression lines: (a) Y = 0.129X – 0.362, r2 = 0.585, P = 0.003; (b) Y = 0.0643X – 0.0709, r2 = 0.645, P = 0.002.
As expected from the strong correlation between RGR and Pmax, the extent of the increase in RGR following gap formation was strongly correlated with the plasticity of Pmax across the species (Figure 6, P = 0.012). It should be also noted that the relationship between RGR and Pmax plasticities in all species was close to a ratio of 1:1, except for Q. crispula.
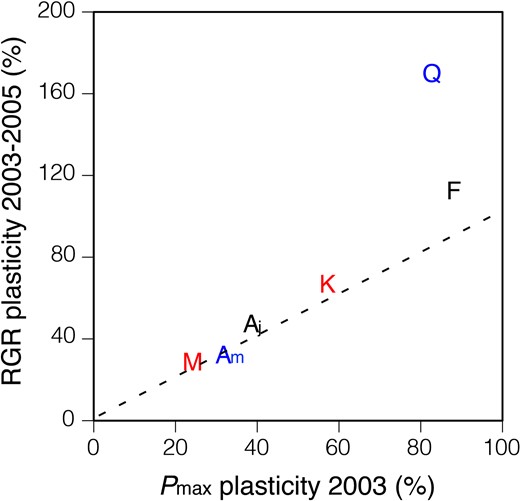
Relationship between plasticity of relative growth rates (RGRs) and plasticity of light-saturated photosynthetic rate (Pmax) for six temperate deciduous tree species. Plasticity was calculated from the extent of the increase in each trait of the seedlings in response to the gap formation. Each point indicates a species mean. RGR was calculated from the change in D2H. The initials M, K, F, Aj, Q and Am indicate Magnolia obovata, Kalopanax pictus, Fraxinus lanuginosa, Acer japonicum, Quercus crispula and Acer mono, respectively. Red symbols, black symbols and blue symbols indicate fast-growing canopy tree species, sub-canopy tree species and dominant canopy tree species, respectively. The dashed line indicates Y = X line.
Mortality of seedlings
The 8-year observation of the mortality showed that the fast-growing canopy trees, M. obovata and K. pictus, had the lowest and the third lowest mortality, respectively, in the control plots (Figure 7). All seedlings of these fast-growing canopy species survived in the gap plots. In the dominant canopy trees, A. mono showed the second lowest mortality, while Q. crispula showed the highest mortality in the understorey. Both species showed a low mortality in gap plots. Fraxinuslanuginosa and A. japonicum, the sub-canopy trees, showed a moderate mortality in the control plots and only A. japonicum showed a moderate mortality in gap plots. The correlations between all the measured variables and 8-year mortality are shown in Table 3. The extent of the increase in Pmax and RGR caused by gap formation significantly correlated with the 8-year mortality at the control plots (Figure 8), and such a correlation was not observed in the mortality at the gap plots. Leaf mass per area and Narea of the leaves grown in gap plots in 2003 were also significantly correlated with the mortality at control plots.
Correlation coefficients of the relationships between the 8-year mortality of the seedlings and values of the parameters at control plots (Control), values of the parameters at gap plots (Gap) and the response of the parameters to gap formation (Plasticity). Statistically significant correlations with the Pearson correlation test (P < 0.05) are shown in bold.
| Control | Gap | Plasticity | |
|---|---|---|---|
| Against mortality in control plots | |||
| Mortality | – | 0.317 | −0.498 |
| Pmax | 0.056 | 0.781 | 0.885 |
| RGR | −0.594 | 0.259 | 0.937 |
| LMA | 0.709 | 0.943 | 0.132 |
| Narea | 0.582 | 0.835 | 0.796 |
| Branching | 0.231 | 0.178 | −0.047 |
| Against mortality in gap plots | |||
| Mortality | 0.317 | – | 0.555 |
| Pmax | −0.109 | −0.088 | −0.130 |
| RGR | −0.458 | −0.264 | 0.076 |
| LMA | 0.877 | 0.155 | −0.811 |
| Narea | 0.246 | −0.028 | −0.298 |
| Branching | 0.831 | 0.858 | 0.159 |
Mortality was calculated as (Total number of dead seedlings from the gap formation to the end of summer 2009)/(Seedling number at the time of gap formation in 2002). Pmax means the light-saturated rate of photosynthesis per leaf area in 2003. Relative growth rate (RGR) was calculated from the change in D2H from 2003 to 2005. For leaf mass per area (LMA) and nitrogen content per leaf area (Narea), values of plants in control plots in 2002 were used for Control and values of plants in gap plots in 2003 were used for Gap. Branching values were calculated as (all branch length including main stem)/(height of the seedling) using the values in 2003. Plasticity was calculated as (Gap value/Control value) – 1.
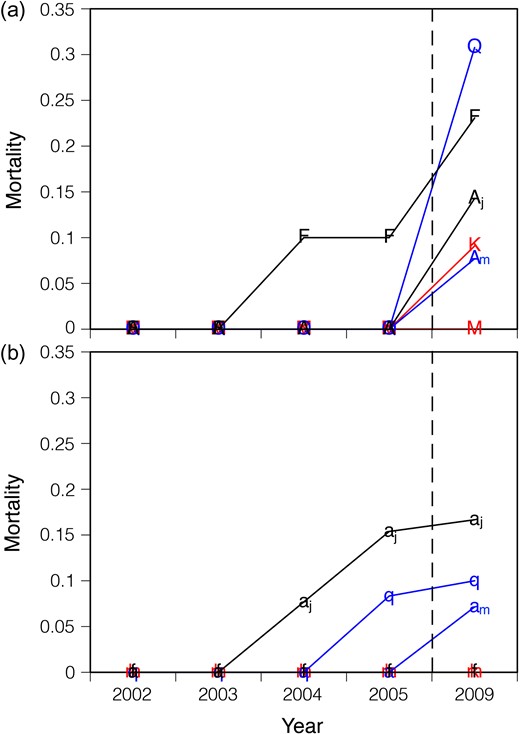
The change in mortality of seedlings from the gap formation at 2002 to 2009. Naturally growing seedlings of six temperate deciduous tree species at the control plots (a) and gap plots (b) were used. The initials M, K, F, Aj, Q and Am indicate Magnolia obovata, Kalopanax pictus, Fraxinus lanuginosa, Acer japonicum, Quercus crispula and Acer mono, respectively. Red symbols, black symbols and blue symbols indicate fast-growing canopy tree species, sub-canopy tree species and dominant canopy tree species, respectively.
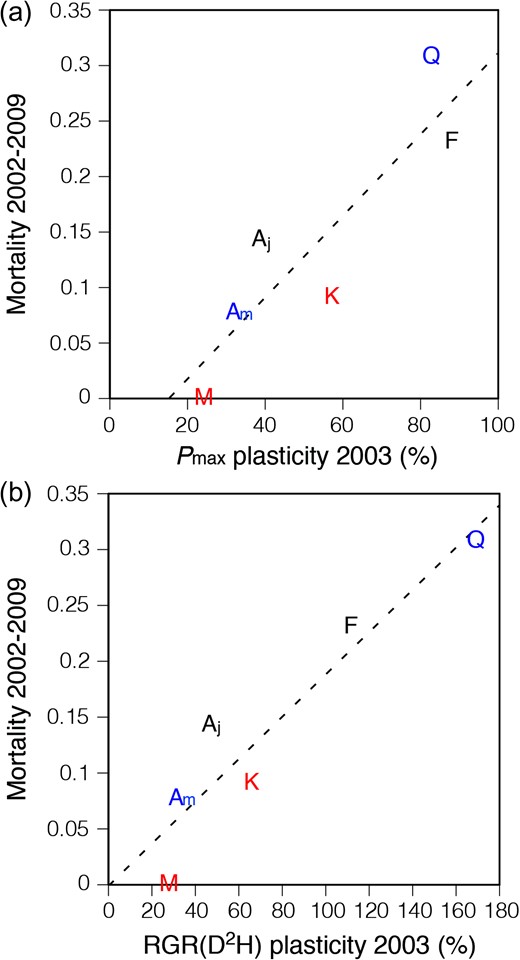
Relationship between mortality at the control plots from 2002 to 2009 and plasticity of light-saturated photosynthetic rate (Pmax, a) or plasticity of relative growth rates (RGRs) (b) for six temperate deciduous tree species. Plasticity was calculated from the extent of the increase in each trait of the seedlings in response to the gap formation. Each point indicates a species mean. RGR was calculated from the change in D2H. See legend of Figure 7 for the meaning of the initials used for the symbol (species names) and the meaning of the colours of the initials (life forms). Regression lines: (a) Y = 0.00367X – 0.0558, r2 = 0.783, P = 0.019; (b) Y = 0.00189X + 0.00105, r2 = 0.875, P = 0.006.
Discussion
The effect of photosynthetic light acclimation on subsequent growth
During 2002, the year of the gap formation, the already developed leaves of the seedlings increased their Pmax by 27–38% (Figure 1). In contrast, newly developed leaves in the year following gap formation increased their Pmax by 24–83%. The main reason for the smaller acclimation capacity of the already developed leaves as compared with the newly developed leaves may be the low plasticity of leaf anatomy in matured leaves (Sims and Pearcy 1992, Yamashita et al. 2002, Oguchi et al. 2003, 2006); to increase in their photosynthetic capacity, leaves are required to increase their thickness and mesophyll cell surface area for increasing the space available for chloroplasts, which require CO2 from the intercellular space (Evans et al. 1994, Terashima et al. 2001, Oguchi et al. 2005, Terashima et al. 2011). Pmax of the gap seedlings during the subsequent years in 2004 and 2005 was similar to those in 2003, suggesting that the photosynthetic capacity had been fully acclimated to the gap condition in the second year following the gap formation. Only for K. pictus, leaves may not have fully acclimated by 2003. This suggests that the timing of the influence of light environment on leaf developmental events may be variable among species as reported by Uemura et al. (2000).
The RGR from 2002 to 2005 varied among species, both at the control understorey and at the gap plots (Figure 4). There has been a debate about the relationship between RGRs in shade and in sun (Kitajima 1994, Sack and Grubb 2001, 2003, Kitajima and Bolker 2003). For example, Kitajima (1994) showed a strong positive relationship between RGR in shade and RGR in sun among 13 tropical tree species, whereas Agyeman et al. (1999) showed an opposite trend in 16 tropical tree species. In the present study, the relationship was not significant, which is also different from these previous reports. These differences could be explained partly by differences in the experimental conditions. For instance, the present study used seedlings of deciduous species, aged 2–10 years old, coexisting in a cool-temperate deciduous forest, whereas Kitajima (1994) used current-year seedlings of both deciduous and evergreen species in tropical forests. Seedlings of evergreen species often show lower growth rates and smaller growth responses to changes in light availability than seedlings of deciduous species (Reich et al. 1992, Cornelissen et al. 1996, Walters and Reich 1999), therefore, the low RGR and low responses of the young seedlings of such evergreen species would have resulted in a stronger correlation. In Agyeman et al. (1999), the growth light conditions were 2, 6, 10, 28, 44 and 66% of full sun, some of which were considerably higher than that of the gap site of the present study (10.6%). This difference in the light intensity of the high light condition may have caused different responses especially in shade-tolerant species, which tend to show large non-photochemical quenching and photoinhibition in high light conditions. Changes in canopy cover also involve changes in light quality, humidity and temperature, which may have played a role in the different responses among the studies. In the present study, the independency of RGR in the gap from RGR in the control suggests that the variation of the gap response of RGR was caused by the different dependencies of their growth on gap formation among the deciduous species, namely the different strategies between gap-demanding and gap-independent species.
To see the effect of the acclimation of photosynthetic capacity on the subsequent growth rate, RGR from 2002 to 2005 and RGR from 2003 to 2005 were plotted against Pmax in 2002 and 2003, respectively (Figure 5). Although RGR showed no correlation with Pmax when we see only the understorey, it showed a strong correlation with Pmax when the control and gap data were combined. The lack of correlation between RGR and Pmax in the understorey suggests that the growth rate of the seedlings in the understories of cool-temperate deciduous forests can be strongly affected by morphological traits such as LAR rather than physiological traits such as net assimilation rate (growth rate per leaf area), as has been shown in previous studies (Cornelissen et al. 1996, Reich et al. 1998). In the present study, the two fast-growing canopy tree species showed less branching than the other species, i.e., the ratio of all branch lengths per height was in the range of 1.07–1.32 in these two species and 1.54–2.46 in the other species (see Figure S3 available as Supplementary Data at Tree Physiology Online). It should also be noted that the two species showed the highest SLA values (the lowest LMA) among the six species (Figure 2). It is likely that these morphological differences resulted in a higher RGR in the two fast-growing canopy tree species when compared at the same photosynthetic capacity, which may have broken the correlation between RGR and Pmax in the understorey. The strong correlation between RGR and Pmax in the combined data of gap and understorey indicates that the growth of seedlings is strongly limited by the photosynthetic capacity during the forest succession process via gap formation and thus acclimation of both already expanded leaves and newly developed leaves after gap formation contributed to the stimulation of RGR. As discussed above, the variations in leaf lifespan and LMA among deciduous species, coexisting in cool-temperate deciduous forests, are considerably smaller than those among tropical species. Therefore, the variation in RGR resulting from the morphological differences among species is small, which would be one of the explanations as to why the light acclimation of photosynthetic capacity strongly affects the growth rate after gap formation in deciduous species coexisting in cool-temperate forests. Although the photosynthetic plasticity also varies among tropical and subtropical species (Popma and Bongers 1991, Yamashita et al. 2002), this effect on the variation of RGR may be masked by the large difference in RGR caused by the wide range of leaf lifespan and LMA among the tropical species.
The extent of the increase in RGR was strongly correlated with the extent of the increase in Pmax (Figure 6), even though these data included the two fast-growing canopy tree species, which showed a higher RGR when compared at the same photosynthetic capacity in Figure 5b. These results indicate that the growth of the seedlings subsequent to gap formation are strongly affected by photosynthetic plasticity in response to gap formation. In the species that showed large plasticity in Pmax, especially in Q. crispula, the extent of the plasticity in RGR was larger than the extent of plasticity in Pmax. This might suggest that the larger stimulation of photosynthetic rate resulted in the larger enhancement of height growth and thus the asymmetric advantage in competition for light. This would be a valuable report to show the strong effect of the early response of the photosynthesis capacity to gap formation on the subsequent growth rate of the understorey seedlings, which was conducted under the natural cool-temperate deciduous forest condition.
Life forms and the gap response capacity
The correlations between the life forms of species and plasticity in response to environmental heterogeneity have been discussed in previous studies on tree regeneration in forests (Cai et al. 2005, Ruger et al. 2012). For example, it has been hypothesized that taller tree species are more likely to experience large irradiance changes during their life cycle, so that they should exhibit greater light response (Rozendaal et al. 2006). Intrinsic growth rates were also reported to be correlated with light response (Ruger et al. 2012). In the present study, M. ovobata and K. pictus, known as fast-growing canopy tree species (Yamamoto 1989, Cao and Ohkubo 1998), both showed less branching and a higher RGR when compared at the same photosynthetic capacity (see Figure S3 available as Supplementary Data at Tree Physiology Online and Figure 5), but their gap responses in RGR and Pmax were slightly different from each other (Figure 6). The smallest gap response of M. ovobata in the present study indicated the smallest dependence of their growth on gap formation, whereas a relatively large gap response of K. pictus indicated a relatively large dependency. Although both species employ the same strategy to achieve a high RGR using orthotropic branching characteristics, thereby providing priority to height growth rates at the sacrifice of horizontal branching, their gap dependencies may be different from each other. Quercuscrispula and A. mono, known as the dominant canopy tree species in cool-temperate forests (Koike 1988, Umeki 2001), showed a remarkably different response to the gap formation. A small gap response of A. mono in Pmax and RGR indicates a strategy of slow but consistent growth in the forest understorey, whereas a large response of Q. crispula indicates a strategy of strong growth reliance on gap formation. The sub-canopy species, A. japonicum and F. lanuginosa, also showed contrasting responses. Acer japonicum showed a similar response to A. mono, whereas F. lanuginosa showed a large increase in Pmax and RGR in response to gap formation. These sub-canopy species do not reach the canopy level (Hara 1985, Ishida and Hiura 1998, Nabeshima and Hiura 2008), thus do not require the gap space for expanding their branches in the canopy level. However, if gap formation occurs, some species may acclimate photosynthetic capacity to utilize the increased irradiance for carbon gain, but some species may not. These results indicate that the gap dependency and gap response capacity vary among species, even within the same life form, particularly in cool-temperate deciduous forests.
The effect of the typhoon during the autumn of 2004
After the impact of the typhoon during autumn 2004, the photosynthetic capacity, LMA and Narea of seedlings at control plots increased to the same level as the gap plots (Figures 2–4). Although the typhoon did not cause the falling of canopy trees at the studied site, it caused disturbances such as branch and leaf falling, which resulted in an increase in irradiance at control plots and the acclimation of seedlings to the increase in light availability (see Figure S2 available as Supplementary Data at Tree Physiology Online). This would be a good example to illustrate that the formation of small gaps significantly affects the growth of understorey seedlings, even without the falling of a canopy tree. It was also observed that the falling of branches and leaves hit and covered the understorey seedlings. Therefore, this physical damage may have affected the 8-year seedling mortality (observed in 2009), although it did not result in a drastic increase in the mortality soon after the typhoon (2005) especially in the control plots (Figure 1). Recent meta-analyses indicated that morphological leaf traits such as LMA correlate with the toughness of leaves and woods (Wright et al. 2010, Onoda et al. 2011). These morphological leaf traits may also be important for survivorship in the understorey, particularly against the physical damage caused by typhoons, although the correlation between LMA and survivorship in the understorey was not strong in the present study (Table 3).
A trade-off between the photosynthetic plasticity and the understorey survivorship
As we suggested in the hypothesis, both the extent of the increase in Pmax and RGR in response to the gap formation showed a significant correlation with the 8-year mortality of seedlings at the control understorey (Figure 8). This result suggests a trade-off relationship between the long-term survivorship of understorey seedlings and their photosynthetic plasticity in response to gap formation among the species coexisting in a temperate deciduous forest, which is supported by the previous reports in which a correlation between mortality under a shaded condition and the percentage increase in the growth rate from shaded to exposed conditions was observed among saplings of multiple woody species (Grubb et al. 1996, Aiba and Kohyama 1997). The existence of the trade-off suggests the existence of some costs involved in the photosynthetic plasticity, which can increase the mortality of seedlings in the understorey. Because of this cost, some species may not possess a high photosynthetic plasticity, and thus the photosynthetic plasticity varies among species, although the plasticity does improve the growth of seedlings if gap formation occurs. Based on the results of the present study, a discussion of the physiological mechanism underlying the high plasticity of the photosynthetic capacity resulting in the low survivorship at the understorey would present a challenge. Unlike the acclimation of leaves developed before the increase in irradiance (Oguchi et al. 2003, 2005), newly developed leaves after gap formation are able to control the construction cost of leaves after sensing the new environments. This means such construction cost for the high photosynthetic capacity is not required before gap formation; thus, it is not regarded as the cost of plasticity. Rather, costs of information acquisition or developmental instability (noise) may be involved in the photosynthetic plasticity (DeWitt et al. 1998). However, the current knowledge about the physiological and genetic mechanisms in the differentiation of sun and shade leaves depending on light intensity is still scarce, even in herbal model species (Yano and Terashima 2001, Lambers et al. 2008, Tan et al. 2008, Munekage et al. 2015). Progress in the elucidation of the differentiation mechanism by physiological and molecular biological approaches would be needed to understand the cost of photosynthetic plasticity more deeply. On the other hand, it can be also said that the correlation between the plasticity and mortality may result from the variation in strategies among species pertaining to growth and survival in the forest understorey. For example, previous studies indicated that allocation to carbon and nutrients storage is important for the survival of seedlings (Coley et al. 1985, Coley 1988, 1993) and that the survivorship in low-light conditions negatively correlates with the growth rates in high-light conditions (Kobe et al. 1995); therefore, the species with a strategy to store carbon and nutrients may not allocate carbon and nutrients for the acclimation of leaves even in the gap condition. This might have caused the correlation between the 8-year mortality in control condition and LMA and Narea of leaves grown in the gap condition (Table 3).
Phenotypic plasticity is considered to greatly contribute to species fitness (Schlichting and Pigliucci 1995) and to express the conceptual strategy employed by species, including gap dependency in the regeneration niche (Valladares et al. 2000). The trade-off relationship between Pmax or RGR plasticity and understorey survivorship, combined with the correlation between the RGR plasticity and Pmax plasticity, should support this suggestion. The plasticity of Pmax strongly indicated the gap dependency of the species. This is equivalent to the idea of trait-based approaches: a relatively measurable trait can indicate the conceptual strategy (Westoby and Wright 2006). At least in cool-temperate deciduous forests, by measuring Pmax plasticity, an estimate of the reliance of growth of a species on gap formation could be obtained, which usually requires a long-duration study of population dynamics of understorey and gap seedlings. Lusk and DelPozo (2002) found that mortality rates under low light (12 μmol m−2 s−1) had a strong positive correlation with photosynthetic capacity (P = 0.004) and the light compensation point (P = 0.005) of seedlings grown under high light (150 μmol m−2 s−1) among 12 angiosperm trees in a Chilean temperate rainforest. However, in the present study, the photosynthetic capacity under the gap condition did not show a significant correlation with the mortality in the understorey. The measurement of the photosynthetic capacity under both gap and shade conditions to evaluate the photosynthetic plasticity would be a more reliable method to estimate the gap dependency of species. The accuracy of the estimation of gap dependency would be improved when phenotypic plasticity of a larger number of measurable traits is compared among species (Valladares et al. 2000).
Conclusion
Among the understorey seedlings in the cool-temperate deciduous forest, the stimulation of RGR after gap formation was strongly correlated with change in photosynthetic capacity of newly expanded leaves. This indicates that interspecific differences in the photosynthetic response contributed to the variation in growth responses after gap formation. The enhancement of RGR and photosynthetic capacity correlated with mortality in the understorey, which suggests a trade-off between the gap response capacity and understorey shade tolerance. These results indicate that the variation in photosynthetic plasticity among species contributes to species coexistence in forests through tree regeneration.
Acknowledgments
We wish to thank the staff members at Tomakomai Experimental Forest for their technical support and the experimental set-up, T. Koike and T. Kohyama for generous offer of instruments and E. Nabeshima, S. Kitaoka, S. Kosuge, S. Takahashi and Y. Miyazaki for experimental supports, advice and discussion. We also thank the constructive comments from the editor and the referees.
Supplementary Data
Supplementary Data for this article are available at Tree Physiology Online.
Conflict of interest
None declared.
Funding
This work was financially supported in part by JSPS Research Fellowship for Young Scientists (16-03330 to R.O.).
References
Author notes
handling Editor Joào Pereira
