


Abstract
The study of mutational landscapes of viral proteins is fundamental for the understanding of the mechanisms of cross-resistance to drugs and the design of effective therapeutic strategies based on several drugs. Antiviral therapy with nucleos(t)ide analogues targeting the hepatitis B virus (HBV) polymerase protein (Pol) can inhibit disease progression by suppression of HBV replication and makes it an important case study. In HBV, treatment may fail due to the emergence of drug-resistant mutants. Primary and compensatory mutations have been associated with lamivudine resistance, whereas more complex mutational patterns are responsible for resistance to other HBV antiviral drugs. So far, all known drug-resistance mutations are located in one of the four Pol domains, called reverse transcriptase. We demonstrate that sequence covariation identifies drug-resistance mutations in viral sequences. A new algorithmic strategy, BIS2TreeAnalyzer, is designed to apply the coevolution analysis method BIS2, successfully used in the past on small sets of conserved sequences, to large sets of evolutionary related sequences. When applied to HBV, BIS2TreeAnalyzer highlights diversified viral solutions by discovering thirty-seven positions coevolving with residues known to be associated with drug resistance and located on the four Pol domains. These results suggest a sequential mechanism of emergence for some mutational patterns. They reveal complex combinations of positions involved in HBV drug resistance and contribute with new information to the landscape of HBV evolutionary solutions. The computational approach is general and can be applied to other viral sequences when compensatory mutations are presumed.
Importance
Primary and compensatory mutations involved in drug resistance are the biggest obstacle to controlling chronic hepatitis B infection. Until now, the co-occurrence of resistance mutations was reported in studies limited to particular genotypes, antiviral drugs, and geographical areas. The resulting statistical covariation analysis depends on small and study-specific datasets and has not been compared across studies. Another drawback of these studies is the discrepancies found between substitutions that are considered compensatory by different authors.
The present work allows, for the first time, to measure the level of coevolution between primary and compensatory mutations, under a precise and unified definition of compensatory mutation allowing to compare the coevolution between the four main hepatitis B virus genotypes and the four available nucleos(t)ide analogues drugs. Known compensatory mutations are identified by the method and, in addition, thirty-seven new positions coevolving with known drug-resistance mutations are reported.
1. Introduction
Structural and functional studies of proteins demonstrated that certain amino-acid positions are more important than others in affecting the function and the stability of a protein. Substitutions at important positions may occur if the change is compensated by another mutation elsewhere in the protein (González-Ortega et al. 2011; Oniangue-Ndza et al. 2011; Goldhill et al. 2018). Particularly, two types of substitutions have been associated with drug resistance in viruses: primary resistance mutations, which are directly responsible for drug resistance and result in reduced susceptibility to an antiviral agent, and secondary (compensatory) mutations, promoting or enhancing replication competence of resistance strains by restoring functional defects in viral polymerase activity (i.e. replication fitness) when associated with primary drug resistance (Lok et al. 2007). Here, we wish to investigate whether positions involved in drug resistance might be automatically identifiable as correlated. Indeed, computational approaches for the identification of combinations (pairs, triplets, …) of correlated substitutions might be very useful for the construction of mutational landscapes for viral proteins, for the understanding of the mechanisms of cross-resistance to drugs and for the design of effective therapeutic strategies based on several drugs.
As a case study, we considered drug resistance in the hepatitis B virus (HBV). HBV infection is a major cause of acute and chronic hepatitis. In the last two decades, a large number of studies showed that the speed of disease progression, the reliability of diagnostic methods and the success of antiviral therapies and immunisation are all influenced by the genetic variability of the virus. It was demonstrated that substitutions in specific regions of the HBV genome were responsible for clinical outcomes or evasion from diagnostic tool detection, making the monitoring of these substitutions a necessity in patients’ evaluation (Tong et al. 2013; Gao, Duan, and Coffin 2015; Mokaya et al. 2018).
We analyse HBV Polymerase (Pol) sequences and their experimentally validated drug-resistance mutations. The HBV polymerase protein is composed by four domains: the terminal protein (TP) which is important in initial DNA synthesis, the Spacer, the reverse transcriptase (RT) domain including DNA-polymerase function, and the RNaseH domain at the carboxy-terminus which is critical for removing RNA template. So far, all known substitutions associated with drug resistance are located in the RT domain (Locarnini 2008; Gish et al. 2012). Indeed, sequencing is usually done in this region (and not for the entire genome) because RT contains the active site and it has largely been assumed that only residues in the active site can evolve for drug resistance. Hence, it remains unclear whether substitutions in regions outside the RT domain could lead to viral resistance or not. Interactions between RT and the other polymerase domains are known and several studies highlighted the existence of multiple contacts between TP and RT/RNaseH (Wang et al. 1994; Lanford et al. 1999; Wang and Hu 2002; Hu and Boyer 2006; Boregowda, Adams, and Hu 2012). These observed interactions between Pol domains suggest that substitutions outside RT may affect its activity and may have an effect in drug-resistance mechanisms. Another important observation that supports searching for sites outside the RT domain, is the observed dependency of fitness effects of drug-resistance mutations from the genetic structure of the HBV genome, thereby highlighting the role of epistatic connectivity and coevolution among sites across the entire HBV genome in the development of drug resistance (Thai et al. 2012).
The RT domain represents a target for the currently available drugs, nucleoside/nucleotide analogues (NAs), to treat hepatitis B: lamivudine (LMV), telbivudine (LDT), adefovir (ADV), entecavir (ETV), and tenofovir (TDF). NAs structure is similar to the natural substrate and they can compete with the latter in binding Pol. The emergence of drug-resistant HBV populations is a major problem for antiviral treatments, resulting in virus reactivation and disease recurrence (Zoulim and Locarnini 2009; Ridruejo, Adrover, and Silva 2011). Different drugs display different resistance rates and the likelihood of the emergence of a drug resistance partly depends on the number and type of substitutions needed for the virus to replicate efficiently in the presence of antiviral agents (Ghany and Doo 2009).
Coevolution analysis identifies structural and/or functional interactions between amino-acid positions in a sequence (Carbone and Dib 2011; Hopf et al. 2014). A large panel of coevolution analysis methods compute coevolution in large sets of diverse homologous sequences (de Juan, Pazos, and Valencia 2013) and only few ones can detect coevolution on small sets of sequences, such as CAPS (Fares and McNally 2006) and BIS2 (Dib and Carbone 2012b; Champeimont et al. 2016; Oteri et al. 2017). All these methods require large amino acid variation with the exception of BIS2, which is specifically designed to identify clusters of coevolving positions in alignments with high conservation levels (such as viral genomes) and a relatively low number of sequences (less than fifty). BIS2 was successfully applied to the hepatitis C virus to reconstruct the protein-protein interaction network (Champeimont et al. 2016) and to identify a novel fusion mechanism (Douam et al. 2018). However, a computational strategy is needed to compute coevolution using BIS2 in large sets of viral protein sequences. The coevolution analysis of HBV sequences represents a computational challenge due to the large number of highly conserved sequences available for each HBV genotype.
In this study, we designed the new algorithmic strategy BIS2TreeAnalyzer to compute coevolution using BIS2 coevolution analysis method iteratively. BIS2TreeAnalyzer was applied to chosen subsets of four large datasets of Pol sequences belonging to the major HBV Genotypes A, B, C, and D. The computational approach is illustrated in Fig. 1 and highlights the choice of appropriate subsets of sequences for coevolution analysis. We consider the full set of Pol sequences in the reference database HBVdb (Hayer et al. 2013) after filtering out recombinant and incomplete sequences (i.e. truncated proteins), and we focus on the positions involved in antiviral resistance. We identify all positions coevolving with drug-resistance mutations, belonging to RT but also to other Pol domains. These positions are proposed as potential candidates to be tested for involvement in the drug-resistance mechanism. The identified sets of coevolving positions are coupled to the analysis of the multidrug-resistance position rt204, involved in LMV, LDT, and ETV resistance. Clusters of coevolving positions specifically related to ADV and ETV resistance are also identified. A structural analysis of known and predicted drug-resistance mutations in RT domain is realised.
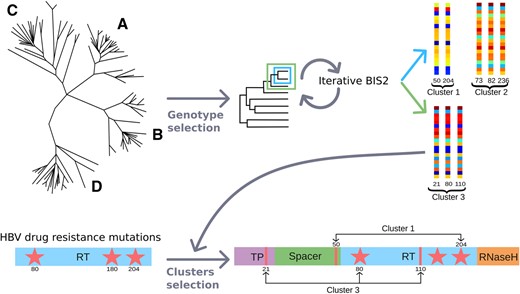
Computational prediction of positions that coevolve with known drug-resistance mutations. Schema of the computational approach BIS2TreeAnalyzer designed to predict positions coevolving with known drug-resistance mutations: 1 HBV polymerase protein sequences coming from Genotypes A, B, C, and D are analysed separately. 2 For each genotype, a distance tree of sequences is constructed and each subtree is analysed (e.g. subtrees enclosed in the blue and green boxes are both analysed) using the BIS2 coevolution analysis method. Coevolving clusters are obtained for each set of sequences associated with a subtree. The toy example shows two clusters, 1 and 2 (blue arrow), obtained with the analysis of the subtree in the blue box, and a cluster, 3 (green arrow), obtained with the analysis of the subtree in the green box. Cluster 1 is composed by two positions (50 and 204) displaying identical patterns of colours, corresponding to the strongest coevolution signal and the maximum BIS2 coevolution score (see legend in Fig. 2). The coevolution analysis procedure ends when all subtrees are considered. 3 Known positions responsible for drug resistance (80, 180, and 204) are represented by red stars in the RT domain (bottom left) and they are used to select BIS2 clusters containing at least one of them: Clusters 1 and 3, containing positions 204 and 80, respectively are selected, and Cluster 2 is discarded. Selected clusters are further analysed and used to identify yet unknown positions, along the full Pol sequence, covarying together with substitutions known to be responsible for drug resistance.
2. Methods
2.1 The algorithmic strategy BIS2TreeAnalyzer explores large distance trees of sequences
To answer the challenge of searching for clusters of coevolving positions of residues in a multiple sequence alignment (MSA) of highly conserved viral sequences, we propose the new algorithmic strategy BIS2TreeAnalyzer. BIS2TreeAnalyzer detects clusters of coevolving positions over large distance trees, by analysing closely related subtrees of sequences using BIS2 (Carbone and Dib 2011; Oteri et al. 2017), and combining the subtree results in a principled manner. The challenge is illustrated in Fig. 2A for the set of HBV Genotype A sequences of the polymerase RT domain. These sequences display a particularly high sequence identity, with 84 per cent of positions having ≥99 per cent of conservation (Table 1). In Fig. 2A (left), a model of the HBV RT domain structure highlights the relatively small number of variable positions (211 positions display <100 per cent conservation and fifty-six positions <99 per cent, out of a total of 345 positions in the RT domain) in Genotype A sequence alignment. These few variable positions are the only ones where correlated substitutions may be detected, even though their variability is low. Moreover, the search space of coevolving pairs to be explored is small compared to the full space of all pairs (22,155 pairs over a total of 59,340; Fig. 2A right). Hence, the coevolution analysis of several genotypes, considered separately, allows to explore the mutational space as much as possible, to compare genotype-specific coevolution signals, and to investigate the evolutionary pathways within those sequences that realised the mutational solutions. Taken together, the analyses over different genotypes help to reconstruct the mutational landscape explored by the virus and to build a more complete vision of its evolutionary process.
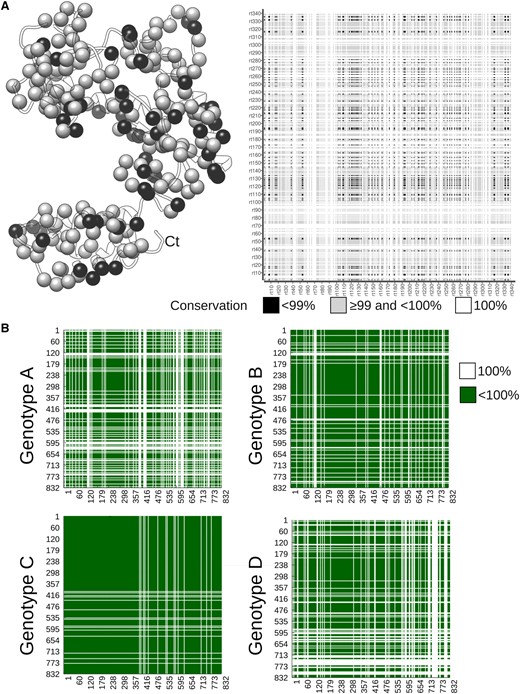
Search space and structural mapping of coevolving positions in the RT domain of HBV Polymerase. (A, left) Structural model of the RT domain, where spheres (corresponding to Cα atoms) highlight positions with variable residue conservation in the sequence alignment representative of Genotype A. The white ribbon represents 100 per cent conserved residues. (A, right) Matrix representing the search space (coloured grey and black) for Genotype A in the RT domain. Coloured regions correspond to those pairs of positions that are tested to be coevolving or not by BIS2. Note that black regions correspond to pairs of positions with <99 per cent conservation. (B) Matrices illustrating the space of HBV polymerase positions (in green) where to search for coevolving ones. All pairs of positions that are not fully conserved are coloured green. Fully conserved positions are shown in white. The plots correspond to the four Genotypes A, B, C, and D.
Conservation of the Pol sequences for Genotypes A, B, C, and D.
| Conservation | TP | Spacer | RT | RNaseH |
|---|---|---|---|---|
| Genotype A | ||||
| <99% | 16.9 | 44.9 | 16 | 8.5 |
| ≥99 and <100% | 55.4 | 47.5 | 45.2 | 56.6 |
| 100% | 27.7 | 7.6 | 38.8 | 34.9 |
| Genotype B | ||||
| <99% | 22.6 | 60.8 | 18.8 | 11.2 |
| ≥99 and <100% | 60.5 | 36.7 | 60.6 | 72.4 |
| 100% | 16.9 | 2.5 | 20.6 | 16.4 |
| Genotype C | ||||
| <99% | 22 | 62.7 | 18.9 | 14.5 |
| ≥99 and <100% | 71.8 | 34.8 | 67.5 | 78.9 |
| 100% | 6.2 | 2.5 | 13.6 | 6.6 |
| Genotype D | ||||
| <99% | 24.3 | 56.3 | 22.3 | 17.2 |
| ≥99 and <100% | 56.5 | 38 | 54.8 | 41.4 |
| 100% | 19.2 | 5.7 | 22.9 | 41.4 |
The pipeline is schematised in Fig. 3. In the first step, the phylogenetic tree T is predicted from aligned sequences using BioNJ. In the second step, BIS2 is iteratively applied to the sequences associated with each subtree of the tree T (all subtrees of sequences with a minimal number of twenty sequences are analysed). BIS2 computes a coevolution score between pairs of positions and constructs a coevolution score matrix. Then, groups of positions displaying the same coevolution scores with all other positions in the alignment are identified using the clustering algorithm CLAG (Dib and Carbone 2012a). Only clusters comprised of positions characterised by an identical distribution of coevolution scores with all other positions in the alignment are retained (this corresponds to ask for a ‘perfect’ coevolution signal among positions; see the regularity of colour distributions in panel four of Fig. 3). The above procedure is repeated iteratively on all the subtrees of the phylogenetic tree (with a minimal number of twenty sequences). P-values are calculated using a binomial test (see ‘P-value score’). Then, statistically significant clusters are selected (P-value ≤ 0.005), after applying the Bonferroni correction for multiple testing (Bonferroni 1936) (see ‘P-value score’). Appropriate criteria are applied to remove the redundancy of the clusters generated by the iterative approach: 1 if there are two identical clusters (composed by the same positions) and their trees are non-disjoint (i.e. one is a subtree of the other), only the cluster with the best P-value is retained (Fig. 3, Step 6A); 2 if the clusters are identical but their trees are disjoint, both clusters are retained (Fig. 3, Step 6B); and 3 if all elements of a cluster are contained in another cluster and their trees are non-disjoint, only the cluster with the highest number of elements is retained (Fig. 3, step 6C). As a consequence, the procedure returns identical clusters only if they are found on disjoint subtrees, providing independent evidence of covariation among the same groups of positions.
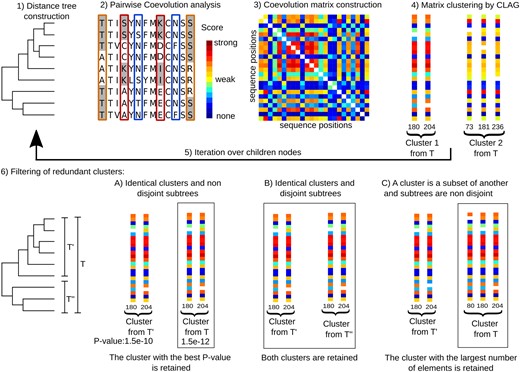
The BIS2TreeAnalyzer pipeline applied to large sets of conserved sequences. BIS2TreeAnalyzer pipeline is organised in several consecutive steps: 1 a distance tree and an MSA are constructed from a set of sequences. 2 BIS2 detects pairs of correlated positions in the alignment and associates a coevolution score to the pair represented by a colour scale (going from blue/weak correlations to dark red/strong correlations). The toy example shows three pairs of columns having strong (red), medium (orange), and very weak (blue) correlations. In these columns, conserved blocks of residues are alternatively highlighted in grey and white backgrounds for an easy reading of the amino-acid changes in the columns. 3 A symmetric coevolution score matrix is constructed. It is a square matrix nxn, where n is the size of the sequence alignment. Colours in the matrix correspond to coevolution scores described in Step 2. The white diagonal corresponds to missing score values because associated with positions against themselves. 4 Clustering identifies groups of positions in the sequence alignment whose columns in the coevolution matrix display the same distribution of coevolution scores (colour patterns) with all other positions of the sequence alignment. The example illustrates two clusters, one composed by two positions and the other by Step 3. Both clusters display positions characterised by the same distribution of scores. 5 Taken the two children subtrees of the current distance tree, we repeat Steps 2–4 on the sets of sequences corresponding to each subtree. The iteration ends when all possible subtrees of the starting distance tree are analysed. 6 A reduction of redundant clusters generated by the iteration is applied; three possible scenarios might take place: (A) if two clusters are identical and their associated trees are not disjoint, only the cluster with best P-value is retained (box). (B) If two clusters are identical and their associated trees are disjoint, both clusters are retained. In this case, the iterative process allowed to find two subtrees supporting the same coevolved positions. (C) If two clusters are contained one in another and their associated trees are not disjoint, only the cluster with the largest number of elements is retained. The top of the figure has been adapted from Fig. 2 in Douam et al. (2018).
After applying BIS2 to all subsets of HBV Pol sequences whose selection is guided by the topology of their associated distance tree, we selected those BIS2 clusters containing at least one position known to be related to drug resistance, in order to study the positions, along the full Pol sequence, that covary with it (see Fig. 1).
2.2 Comparison of BIS2TreeAnalyzer, GREMLIN, and Hopfield-Potts_DCA with principal component analysis on simulated alignments
The predictive performance of BIS2TreeAnalyzer was evaluated and compared with the one obtained by GREMLIN (Kamisetty, Ovchinnikov, and Baker 2013) and Hopfield-Potts_DCA with Principal Component Analysis (hpPCA, in short) (Cocco, Monasson, and Weigt 2013). Even though the purpose of BIS2TreeAnalyzer is to identify combinations of coevolving positions, the comparison was realised on pairs of positions to match the output of these two coevolution analysis methods (see ‘Evaluation of BIS2TreeAnalyzer and comparison with other coevolution analysis tools’). The three methods were tested on three families of sets of artificial sequences (see ‘Generation of artificial data to test BIS2TreeAnalyzer performance’) covering a very high, high and medium sequence identity (96 per cent, 88 per cent, and 74 per cent, respectively). For those, 360 MSAs have been generated for datasets of sequences characterised by a different size (250, 500, 750, 1,000 sequences) and different alignment lengths (152, 159, and 850 amino acids, respectively). All the three methods present very high specificity and very low sensitivity (not shown). The comparative analysis of their positive predictive value (PPV) is reported in Supplementary Fig. S4 and Table S1. For alignments of medium length (∼150 residues), a common trend is found for all methods: PPV increases with the number of sequences in the MSA and decreases with the percentage of identity (see the first two panels in Supplementary Fig. S4). In the simulated alignments based on medium sequence identity, the three methods show a very high PPV, and differences across methods are not statistically significant (P-value > 0.05; first panel in Supplementary Fig. S4). On simulated alignments of high sequence identity, the differences between GREMLIN and BIS2TreeAnalizer are not statistically significant (P-value > 0.05), whereas a statistically significant difference is shown for both GREMLIN and BIS2TreeAnalyzer with hpPCA for the alignments of 250, 750, and 1,000 sequences (second panel in Supplementary Fig. S4). On the datasets with very high sequence identity (third panel of Supplementary Fig. S4), BIS2TreeAnalyzer outperforms GREMLIN and hpPCA in the alignment of 1,000 sequences. GREMLIN outperforms the other methods in the alignment of 500 sequences. The differences between BIS2TreeAnalyzer and GREMLIN are not statistically significant on 250 and 750 sequences. The PPV of hpPCA is very low for very high sequence identity and this may be explained by the ‘L ratio’ requirement, defined as the ratio between the number of sequences (L) and the number of positions in the MSA: DCA based methods have been tested primarily with an MSA ratio between 5 and 25 l. Very often investigators are interested in studying covarying positions of proteins for which the available MSA contains less than L sequences and BIS2TreeAnalyzer demonstrated to be able to handle relatively small datasets of relatively long and highly conserved sequences and to achieve a stable PPV across different numbers of sequences for very highly conserved alignments.
2.3 Datasets
HBV genotypes show different geographical distribution, disease progression, and response to antiviral treatment (Kramvis and Kew 2005; Sunbul 2014). Each HBV genotype is characterised by a very large number of protein sequences presenting high conservation. All Pol sequences for Genotypes A, B, C, and D were retrieved from HBVdb (Hayer et al. 2013). We filtered recombinant and incomplete sequences (i.e. truncated proteins) away and obtained 972, 1,809, 2,006 and 955 sequences for Genotypes A, B, C, and D, respectively. The average identity in the datasets is ∼96 per cent (see Fig. 1 and Table 1). A MSA was built for each dataset using Clustal Omega (Sievers and Higgins 2018). The four alignments were used as input for BIS2TreeAnalyzer. Sequence alignments of HBV Genotypes A, B, C, and D comprise 590, 705, 760, and 647 positions presenting variations over the 832 positions of the entire HBV Pol sequence.
2.4 P-value score
BIS2TreeAnalyzer clusters describe two or more patterns. For example, when the method is applied to the MSA of Genotype A, it detects a cluster in a subtree of 137 sequences displaying the mutational pattern rtL180 + rtM204 in ninety-two sequences and the pattern rtM180 + rtV204 in forty-five (first cluster in Fig. 5). Typically, in a cluster, one of the patterns corresponds to wild-type amino acids. For each subtree considered by BIS2TreeAnalyzer and for each pattern occurring in a cluster identified for the subtree, a Binomial test was computed to evaluate if the frequency of the observed pattern deviates significantly from that expected by chance following a binomial distribution, where n is the total number of sequences in the subtree, k is the number of sequences with the mutational pattern, and p is the expected probability of observing that pattern by chance if the positions were independent. Given a pattern of amino acid a1 on Position 1 and a2 on Position 2, the expected probability was calculated by multiplying the probabilities for observing a1 on Position 1 by the probability of observing a2 on Position 2 considering all the sequences in the genotype sequence alignment. For instance, for the pattern rtL180 + rtM204 in the first cluster of Genotype A, the expected probability was calculated as the probability of observing L at position 180 multiplied by the probability of observing M at position 204 considering all the sequences in the Genotype A alignment. Note that positions involved in a pattern might be more than two and that the expected probability reflects this complexity.
As multiple comparisons were performed, P-values were adjusted using the Bonferroni correction, for which the P-values are multiplied by the number of performed tests. This correction allows us to use the same cut-off for the four genotypes. If at least one pattern of the cluster showed a corrected P-value < 0.005, the cluster was retained. The P-value cut-off guarantees that the family-wise error rate (i.e. the probability of making at least one Type I error) is less or equal to 0.005.
Note that our definition of P-value explicitly considers the independence between the positions under the null hypothesis by taking into account the distribution of amino acids in the full alignment for all positions involved in a pattern.
2.5 BIS2TreeAnalyzer clusters and mutational patterns in viral sequences
All BIS2 clusters were detected in a minimal alignment of twenty sequences. However, the minimal number of mutated sequences required in order to detect a mutational pattern is two. To avoid the possibility that a reported mutational pattern corresponds to viral sequences of the same patient, therefore belonging to the viral genetic background of the patient, some precautions were taken for clusters with mutational patterns supported by less than five sequences: BIS2TreeAnalyzer clusters were discarded if the mutational pattern was supported by sequences from the same patient or with consecutive accession numbers (since patient information is not always available). Patient information was searched in the original publication.
2.6 Sequence position numbering
The positions of the RT domain are indicated according to a standardised nomenclature system (Stuyver et al. 2001) which is genotype-independent. In this system, the Met of the conserved motif YMDD in the RT polymerase is numbered as rtM204, and the positions of RT are indicated with preposition ‘rt’. The remaining positions of the polymerase are numbered according to the sequence of UniProt accession number P03156.
2.7 Cluster selection related to drug resistance
The first step in cluster selection filters out clusters with a P-value above a given P-value cut-off (P-value = 0.005). In a second step, we selected clusters of coevolving positions that include at least one known position related to drug resistance. We searched in the literature for HBV polymerase substitutions known to be responsible for NAs resistance found in patients and whose effect was experimentally corroborated. Reported substitutions might be found in a single genotype, while their effect on other genotypes remains unknown. It is possible that a given amino acid in a position emerges as a result of a substitution in one genotype, whereas it is the consensus residue in another genotype. To know whether a reported substitution is genotype-specific, we computed, for each genotype, the occurrence of wild-type and mutated amino acids in known drug-resistance positions. When the occurrence for the mutated amino acid is higher than for the wild-type amino acid that substitution was not considered. For example, the mutation rtH55R has been reported as a compensatory mutation related to LMV resistance (Xiang et al. 2018). However, Arg is present in more than 99 per cent of sequences in Genotypes A, B and D. Therefore, mutation rtH55R was considered only for Genotype C.
At first, we selected all BIS2TreeAnalyzer clusters comprising position rt204, regardless of the identity of the amino acid in that position. As variations in position rt204 are related to multidrug resistance, the selected clusters have been analysed by considering resistance mutations reported for the five nucleos(t)ide analogues and the known compensatory mutations for LMV resistance (Table 2). Note that LDT resistance mutations also confer LMV resistance, hence, the outcomes of their analysis are included in Table 2.
Mutations are responsible for drug resistance.
| NA | Primary | Compensatory | Geno:Cl | References |
|---|---|---|---|---|
| LMV | rtM204V/I | rtH55R | – | Xiang et al. (2018) |
| rtL80I/Va | B:9(I) | Ogata et al. (1999) | ||
| D:5(I) | ||||
| rtV173L | — | Ahn et al. (2015); Locarnini and Yuen (2010) | ||
| rtL180Ma | A:1,2,5 | Ono et al. (2001) | ||
| C:14,29 | ||||
| D:2,5 | ||||
| rtV207I/L/M | B:90(L) | Ono et al. (2001); Locarnini and Yuen (2010); Fan et al. (2015) | ||
| rtL229G/V/W | D:2(F) | Ji et al. (2012) | ||
| rtL269I | Ahn et al. (2015) | |||
| ADV | rtA181T/V | C:25(V) | Guo et al. (2018) | |
| rtI233V | B:69 | Ghany and Liang (2007) | ||
| rtN236T/V | – | Guo et al. (2018); Ghany and Liang (2007) | ||
| Required | At least one required | |||
| ETV | rtL180M + rtM204Vb | rtI163V | C:12 | Hayashi et al. (2015) |
| rtT184G/S/Lb | C:20(L) | Mukaide et al. (2010); Cho et al. (2010); Tenney et al. (2007) | ||
| rtA186T | – | Hayashi et al. (2015) | ||
| rtS202I/Gb | C58(G) | Mukaide et al. (2010); Tenney et al. (2007); Locarnini and Yuen (2010) | ||
| rtL180M + rtM204V/Ib | rtI169Tb | – | Locarnini and Yuen (2010) | |
| rtV173Lb | – | Delaney et al. (2003) | ||
| rtS219A | A:5 | Karatayli et al. (2012) | ||
| rtY245H | – | Karatayli et al. (2012) | ||
| rtM250Vb | – | Tenney et al. (2007) |
Mutations considered when analysing clusters. When more than one amino-acid substitution was reported for a position, the identity of the amino-acid found in BIS2TreeAnalyzer cluster is indicated in parenthesis. The most frequent resistant variants included in the Clinical Practice Guidelines on the management of hepatitis B virus infection 2017 (European Association for the Study of the Liver. Electronic address: easloffice@easloffice.eu and European Association for the Study of the Liver 2017) are highlighted in bold.
Mutation also confers cross-resistance to LDT.
Mutations also confer cross-resistance to LMV and LDT.
To analyse coevolution in positions responsible for ADV resistance, we extracted clusters with at least one of the following positions: rt181, rt233, and rt236. ADV has antiviral activity against both wild-type and LMV resistant HBV (Chen et al. 2009; Jiang and Yan 2010). The primary mutations responsible for ADV resistance are rtA181V/T found together or in absence of rtN236T (rtA181V/T ± rtN236T) (Bartholomeusz and Locarnini 2006; Osiowy et al. 2006; Ghany and Liang 2007; Guo et al. 2018). The double mutant rtA181V/T + rtN236T is also resistant to LMV and LDT, and it reduces the susceptibility to TDF (Villet et al. 2008; Liu, Miller, and Kitrinos 2014). The rare mutation rtI233V emerging in ADV-treated patients was also reported. The effect of this substitution is controversial and it is not clear if it is a primary or a compensatory substitution (Schildgen et al. 2006; Ismail et al. 2013; Liu et al. 2016). Substitutions responsible for ADV resistance are summarised in Table 2.
The analysis of coevolution related to ETV resistance was carried out for Genotype C, presenting the highest number of BIS2TreeAnalyzer clusters. Positions considered for selecting clusters related to ETV resistance are: rt163, rt169, rt173, rt180, rt184, rt186, rt202, rt204, rt219, rt245, and rt250. Mutational patterns responsible for ETV resistance are summarised in Table 2.
2.8 Reconstruction of ancestral states
To investigate whether pairs of coevolving positions identified by BIS2TreeAnalyzer may be explained by shared ancestry, we performed a reconstruction of ancestral states for all phylogenetic trees associated with the datasets of sequences of HBV genotypes. Given an HBV genotype set of sequences, the distance tree generated by BIS2TreeAnalyzer was used as input to the Sankoff parsimony algorithm (Sankoff 1975; Sankoff and Rousseau 1975) to determine the minimum number of changes required in the given phylogeny to explain the sequences. We used the Wang and Wang matrix (Wang and Wang 1999) to compute the cost associated with transitions between states. Then, we analysed the internal nodes of the subtrees where coevolution clusters were detected. The reconstruction of the ancestral node of a subtree allowed us to estimate the number of substitutions and the localisation of the substitutions on the subtree which gave rise to the pattern of coevolved positions. We considered that a pair of covarying positions may be explained by phylogeny if the pattern of amino acids detected by BIS2TreeAnalyzer can be generated by independent substitutions in different branches of the subtree (see Supplementary Fig. S3A). We interpreted a pattern to be coevolving when the covariation can be explained by parallel substitutions occurring in one branch of the subtree (see Supplementary Fig. S3B). This condition, however, does not exclude the possibility of founder effects (Bhattacharya et al. 2007). We considered as strong evidence of coevolution, a mutational event that gives rise to the detected pattern more than once in the subtree (Supplementary Fig. S3C).
2.9 Structural analysis of drug-resistance mutation RT domain
There is no resolved structure of HBV polymerase. However, several models of the HBV RT domain have been published based on different modelling approaches (Das et al. 2001; Langley et al. 2007; van Hemert, Berkhout, and Zaaijer 2014). We selected a model of RT specifically generated to study drug–protein interaction and drug-resistance mutations. The RT structural model was requested to the authors (Xu et al. 2016).
2.10 ETV resistance analysis
Due to the complexity of the mutational pattern to be analysed, we only considered its appearance in Genotype C, presenting the highest number of variable positions (Fig. 2B), the highest number of clusters associated with ETV resistance and the highest number of substitutions in positions associated with ETV resistance. All ETV resistance positions found in Genotypes A, B and D are included in those of Genotype C, with one exception (rt169) found only in Genotype B.
2.11 Generation of artificial data to test BIS2TreeAnalyzer performance
Simulated alignments were generated using the MSAvolve tool (Clark et al. 2014) downloaded from http://veloce.med.wayne.edu/∼gatti/coevolution/msavolve—simulation-and.html (accessed 2 October 2019). Three MSAs of natural protein sequences were used as input to generate a set of artificial alignments that mimic the statistical properties (e.g. sequence conservation profile, pairwise similarity distribution, conservation at each position) of the real MSA. We used sequences from Pfam protein families PF08082 and PF10596 (FULL datasets), and HBV Genotype A sequences, characterised by 74 per cent, 88 per cent, and 96 per cent sequence identity and by an alignment length of 152, 159, and 850 amino acids, respectively. Importantly, the number and size of the main branches of the phylogenetic tree built from the real alignment are preserved by the simulation. Each simulated MSA is derived from a different ancestor, randomly assigned from the emission probabilities at each position of the HMM model of the real MSA. For each of the three real alignments, we simulated thirty MSAs of approximately 250, 500, 750, and 1,000 sequences, for a total of 360 simulated alignments. The final number of sequences in the simulated alignments can be slightly different from the number requested, due to the necessity to maintain the same ratio between branches and tree topology during the simulation. The statistical properties of the simulated and real alignments, as well as examples of the phylogenetic trees, are shown in Supplementary Figs S1 and S2.
In MSAvolve, correlated substitutions may occur by random mutations (stochastic noise), recombination or functional/structural demands (positions forced to coevolve), and, in our simulations, the 15 per cent of positions in the sequence were selected randomly as covarying pairs. MSAvolve adopts a fixed three-level architecture with each level containing alternating steps of point mutations and steps of recombination to generate the final MSA. MSAvolve computes a matrix, named ‘totcovCOV’, describing the total coevolution signal from which all effects of stochastic coevolution have been removed. We transformed this matrix into a binary matrix (namely all scores ≥ 1 in totcovCOV become 1, 0 otherwise), where ‘1’ indicates a true covarying pair and ‘0’ a non-covarying pair. For each one of the 360 simulated alignments, the associated binary matrix describes the ground truth that we used for PPV evaluation.
2.12 Evaluation of BIS2TreeAnalyzer and comparison with other coevolution analysis tools
BIS2TreeAnalyzer was tested on 360 simulated alignments where the coevolution signal between pairs of positions is known by construction (see ‘Generation of artificial data to test BIS2TreeAnalyzer performance’). The main challenge to evaluate BIS2TreeAnalyzer is that its predictions are clusters of positions (possibly with a different P-value) and not necessarily pairs of positions as for MSAvolve or other coevolution methods. To overcome this difference, we decomposed statistically significant clusters identified by BIS2TreeAnalyzer into pairs of coevolving positions and built an LxL binary matrix, with L being the protein’s length, where ‘1’ is assigned if the pair of positions belongs to at least a cluster with significant P-value and ‘0’ otherwise. For example, given a cluster of positions [2, 7, 50] with significant P-value, a ‘1’ will be assigned at pairs [2, 7, 50] and [7, 50] in the matrix.
The two coevolution analysis methods GREMLIN (Kamisetty, Ovchinnikov, and Baker 2013) and Hopfield-Potts_DCA with Principal Component Analysis (Cocco, Monasson, and Weigt 2013) (called here hpPCA) were compared to BIS2TreeAnalyzer and were run from the MSAvolve toolbox. Both methods apply the ‘average product correction’ that was originally introduced in (Gloor et al. 2005) as a correction for phylogenetic bias, and both assign a score to each pair of positions in the alignments. To compare the result with BIS2TreeAnalyzer, for each MSA, the top N predictions were considered as positives, where N is the number of pairs predicted by BIS2TreeAnalyzer in that alignment. Finally, the binary matrix of covariant positions from MSAvolve and the binary matrix of the coevolution method were compared to calculate the precision (PPV) of the predicted covarying pairs.
The distribution of PPV values obtained by the different methods on sets of thirty alignments, associated with sets of sequences of variable number, variable sequence identity and variable alignment length, have been compared using Mann–Whitney U test (with a statistically significant P-value < 0.05). The median and median absolute deviation of PPV were computed (Supplementary Table S1 and Fig. S4).
2.13 Software availability
BIS2TreeAnalyzer, BIS2 and the input files used in our coevolution analysis of Pol for the HBV Genotypes A, B, C, and D are accessible online at www.lcqb.upmc.fr/BIS2TreeAnalyzer/.
3. Results
The power of the computational approach BIS2TreeAnalyzer to coevolution analysis of large sets of conserved sequences is demonstrated by identifying known combinations of antiviral drug-resistance patterns in HBV Pol sequences, for which a large number of genotype sequences is available. Patterns are combinations of specific amino-acids observed to occur together in specific positions of HBV sequences (see ‘P-value score’ in Methods for examples). We are interested in patterns involving positions that correspond to known resistance mutations and argue that these ‘resistance patterns’ might be more complex than previously described because of (not previously identified) potential compensatory substitutions that coevolve with primary mutations exactly as known ones. We also highlight positions that were not known before to be correlated with known mutations and that lie outside the RT domain.
3.1 Detecting coevolution in large sets of highly conserved sequences
HBV genotypes might contribute differently to drug-resistant mutant evolution and selection, as previously argued in (Liu et al. 2010). This hypothesis adds a second reason to conduct coevolution analysis in four HBV genotypes separately. The first reason, as discussed above, is due to the low variability of viral sequences and the fact that coevolution signals can be detected between positions displaying some degree of variation in MSAs. For Pol, this means that among 832 positions corresponding to its sequence length, about 600 positions (see Section 2 for the length of alignments associated with different genotypes) defined the search space of correlated substitutions (see Fig. 2B for the genotype-dependent representation of the search space). We looked for patterns of coevolution within an ensemble of roughly 180,000 pairs of positions. The search was conducted in each full set of genotype sequences and in all subsets of sequences associated with the subtrees of the distance tree computed on the MSA. Over the full set of genotype sequences, coevolving positions appearing multiple times and independently in the tree reflect ‘shared’ constraints for the protein within the genotype. Over the subsets of the full set of genotype sequences, coevolution reflects ‘specific’ constraints, possibly involving specific evolutionary viral solutions within a genotype. BIS2 analysis identified 34, 87, 121, and 44 significant clusters of positions (with a P-value ≤ 0.005) for Genotypes A, B, C, and D, respectively. Note that the number of clusters correlates with the size of the search space in each genotype (Fig. 2b and Table 1).
We analysed the occurrence of each coevolving position by considering all significant clusters, for the four genotypes. Their distribution is shown in Fig. 4. All positions known to play a primary or a secondary role in drug resistance (listed in Table 2), coevolve in some BIS2 cluster with the exception of position rt186. This position is highly conserved in all genotypes (more than 99 per cent of the sequences display the Ala residue (data not shown) and we do not identify it as coevolving with other Pol positions). The Spacer domain displays the highest density of positions over the full Pol protein, whereas the interdomain region A–B displays the highest density within the RT domain (see Fig. 4). The high coevolution signal may be due to the lower conservation level in these regions. We identify twelve positions occurring more than eight times in some BIS2 clusters, all of them belonging to the RT domain. The effect of substitutions in ten of these twelve positions has been reported to be associated with NA resistance (rt180, rt204, and rt229) (Allen et al. 1998; Ono et al. 2001; Ji et al. 2012), putative NA resistance (i.e. not verified experimentally; rt126, rt139) (Ciancio et al. 2004; Colonno et al. 2006; Liu et al. 2010), occult hepatitis B infection (rt122, rt131, rt263, and rt333) (Howard and Allison 1995; Mondal et al. 2017; Anderson et al. 2018), and to facilitate the progression of liver disease (rt106) (Zheng et al. 2012).
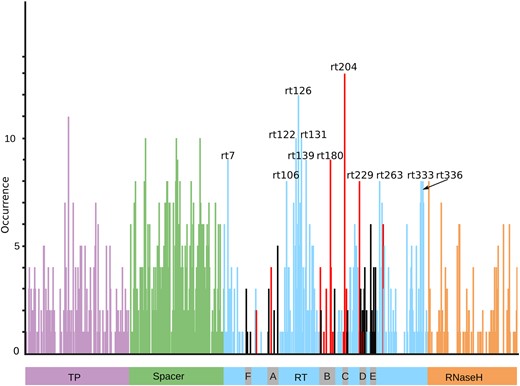
Distribution of occurrences of positions appearing in BIS2TreeAnalyzer clusters and localised along the HBV Polymerase sequence, all genotypes confounded. All BIS2TreeAnalyzer clusters with P-value ≤ 0.005 are considered, with no pre-selection of clusters containing positions involved in drug resistance. The four Pol domains are shown: Terminal Protein (TP, violet), Spacer (green), Reverse Transcriptase (RT, blue), and RNaseH (orange). The grey boxes indicate functional conserved motifs of the RT domain (A, B, C, D, and E). Positions are coloured depending on domain localisation. Positions in RT domain are coloured as follows: red for positions known as being involved in drug resistance, grey for unknown positions localised in motif regions, blue for all others. Positions with an occurrence greater than or equal to eight are labelled.
3.2 Coevolution of the multidrug-resistance position rt204
The position showing to correlate the most in Pol (Fig. 4) is rt204, the well-known multidrug-resistance position. rtM204V/I is a primary mutation for LMV and appears coupled with secondary mutations (see Table 2). Four positions out of the seven known to correlate with rt204 are identified in BIS2 clusters, and some other positions are highlighted by BIS2TreeAnalyzer to be potentially involved in drug resistance.
BIS2TreeAnalyzer identified nine clusters involving rt204, all genotypes combined. All of them contain mutation rtM204V/I and at least one known compensatory LMV resistance mutation. Clusters information is reported in Fig. 5, where rt204 appears to covary with positions belonging to the four Pol domains. The nine clusters were analysed considering all known substitutions responsible for resistance to the four drugs (LMV, ADV, ETV, and LDT).
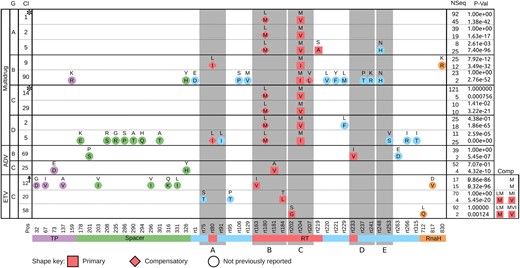
BIS2TreeAnalyzer clusters containing positions related to drug resistance. BIS2TreeAnalyzer analysis of HBV Pol for four HBV genotypes. Each row describes a BIS2TreeAnalyzer cluster and each column corresponds to a position (Pos) in the HBV Pol sequence, vertical boxes (grey) indicate the functional conserved motifs of the RT domain (A, B, C, D, and E). For each cluster, the drug resistance drug, genotype (G), cluster’s number (Cl), number of sequences showing the mutational pattern (Nseq), and P-value (P-val) are reported. Known primary and compensatory variations are coloured red. The others are coloured according to the Pol domain to which they belong. For example, Cluster 1 of Genotype A was detected in 137 sequences, ninety-two of which show the known mutational pattern rtL180 + rtM204 and forty-five rtM180 + rtV204. Mutations rtL180M and rtM204V are coloured red because are known compensatory (rhomboid) and primary (square) mutations responsible for LMV resistance. For each genotype, clusters are ordered by decreasing P-value; Cl is not consecutive, since only clusters involving position related to drug resistance are shown. Clusters may have identical positions (for instance, Clusters 1 and 2 for Genotype A), and this indicates that the same pattern was found in two disjoint subtrees. Cluster related to ETV resistance has two additional columns (Comp) to indicate amino-acids occupying positions rt180 and rt204. A cluster is tagged by ‘†’ if the covarying signal may be explained by the topology of the phylogenetic tree, and it is tagged by * if there is more than one independent mutational event within a tree which explains the covarying signal (see Supplementary Fig. S2).
The double mutation rtM204V/I + rtL180M is found in seven of the nine clusters. It is the most common primary-compensatory mutation of LMV resistance, known to confer resistance to LMV and LDT, and to reduce susceptibility to ETV and ADV agents (Das et al. 2001; Langley et al. 2007). Two independent evidences for this double mutation were found both in Genotypes A and C (Clusters 1, 2 for Genotype A and 14, 29 for C in Fig. 5). It was also identified within triplets of known primary-compensatory mutations (Cluster 5 for Genotype D).
All genotypes combined, four of the nine clusters display unreported substitutions located on the RT region (Clusters 5 for A, 90 for B, and 2, 5 for D). Three main observations can be made. First, Cluster 5 for A contains variation rtS219A known to be associated with ETV resistance (Tenney et al. 2007; Karatayli et al. 2012) suggesting that rtN248H might also play a role in drug resistance. Second, position rt229 appears in two clusters (90 for B and 2 for D) corresponding to mutations rtL229M/F, respectively. Only mutations rtL229G/V/W have been previously reported as compensatory LMV mutations (Ji et al. 2012). However, given the hydrophobicity similarity of Met to Val and the physico-chemical similarity of Phe to Trp, we speculate that the identified substitutions might be associated with LMV resistance too. Third, mutation rtN248H, known to decrease the susceptibility to ADV (Qin et al. 2013) appears in two clusters (5 for A and 90 for B). Here, we found that it appears to be coevolving with different pairs of primary and compensatory mutations, rtM204V + rtL180M (in A) and rtM204I + rtV207L (in B).
Importantly, three of the nine multidrug-resistance clusters show unreported substitutions located outside the RT domain, namely on TP, Spacer and RnaseH domains. Since most of the sequencing effort for resistance mutations monitoring has been concentrated on the RT domain, BIS2TreeAnalyzer coevolution analysis suggests that these positions, co-occurring with known double and triple mutants, may play a role in drug resistance.
Some resistance positions are not found as coevolving in some genotypes. For instance, rt204 and rt80 coevolve for Genotypes B and D but not for A nor C (Warner et al. 2007). In this respect, it was speculated that mutation rtL80V/I compensates for loss of replication efficiency associated with acquisition of LMV resistance, particularly under mutation rtM204I but not rtM204V, found in A. In our analysis, rtL80I co-occurs with rtM204I but not with rtM204V, supporting the aforementioned speculation.
3.3 Identification of coevolving clusters involved in ADV resistance
ADV drug resistance requires one or two primary mutations to happen. Positions known to be associated with ADV resistance (rt181, rt233, and rt236; see Table 2) are identified in 2 BIS2 clusters, one in Genotype B and the other in C. Genotypes B and C show different primary mutations (Fig. 5), rtI233V and rtA181V, respectively, as well as coevolving positions localised outside RT, in Spacer and TP. These latter can be proposed to play a role in ADV resistance. Genotypes A and D display no evidence of coevolution with ADV resistance positions.
3.4 Identification of Evolutionary Solutions Involved in Genotype C ETV Resistance
ETV is an antiviral drug with a high resistance barrier (Tenney et al. 2009). Mutational profiles conferring ETV resistance (see Table 2) highlight that at least three substitutions are necessary, such as rtL180M + rtM204V + rtT184G/S or rtL180M + rtM204V + rtS202I/G (Tenney et al. 2007; Cho et al. 2010; Locarnini and Yuen 2010; Mukaide et al. 2010). Due to the complexity of the mutational pattern to be analysed, we only considered their appearance in Genotype C (see Section 2), for which we analysed six BIS2 clusters, comprising at least one position known to be involved in ETV resistance: rt163, rt169, rt173, rt180, rt184, rt186, rt202, rt204, rt219, rt245, and rt250 (Delaney et al. 2003; Langley et al. 2007; Cho et al. 2010; Locarnini and Yuen 2010; Mukaide et al. 2010; Karatayli et al. 2012; Hayashi et al. 2015). Six out of nine of these positions coevolve, possibly with rt204 (Fig. 5 and Table 2) which is known to be mandatory for ETV resistance.
Clusters include only one mutated position related to ETV resistance. Knowing that the triple substitution (affecting positions rt180 and rt204) is required for resistance, we observe that rtM204 was fully conserved in the wildtype (twelve in Fig. 5, bottom). In this case, the sequences are not ETV resistant. In other clusters (twenty and fifty-eight in Fig. 5, bottom), coevolution at positions related to ETV resistance appears in sequences already mutated to rtM180 and rtV204. Indeed, as indicated above, it has been already observed that triple mutants can emerge in a stepwise manner (Lee et al. 2013), where the required mutations rtL180M and rtM204V appear first, followed by mutation rtS202I/G (Locarnini and Yuen 2010; Villet et al. 2007). These ‘temporal’ events in the mutational process are observed by BIS2 when considering a subset of sequences where rt202 and 712 (in RNaseH) coevolve and where rtG202 and Q712 appear in the context of rtM180 and rtV204, but not vice-versa (cluster 58, Fig. 5 bottom). In other words, in our dataset, mutations rtG202 and Q712 never appear in sequences without the mutations rtM180 and rtV204, and this fact suggests that the temporal pattern is due to drug pressure.
rtM180 and rtV204 appeared with the variant rtS202 + L712 too. The same ‘temporal’ pattern identifies coevolution between the known ETV resistance mutation rtT184L and the variant rtS75T + rtP95T (Cluster 20, Fig. 5 bottom), emerging in sequences already bearing resistance mutations rtL180M and rtM204V. These configurations may indicate that also this triple mutant may be generated in a stepwise way.
For ETV resistance, mutation rtI163V does not confer resistance in the absence of other mutational changes but restores replication efficiency suppressed by ETV resistance mutation rtA186T (Hayashi et al. 2015). We find coevolution signals between rtI163V and eight positions located outside RT. The impact of those variations is unknown (Cluster 12, Fig. 5 bottom) but they could be used to speculate on the impact of ETV resistance. Indeed, the effect of unknown coevolving positions might be compensating the ‘incomplete’ combinations of substitutions. Increasing the diversity of sequences available to construct the tree is crucial for further exploring the landscape of missing combinations.
It should be mentioned that clusters selection was based on positions, regardless of amino-acids identity, and in all cases, the substitution found coincides with those previously reported.
3.5 Analysis of covariation due to shared ancestry
To differentiate functional/structural coevolution from background signals imposed by phylogeny and random noise, is still a challenge for coevolution prediction methods (Gouveia-Oliveira and Pedersen 2007; Felsenstein 1985). To overcome this problem, we performed a parsimony reconstruction of ancestral states to elucidate if a predicted cluster of coevolving positions could be explained by shared ancestry (see Section 2). The results of this analysis of HBV genotypes are reported in Fig. 5. They show that covarying positions of Cluster 12 in Genotype C may be explained by shared ancestry because the mutational pattern was likely to occur at different branches of the tree due to independent substitutions (Supplementary Fig. S3A). On the other hand, the ancestry reconstruction of Clusters 1 of Genotype A and Cluster 14 of Genotype C indicate that two independent events of double substitutions at different branches of the tree were likely to occur generating the covarying pattern (see Supplementary Fig. S3C). All other clusters appear to be generated by double substitutions in one branch of the tree (Supplementary Fig. S3B).
3.6 Structural analysis of known and predicted resistant mutants in the RT domain
By mapping known and predicted resistance mutations in the RT domain, we want to address two questions. First, how distant are in the three-dimensional structure the positions detected by BIS2TreeAnalyzer from known drug-resistance mutations? Secondly, in the case of LMV, are compensatory mutations close to the primary mutation?
A structural analysis of resistance mutations was carried out using a structural model of the RT domain (Xu et al. 2016). In the model, position rt204 is located in the vicinity of the incoming nucleotide. In Fig. 6, both known positions involved in drug resistance (detected or not by BIS2TreeAnalyzer) and coevolved positions predicted by BIS2TreeAnalyzer to be involved in drug resistance are highlighted in the RT model structure.
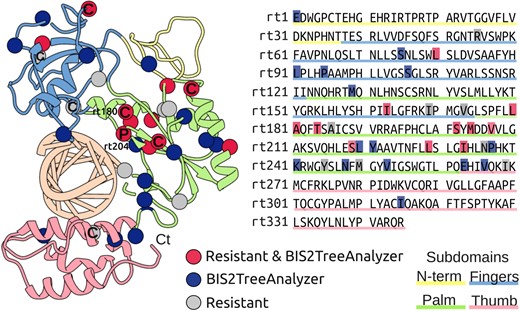
Known and predicted drug-resistance positions in the RT domain. Structural and linear representation of known and predicted drug-resistance positions: eleven known drug-resistance positions detected as coevolving by BIS2TreeAnalyzer (red), sixteen positions detected by BIS2TreeAnalyzer as coevolving with known drug-resistance mutations (blue), eight drug-resistance positions not detected as coevolving by BIS2TreeAnalyzer (grey). (Left) Model of the RT domain, known to interact with the native hybrid DNA-RNA substrate, shown in ribbon representation with residues of known and predicted drug-resistance positions represented as spheres. For LMV primary (P) and compensatory (C) mutation are indicated. Note that only one compensatory mutation (rtL180) is at physical contact distance of the primary (rt204). (Right) amino acid sequence of the RT model, positions are highlighted using the same colour code as on the left. Molecular representation and structural analyses were performed with the UCSF Chimera package (Pettersen et al. 2004).
BIS2TreeAnalyzer detects coevolution in eleven out of nineteen drug-resistance positions. Also, BIS2TreeAnalyzer detects coevolution in sixteen positions of the RT domain not previously reported, ten of them are at contact distance (i.e. a distance <6Å between any heavy atom) with a known drug-resistance position and two are in direct contact with the DNA. Except for position rt1, located in the N-terminal sub-domain, note that the remaining three positions are at contact distance with some other predicted drug-resistance position. The Palm subdomain displays the highest number of known and predicted drug-resistance positions. Over a total of twelve known drug-resistance positions in the Palm subdomain, nine of them are predicted by BIS2TreeAnalyzer. Seven other predicted positions never were highlighted before.
Considering the known primary position rt204 and seven compensatory LMV resistance positions, BIS2TreeAnalyzer detects coevolution between rt204 and four out of seven known compensatory mutations. Only two compensatory mutations are at contact distance from the primary position rt204: rtL180M, involved in the most common compensatory mutation, and rtM129 predicted as compensatory but not reported before. It should be noticed that many methods for coevolution analysis have been designed to detect residues in physical contact, and inter-residue distance is used as a proxy to assess the predictive performance of the methods (Hopf et al. 2014). In contrast, BIS2TreeAnalyzer exemplifies that its predicted coevolving residues, corresponding to primary and compensatory mutations, are not necessarily in contact and that distant compensatory mutations may reflect coevolving position’s functional dependency rather than protein local structural stability’s preservation (Fares and Travers 2006).
It is worth mentioning that the structural analysis of LMV was carried out with clusters containing position rt204 (clusters of Fig. 5), some compensatory positions coevolve with positions different than rt204, but they were not considered in this analysis (see Section 2.7).
4. Discussion
Drug-resistance mutations can appear in complex combinations. Some drugs might require a number of substitutions to occur together for a virus to acquire resistance, and some other drugs might require a primary drug-resistance mutation appearing together with one or several compensatory ones. In the past, the analysis of subsets of viral sequences allowed to unravel some of these combinations (for instance, HIV and HCV proteases have been shown to present primary and compensatory mutations (Molla et al. 1996; Berkhout 1999; Yi et al. 2007)). Here, we demonstrate that large sets of viral sequences can be used to extract information on viral response to drugs. Our hypothesis is that coevolution with known resistance mutations provides sufficient evidence to draw the attention on new reported positions. At the best of our knowledge, BIS2TreeAnalyzer is the first computational approach providing an automatic identification of combinations of drug-resistance mutations based on covariation. It opens the way to new investigations of the landscape of mutations for viruses. For HBV, our analysis showed patterns containing new compensatory mutations for positions located inside and outside the RT Pol domain, and temporal patterns of appearance of drug-resistance mutations were identifiable. Further experimental analyses are needed to assess the impact of these reported substitutions on drug resistance or viral fitness since these substitutions may be considered for anti-virus drug design, development, and treatment.
Due to HBV genome organisation, the S gene encoding the virus’ envelope proteins (large, middle, and small) is completely embedded in the gene for Pol (Mizokami et al. 1997). Pol and S overlapping region comprises part of Spacer and RT domains (181—rt235). Hence, in this region, a change in the nucleotide sequence may simultaneously affect Pol and the envelope proteins. For instance, the primary mutation rtM204V corresponds to change sI195M in the small surface protein and may affect its antigenicity (Torresi et al. 2002). The converse is also true, with vaccine and immune globulin-escape mutations in S that can be selected producing Pol mutations capable to restore the replication fitness when introduced in a replication impaired Pol (Torresi et al. 2002). We cannot ignore the possibility that the coevolutionary signal reported for Pol overlapping region may be associated with compensatory mutation(s) in surface proteins. Considering the clusters associated with the multidrug-resistance position rt204, we report substitutions at thirty-one positions belonging to the overlapping region, only eight of them show coevolution in the surface protein (data not shown). Moreover, four of these eight positions are known drug-resistance compensatory mutations which are selected during treatment, suggesting that the selection pressure was on Pol, generating a concomitant change in the surface proteins.
Although rare, it is possible that treatment-naïve individuals would inherit drug resistance. Indeed, a drug-resistance mutation could be transmitted and subsequent substitutions could be selected by a reason different than drug resistance, as a mere response to some immune pressure or geographical context, for instance. In this respect, it was observed that some pre-existing drug-resistance mutations have a higher prevalence than others (Li et al. 2015; Pacheco et al. 2017; Choi, Lee, and Kim 2018). By considering this scenario, some clusters should be taken with caution and especially those related to ETV and ADV resistance, where only one known resistance mutation is present. All reported clusters related to LMV resistance present at least two known resistance mutations and they are encountered with very low frequency in treatment-naïve individuals, making this hypothetical situation even less likely to occur (Choi, Lee, and Kim 2018).
On the methodological side, it should be observed that our Pol analysis has been realised fully automatically. BIS2TreeAnalyzer systematically applied BIS2 to all subtrees of the distance tree for the available viral sequences of each HBV genotype. Clusters of coevolving positions were automatically handled and combined to evaluate the confidence. This automaticity makes BIS2TreeAnalyzer a suitable approach to compute coevolution in any dataset of conserved sequences, not limited to any particular taxon.
The analysis was realised on the full set of sequences in the reference repository database of HBV sequences. Yet, coevolution signals that BIS2TreeAnalyzer detected depend on the sequences present in the database. The future availability of large quantities of HBV sequences from patients will allow to reach a thorough overview of the landscape of evolutionary solutions taken by HBV to resist drugs. BIS2TreeAnalyzer can help the systematic identification of these combinations of substitutions, making accessible the writing of the large catalogue of mutational variants, the temporal patterns regulating their appearance and their effects. In this respect, an analysis of 639 HBV whole-genome sequences obtained from eleven patients showed that adaptation to LMV is not associated with strong bottleneck events (Thai et al. 2012), implying that drug resistance is a complex trait that is much more complex than previously described because it is encoded in the full HBV genome rather than a few substitutions in the RT domain. As such, it should be defined by epistatic connections among HBV genomic sites, with the primary and secondary LMV resistance mutations being involved in these connections. In perspective, the future availability of full HBV genomes sampled from many patients will provide a unique opportunity to BIS2TreeAnalyser to search for coevolving positions beyond the Pol protein, by considering the entire HBV genome, the relatively short size of the genome being not an obstacle for the analysis (Champeimont et al. 2016). In this respect, other coevolution analysis approaches, such as GREMLIN and hpPCA, could be impaired by the genome length as shown in our tests.
Finally, we highlight that the BIS2TreeAnalyzer method is designed to indirectly taking into account epistatic effects while detecting coevolution. This is done in three main ways. Firstly, BIS2TreeAnalyzer is following the topology of the tree in its analysis and this topology is a consequence of the global sequence alignment that assembles, into subtrees, sequences sharing signals through all their length. Hence, indirectly, the method detects coevolution signals within contexts where the epistatic effect is the strongest. In other words, epistasis guides the identification of coevolving positions. Secondly, in the selection step of the BIS2TreeAnalyzer method, when two clusters are found and one contains the other, it is the largest cluster that is favoured and kept. Again, the larger possible signal among positions in the sequence is retained, covering possible epistatic effects. Thirdly, the binomial P-value reflects the number of positions in the sequence alignment that display the same signal of coevolution: larger the number of positions involved in the signal smaller (and therefore stronger) the P-value score.
Acknowledgments
The authors thank Dr Domenico L. Gatti for his helpful advice on MSAvolve toolbox technical issues.
Funding
The French ‘Agence Nationale de la Recherche sur le SIDA et les hepatites virales’ (ANRS CSS4 ECTZ25224-2017-19), the Institut Universitaire de France, LabEx CALSIMLAB (public grant ANR-11-LABX-0037-01 constituting a part of the ‘Investissements d’Avenir’ program—reference: ANR-11-IDEX-0004-02).
Conflict of interest: None declared.
