Fig. 8 Growth and ion contents of wild-type (WT) and transgenic rice cells overexpressing OsNHX1 grown at various salt concentrations. Wild-type rice cells (lines 97-4-5 and 97-5-15) transformed with pMSH1 and transgenic cells (lines 95-1-35 and 95-5-169) transformed with pMSH1+OsNHX1 were cultured in the presence of 0, 0.1 and 0.2 M NaCl for 14 d. (A) Western blot analysis of the tonoplast fractions isolated from these cells. Protein (7 µg) was separated on a 10% SDS-PAGE gel and immunoblotted with antibodies against the COOH-terminus of OsNHX1. (B and C) Growth of wild-type (white bars; 97-4-5 in B and 97-5-15 in C) and transgenic cells (black bars; 95-1-35 in B and 95-5-169 in C) is shown as % control of dry weight. Each value is the mean ± SD of three independent experiments. Asterisks represent significant differences between the wild-type and transgenic cells (P <0.01, Student’s t test). (D and E) Na+ (D) and K+ (E) contents of wild-type (white bars; 97-5-15) and transgenic cells (black bars; 95-5-169). Ion contents were determined as shown in Materials and Methods. Each value is the mean ± SD of three independent experiments. Different letters in each graph (a–c in D and a–d in E) indicate significant differences (P <0.05, ANOVA and Tukey’s test). DW, dry weight.
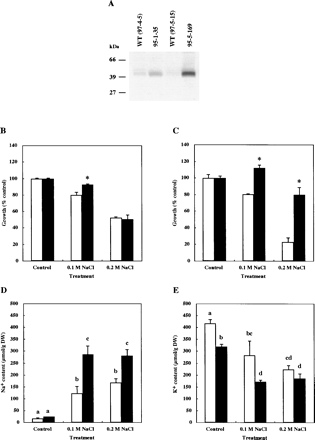
Fig. 8 Growth and ion contents of wild-type (WT) and transgenic rice cells overexpressing OsNHX1 grown at various salt concentrations. Wild-type rice cells (lines 97-4-5 and 97-5-15) transformed with pMSH1 and transgenic cells (lines 95-1-35 and 95-5-169) transformed with pMSH1+OsNHX1 were cultured in the presence of 0, 0.1 and 0.2 M NaCl for 14 d. (A) Western blot analysis of the tonoplast fractions isolated from these cells. Protein (7 µg) was separated on a 10% SDS-PAGE gel and immunoblotted with antibodies against the COOH-terminus of OsNHX1. (B and C) Growth of wild-type (white bars; 97-4-5 in B and 97-5-15 in C) and transgenic cells (black bars; 95-1-35 in B and 95-5-169 in C) is shown as % control of dry weight. Each value is the mean ± SD of three independent experiments. Asterisks represent significant differences between the wild-type and transgenic cells (P <0.01, Student’s t test). (D and E) Na+ (D) and K+ (E) contents of wild-type (white bars; 97-5-15) and transgenic cells (black bars; 95-5-169). Ion contents were determined as shown in Materials and Methods. Each value is the mean ± SD of three independent experiments. Different letters in each graph (a–c in D and a–d in E) indicate significant differences (P <0.05, ANOVA and Tukey’s test). DW, dry weight.

Close
This Feature Is Available To Subscribers Only

Sign In or Create an Account

Close

This PDF is available to Subscribers Only

View Article Abstract & Purchase Options

For full access to this pdf, sign in to an existing account, or purchase an annual subscription.

Close