


Abstract
The “resource curse” is often understood to imply poor growth in the non-resource sectors of the economy, but research into the diversification performance of resource-rich countries is limited. This paper surveys recent evidence and identifies empirical patterns in the economic diversification of resource-rich countries. Diversification is measured using the growth of per capita non-resource (manufacturing and services) sectors in domestic and export markets, which has a cleaner interpretation than competing measures. This measure is used to evaluate the long-term diversification of countries that started off as resource-dependent, and to rank countries according to their performance. We then identify policy-relevant correlates of diversification at the national level, including the acquisition of human capital, public and intellectual capital, and firm dynamism. More resource-dependent countries appear to perform worse on measures of human capital and intellectual capital, but more resource-abundant countries perform better on public capital and human capital accumulation. We examine the mechanisms behind diversification performance through in-depth case studies of Oman, Laos, and Indonesia, and conclude by identifying policy lessons and future research directions.
Introduction
Although an extensive body of the “resource curse” literature has examined the multifaceted relationship between natural resources and economic development (Van der Ploeg 2011; Ross 2013; Venables 2016), the topic of economic diversification specifically has received much less attention. One of the most pronounced manifestations of resource wealth is a low level of economic diversification, as natural resources assume a dominant place in export income and government revenues (Ross 2017; Bahar and Santos 2018). This low level of economic diversification can be harmful, as the concentration of economic activities around natural resources makes resource-rich countries vulnerable to economic shocks related to volatile commodity prices and resource stock depletion (Devlin and Titman 2004; Van der Ploeg and Poelhekke 2009; Venables 2016). Reliance on extractive industries that are heavy in regulatory rents can also stymie the development of political and market institutions that promote broad-based growth (Pritchett, Sen, and Werker 2017).
To policymakers in resource-rich countries, the most fundamental challenge of resource-led development is how to turn a resource in the ground into physical and human capital that can be used to provide prosperity for their citizens (Morrison 2010). The best measure of economic diversification that corresponds to success in that metric is growth in the non-resource side of the economy. Consider the examples of Canada and the Republic of Congo. According to World Bank data, the two countries have the same levels of natural resource endowment, with resource rents per capita of around USD 1,200 as of 2014. GDP per capita in Canada, however, is nearly eight times higher than that of the Republic of Congo. As both countries started off as highly resource-dependent countries, the relevant policy question is how Canada managed to diversify away from natural resources and develop a highly productive non-resource sector while the Republic of Congo has failed to do so.
Unfortunately, current research is primarily concerned with documenting the effects of natural resources on aggregate outcomes such as GDP per capita (growth; Van der Ploeg 2011). This is surprising, since pioneering theoretical work into the so-called Dutch Disease had concluded that resource booms crowded out tradeable non-resource sectors through increased input prices and currency appreciation (Corden and Neary 1982). In empirical terms, the failure to distinguish between resource and non-resource sectors could also lead to a spurious conclusion since the negative association between resources and GDP could reflect underperformance of the resource sector itself (James 2015). In terms of practice, the dearth of systematic research into the drivers of diversification in resource-rich countries has limited the relevance of academic findings for policy-making. While the need to reduce resource dependence is widely advocated (e.g., Gelb 2010; IMF 2016), the means to achieve it are less clearly articulated (Ross 2017).
The purpose of this paper is not to resolve the resource curse debate or determine whether natural resources raise or lower GDP. Rather, we have four interlinked goals. First, we aim to measure the rate of growth of non-resource economic activity in countries that are resource-rich, and second, we rank countries in the order of their success in these measures. Third, we identify a set of country-level “competitive capabilities” that can be used, in theory, to drive non-resource growth, and we examine whether the more successful diversifiers have indeed performed better in developing these capabilities. Finally, we conduct case studies on the three top diversifiers, as identified by our measure, and explore the extent to which the development of competitive capabilities seems to have contributed to economic diversification.
In order to measure economic diversification performance in resource-rich countries, we first need to define each of those concepts and select variables to measure them. This is done following our critical assessment of the literature in the next section. We use three measures of resource wealth: for data availability, our primary measure is the export share of natural resource commodities including oil, gas, coal and minerals, but excluding agricultural commodities. The other measures are the share of resource rents in GDP and resource rents per capita. Our measure of economic diversification performance is the growth rate of per capita value added of manufacturing and services, and we also look at export growth for the same sectors.
We then report the results of the measurement and rankings exercise. Defining 42 countries as resource-rich based on their export share of resources in the 1970s, we examine their economic diversification performance over the period of 1981–2014. As it turns out, these countries have achieved moderate success in registering non-resource growth. We do not find any correlation between the level of resource wealth in the 1970s and non-resource growth in subsequent years within that sample. When we consider the full sample that includes resource-poor countries, we find suggestive evidence that resource-rich countries have registered slower average growth in service value added and exports.
The next section explores policy-related factors that may have enabled successful diversification. Drawing on the related development economics literature, we identify national-level “competitive capabilities” that are potential ingredients in successful economic diversification: human capital attainment, public and intellectual capital development, and business capacity development (Djankov et al. 2002; Schwab and Sala-i-Martin 2017). Compared to other outcomes of interest, competitive capabilities are informative as they are more likely to be driven by policy interventions, and thus hint at the way resource wealth affects intermediate policy variables that drive economic diversification.
We find that resource wealth is positively associated with some competitive capabilities (e.g., stock of infrastructure per person), but negatively correlated with others (e.g., some measures of human capital attainment, R&D and innovation performance, and financial access). Moreover, this relationship depends on the way resource wealth is measured. Resource dependence (the share of resources in exports or GDP) is often negatively associated with competitive capabilities, whereas resource abundance (resource rents per person) has positive associations with some competitive capabilities. We also find that the most successful diversifiers do not have uniformly high levels of competitive capabilities, and this is particularly the case for extremely resource-dependent countries. In these countries, something other than excellence in competitive capabilities must be enabling diversification.
We select three countries—Oman, Laos, and Indonesia—that registered the highest level of manufacturing value added growth for a closer investigation. The case study into the diversification performance of Oman revealed that diversification success remains elusive among extremely resource dependent countries. Although Oman registered double-digit manufacturing growth rates for decades (which was the fastest in our sample) its manufacturing sector today contributes to only 10% of its GDP. The experiences of Indonesia and, to a lesser extent, Laos, suggest that active diversification policies can yield fruitful results under favorable conditions that include access to markets and foreign technologies.
These results shed light on the broad patterns of diversification performance in resource-rich countries. They also reveal that resource dependence could have uneven effects on manufacturing and service growth, highlighting the importance of using disaggregated data to identify heterogeneous sectoral effects. The examination of competitive capabilities and the case studies indicate the varied diversification experiences of countries. More importantly, highly resource (oil)-dependent countries are uniquely characterized by limited diversification success even when non-resource growth rates are high, and for failing to build competitiveness capabilities given their income levels. Relatively successful diversification in other less resource-dependent countries has been stimulated by different internal and external drivers, and builds on natural endowments (e.g., agribusiness and labor-intensive manufacturing in Indonesia). Countries also leverage different types of competitiveness policies and capabilities, with no single success “formula” emerging from the sample.
Current Evidence on Resources and Diversification
If a lack of diversification increases a country's vulnerability to the “resource curse,” it follows that understanding the diversification performance of resource-rich countries is central to the question of how to mitigate the resource curse (Van der Ploeg and Poelhekke 2009; Collier and Goderis 2012; Sala-i-Martin and Subramanian 2013). Economic diversification in and of itself may be an important policy target as it can temper the boom-and-bust cycle of resource-rich economies, which follows global commodity price cycles. The resource curse literature, however, lacks consensus on the extent to which natural resources undermine economic diversification. There are at least four potential challenges that have inhibited the emergence of a clear answer on the relationship between resources and economic diversification.
The first difficulty is due to measurement challenges since resource and non-resource sectors exhibit significant overlap. The vast majority of current research focuses on GDP per capita growth, which includes resource and non-resource sectors that respond differently to resource windfalls. Aggregate GDP data is thus unable to capture heterogeneous responses between tradable and non-tradable goods in the presence of Dutch Diseases (Corden and Neary 1982). Moreover, since GDP includes resource-related activities, the negative relationship between resource wealth and GDP per capita could simply reflect declining terms of trade for commodities, or volatile commodity prices (James 2015). Establishing the relationship between resources and diversification, therefore, requires a closer investigation into the performance of non-resource sectors. This can be challenging since semi-processed natural resources are often classified as manufactured goods, while “non-resource” service activities often include activities that are parts of the extractive value chain. In addition to these measurement challenge, the strong inter-linkage between resource and non-resource activities means that carefully designed identification strategies are required to arrive at robust conclusions.
The second issue that limits our ability to measure resource and non-resource growth is price correction. Commodity prices exhibit significant boom-and-bust dynamics, which necessitates making appropriate price corrections. Since overall price levels in resource-rich countries generally follow resource commodity prices, nominal non-resource output will appear high in periods of commodity price boom, and low in periods of commodity price bust even when its real value is unchanged. For total GDP, correction can be made using GDP deflators from sources such as the International Comparison Program of the World Bank. Unfortunately, sectoral deflators are not available for making different adjustments for resource and non-resource sectors. Researchers using sectoral data thus have to contend with using aggregate GDP deflators, which is also the approach we follow in our analysis. This can introduce systematic measurement bias in periods of commodity boom and bust since the aggregate deflator will understate price changes in resource sectors, and overstate price changes in non-resource sectors.
Third, the nature of the relationship between non-resource growth and resource wealth could depend on the time period and horizon considered. The relationship, for example, has been generally non-negative during periods of commodity price booms in the 1970s, and more recently since the early 2000s (James 2015; Venables 2016). Some argue that high resource revenues in themselves can be beneficial, and the negative impact on economic performance is due to the volatility of commodity prices (Van der Ploeg and Poelhekke 2009; Collier and Goderis 2012). Using rich census data from the United States, Allcott and Keniston (2017) report that resource booms are associated with higher growth of employment and wages in manufacturing sectors among affected counties. Manufacturing output expanded due to linkages with locally traded sectors, although highly-tradable manufacturing subsectors contracted during booms. An explicit focus on commodity price cycle and the time lag after resource discoveries could thus be important for understanding the effect of resource windfalls on economic diversification.
A fourth challenge in establishing a causal link between resource wealth and economic diversification performance is the multiplicity of channels that could link the two, which include political, institutional, and economic channels. Frankel (2012) identifies six possible channels for the resource curse: (i) long-term trends in world prices; (ii) price volatility; (iii) permanent crowding out of manufacturing; (iv) autocratic/oligarchic institutions; (v) anarchic institutions and potential civil wars; and (vi) cyclical Dutch Disease that elicits the expansion of the non-traded sector. Collier and Goderis (2012) list the following routes: Dutch Disease, governance, conflict, excessive borrowing, inequality, volatility, and lack of education. To overcome identification challenges researchers have increasingly relied on instrumental variable-based approaches that use exogenous sources of variation in resource wealth on economic performance (Brunnschweiler 2008; Brunnschweiler and Bulte 2008, 2009; Collier and Goderis 2012). More recently, researchers (e.g., Smith 2015) are adopting (quasi-) experimental approaches for identification purposes (Van Der Ploeg and Poelhekke 2017). In light of these multifaceted complications that limit establishing causal relationships, this study takes a more pragmatic approach of analyzing diversification patterns and their drivers across countries and over time.
Measuring Resource Wealth and Economic Diversification
Resource Wealth
The measurement of what constitutes resources has been evolving with time in the resource curse literature, with the earlier studies (Sachs and Warner 1995, 1997) treating all primary products such as agricultural commodities as resources. Subsequent research has narrowed the focus on extracted (as opposed to produced, as in agricultural commodities) resources, with a particular distinction made between “point source” and “diffused” resources (Isham et al. 2005). While diffused resources, including most agricultural commodities, are hard to centrally control, point resources such as minerals, oil and alluvial diamond are considered easier to control, trade, and appropriate (Boschini, Pettersson, and Roine 2007). Moreover, minerals and hydrocarbons are exhaustible, and thus fit logically into the goal of diversification so that economic activity can continue after the resource has been depleted; agriculture, being renewable, is not a concern from that perspective. In line with this, our measures of resource wealth are based on the production of major, exhaustible, “point source” resources—namely oil, gas, coal, and minerals.
Researchers whose primary focus is the developmental challenges of the resource curse often use measures that reflect a country's reliance on natural resources for its export revenue or economic output (e.g., Sachs and Warner 1995; Stevens and Diestche 2008; Venables 2016).1 We follow a comparable approach and measure resource wealth using the contribution of resources (i.e., oil, gas, coal, and minerals) in total merchandise exports over the period 1971–1980. This indicator reflects the economic significance of resources, which makes it the most relevant measure given the study's focus on diversification away from resource-based economic activities. To identify resource-rich countries, we use a minimum threshold of 25% of resource shares in export revenues in the period 1971–1980, which resulted in 42 resource-rich countries.2 The full list and description of the variables in the paper is provided in table S1 in the supplementary online appendix (available with this article at The World Bank Research Observer website).
Our baseline analysis is thus based on a measure of resource dependence that gauges the importance of resources in total merchandise exports. This measure has been criticized for introducing selection bias since the share of resources in exports will be greater in low-income countries with different underlying institutional and economic structures (Brunnschweiler and Bulte 2008). More recent studies have, therefore, started to use resource abundance, which is calculated as resource revenues or rents per capita (e.g., Alexeev and Conrad 2009; Ross 2017). To address the potential caveat of relying on a single measure, we report two additional measures of resource wealth. The first is the share of resource rents (from oil, gas, coal, and minerals) in total GDP, which is taken from the World Bank's Adjusted Net Savings database. The last alternative measure is resource rents per capita, which is also based on resource rent data from the World Bank's Adjusted Net Savings database. Both alternative measures are based on average values over the period 1976–1980. We use the export-based indicator as our preferred measure since it has greater country coverage in the 1970s and is less likely to suffer from measurement problems. Finally, the supplementary online material reports two additional measures of resource dependence that include agricultural commodities, as discussed in the next section. To make our nomenclature clear, we refer to any of these three measures as measures of “resource wealth.” When we are specifically referring to the share of resources in exports or GDP, we denote that as “resource dependence,” and when we are specifically referring to the level of resources per capita we call it “resource abundance.”
Resources constitute, on average, 65.3% of export revenues and 16.5% of GDP, and resource rents amount to some $7,600 per capita, across our sample of 42 resource-rich countries (see table S2). Since there is a big difference in what diversification might look like between countries with 25% of exports being natural resources and those close to 100%, we divide the countries into three groups. We identified 13 moderately resource-rich countries (export share of resources: 25%–50%), 13 highly resource-rich countries (export share of resources: 51%–85%), and 16 extremely resource-rich countries (export share of resources: >85%).3 Among the extremely resource-rich countries, Saudi Arabia, Zambia, Venezuela, and Oman top the list, with resources contributing to at least 95% of their export revenues in the years 1971–1980; Bahrain was at the bottom at 85%. The group of highly resource-rich countries ranged from Mauritania at 83% down to Angola, at 55%. For the moderately resource-rich countries, Tunisia was the most dependent at 49% and Canada and Senegal were at the bottom of the group with just 26% of export revenues coming from natural resources.
Although the two alternative measures of resource wealth—the share of resource rents in GDP and resource rents per person—are significantly correlated with the baseline measure (table 2), they depict a somewhat different picture of the relative levels of resource dependence. While resource rents constituted nearly half of the GDP of Saudi Arabia and Oman in the period 1976–1980, their contribution was much smaller in extremely resource-rich countries like Zambia (12%) and Venezuela (18%). The average contribution of resource rent in the GDP of extremely resource-rich countries was 25%, while the equivalent in highly and moderately resource-rich countries was 13% and 6%, respectively. In poorer countries, non-resource GDP is large even when the share of exports in resources is significantly high, suggesting the lack of globally-competitive firms outside the resource sector. Per capita resource rents are notably different among countries with comparably high levels of resource dependence. Resource rent per capita in Saudi Arabia, for example, was nearly 130 times higher than in Zambia, though resource exports constituted nearly all merchandise exports in both countries. Relative measures of resource dependence, therefore, can mask substantial absolute differences in resource abundance.
Economic Diversification
There are three approaches for measuring economic diversification: variety-based, quality-based, and output-based. Variety-based measures gauge the diversity of economic activities regardless of their quality, which is closer to the literal meaning of diversification (see Cadot, Carrere, and Strauss-Kahn 2013; Ross 2017; Bahar and Santos 2018). Quality-based measures of diversification are related to the concept of structural change (McMillan, Rodrik, and Verduzco-Gallo 2014) and consider the shift of production toward economic activities that offer greater value addition and/or competitive advantage. Output-based measures consider changes in non-resource economic production regardless of its composition.
Variety-based and quality-based measures of diversification have some theoretical appeal, but require large and disaggregated datasets (Ahmadov 2014). Available sources of domestic sectoral data suffer from uneven coverage and poor quality, limiting analysis at an international level. Measuring quality-based measures of export diversification further requires unit-level input-output data, and involves econometric specifications with restrictive assumptions. Finally, variety-based measures have the additional limitation of being influenced by exogenous changes. For example, export concentration could appear to improve when resource exports decline either due to resource depletion or price fall.
Despite its simplicity, an output-based measure of non-resource economic activity has not been utilized to measure economic diversification in resource-rich countries.4 This is an important omission given the measurement challenge and data quality limitations of the other diversification measures as well as some further advantages of output-based measures. This study attempts to fill in this gap by using the growth of manufacturing and services sectors, measured according to their domestic and export performance. This is in line with a large body of research that expounds the importance of these sectors for employment creation, structural change, and technological convergence (e.g., see Rodrik (2013) for manufacturing and Eichengreen and Gupta 2011 for services).
Unfortunately, measurement problems are not absent with output-based measures of diversification either. These sectors include activities that are highly resource intensive. For example, manufacturing includes ISIC division 23, which includes the manufacture of coke and refined petroleum products, and division 24, which consists of the manufacture of chemicals and chemical products. Services include the public sector, which may be financed with resource revenues. Our reliance on these sectors is due to the need for comparable, national account data to assess diversification performance across countries. Cross-country data on domestic value added in the non-resource sector is not broadly available at a finer level of detail. Nonetheless, the use of value added rather than gross output provides a measure of diversification that is consistent with its theoretical meaning since it only captures the economic value added through refining and other processing activities. Moreover, for our three case study countries, we present more disaggregated data at the subsector level that can address this caveat.
For our ranking exercise, which we describe in the next section, we prefer manufacturing value added growth rates, which are less likely to be tainted with resource revenues than services. Yet looking at both manufacturing and services together is likely to be informative, given the potentially outsized role of the service sector in the presence of Dutch Disease. In addition, we analyze the growth in exports of both manufacturing and services, which may be better able to capture the strength of globally-competitive non-resource economic activity. We prefer value added (total domestic economic activity) to exports for the ranking exercise for two reasons. One, unlike gross exports, value added subtracts out the cost of intermediate goods, which in some industries might constitute a massive share of the total gross output that could lead to biased measurement. Secondly, production writ large (as captured by value added) is important for employment and wealth creation, whether the product is sold in domestic or foreign markets. Production, rather than exports per se, is what generates employment and prosperity. For example, countries like the United States and Japan have a very low share of exports to GDP; China is struggling to generate more of its own home-grown demand. Thus, there is nothing wrong when resource-rich countries grow by expanding their domestic economies, and this phenomenon goes unobserved when restricting the focus to export-based measures of diversification alone.
All of the growth rates in value added and exports are calculated on a per-capita basis using value added and exports in constant prices. For example, manufacturing value added per capita is equivalent to manufacturing value added in constant prices divided by the number of manufacturing workers, multiplied by the share of the population working in the sector. This value added rate increases either when the per worker productivity increases, or when the sector's employment share rises, both of which are good for a resource-rich country trying to diversify. The measure is meant to represent the opportunity of potential employment in manufacturing in a similar way that resource rents per capita measure resource income available for citizens.
Economic Diversification Performance of Resource-Rich Countries
As a descriptive exercise, we analyze country-level performance in economic diversification according to the output-based measures described in the previous section among the 42 countries that started off as resource rich. We then look within the sample and examine whether greater resource wealth is correlated with better or worse subsequent performance in economic diversification.
Within each country group based on resource wealth, we rank countries based on their average manufacturing value added growth. Table 1 reports the four best performers within each of the above three categories based on manufacturing value added per capita growth rate (the full set of countries is available in table S2). The table also reports performance on the other three measures of output-based diversification for those countries: growth in manufacturing exports, and growth in services value added and exports. The average growth rate of manufacturing value added per capita across the whole sample of resource-rich countries between 1981–2014 was 2.6%. The fastest manufacturing growth rate was registered in Oman (10.9%), followed by Laos (9.3%), Indonesia (8.6%), Egypt (6.4%), and Malaysia (5.9%). These five countries also registered consistently higher growth rates than their peer countries in almost all non-resource economic activities. Angola (−6.7%) and Syria (−6.4%) came out at the bottom of the list (table S2 in the supplementary online material).
Highly Successful Diversifiers among Country Groups with Varying Levels of Resource Wealth
| Average per capita growth rates (1981–2014) | ||||||
|---|---|---|---|---|---|---|
| GDP | GDP | Manufacturing | Manufacturing | Service | Service | |
| pc | pc | value added | exports | value added | exports | |
| Group I: Extremely resource-rich countries (resource share of exports >85%) | ||||||
| Oman | 62,932 | 1.7 | 10.9 | 6.3 | 4.7 | 14.4 |
| Suriname | 28,039 | 1.4 | 4.6 | 5.9 | 4.9 | 1.4 |
| Nigeria | 8,139 | 0.6 | 4.3 | 14.6 | 6.1 | −0.3 |
| Saudi Arabia | 86,930 | −0.8 | 3.9 | 10.1 | 2.6 | −1.1 |
| Average | 55,697 | 0.7 | 2.9 | 7.2 | 3.5 | 3.9 |
| Group II: Highly resource-rich countries (resource share of exports: 51%–85%) | ||||||
| Laos | 4,946 | 4.7 | 9.3 | 20.3a | 11.8 | 11.4 |
| Indonesia | 10,412 | 3.6 | 8.6 | 12.7 | 8.0 | 10.6 |
| Peru | 14,120 | 1.6 | 5.7 | 6.0 | 5.8 | 4.3 |
| Chile | 31,030 | 2.1 | 3.0 | 9.5 | 5.3 | 5.6 |
| Average | 9,461 | 1.3 | 1.7 | 6.2 | 3.1 | 5.2 |
| Group III: Moderately resource rich (resource share of exports 25%–50%) | ||||||
| Egypt | 18,262 | 4.9 | 6.4 | 9.5 | 6.3 | 4.3 |
| Malaysia | 30,117 | 2.7 | 5.9 | 10.3 | 8.3 | 8.3 |
| Tunisia | 27,279 | 1.9 | 4.4 | 6.6 | 4.5 | 3.1 |
| Norway | 91,313 | 3.1 | 4.1 | 4.3 | 6.0 | 4.9 |
| Average | 34,981 | 1.8 | 3.0 | 7.0 | 4.5 | 4.5 |
| Grand averages | ||||||
| Resource rich | 35,094 | 1.98 | 2.59 | 6.83 | 3.71 | 4.52 |
| Resource poor | 26,785 | 1.24 | 3.71 | 3.79 | 5.11 | 6.45 |
| Mean differenceb | 8,309 | 0.75** | −1.12 | 3.04 | −1.40** | −1.93** |
Source: Authors’ calculations based on data from the World Development Indicators, IMF, and WTO databases.Note: The ranking of countries and the identification of best diversifiers is based on the annualized average growth rate of manufacturing value added per capita over the period 1981–2014. The best performers are selected from a sample of 42 resource-rich countries listed in Table S2 in the supplementary online material. GDP per capita (i.e., per working population) and its growth rate are measured in PPP prices that are comparable across countries over the period 1981–2014. The remaining variables are measured in constant prices comparable over time. The average of each of the groups is for the whole group, not just the best performers listed on this table. aGrowth rate of manufacturing exports for Laos based on 2010–2014, the only period covered by WTO, our data source. bThe equality of means is statistically tested using standard t-tests. Asterisk * indicates p-values <0.10, while ** indicates p-values <0.05.
The best diversifiers identified in table 1 include nearly all of the fastest-growing countries in the sample based on GDP per capita growth. Our list also includes all three countries that Venables (2016) identified as best performing resource-rich countries—namely, Botswana, Malaysia, and Chile. Comparing across country groups, we note that extremely resource-rich countries differ from the remaining groups for registering subpar GDP per capita growth (average 0.7%), but relatively higher manufacturing value added growth (average 2.9%) and manufacturing export growth (average 7.2%). Their service value added and exports also grew at close to the overall average. Given their relatively low initial levels of diversification, this could reflect the relative ease of achieving high growth rates from a very low base. The decent diversification performance in extremely resource-rich countries could thus be due to what Gerschenkron (1962) referred to as the advantage of “backwardness,” where numerous profitable opportunities for growth exist in these sectors, which may be quickly exploited.
Table 2 reveals that none of the measures of resource wealth has a significant and negative correlation with manufacturing and service growth. In fact, most of the correlations are positive, and one is even statistically significant (resource rents as a share of GDP and the growth in service exports per capita), though that is about what one would expect as a matter of chance. Within the relatively homogenous sample of resource-rich countries, therefore, there is no prima facie evidence that resource wealth is associated with lower levels of non-resource growth. However, this does not amount to ruling out the possibility of a resource curse since it could also be argued that these countries should have exploited their resources to achieve above-normal growth rates.
Correlation between Resource Wealth (1970s) and Non-resource Growth (1981–2014)
| Resources | Resource rents | Resource rents | |
|---|---|---|---|
| (% of exports) | (% of GDP) | per capita (log) | |
| (1) | (2) | (3) | |
| 1. Resources (% of exports) | 1 | ||
| 2. Resource rents (% of GDP) | 0.67 | 1 | |
| (0.00) | |||
| 3. Resource rents per capita (log) | 0.54 | 0.79 | 1 |
| (0.00) | (0.00) | ||
| 4. GDP per capita (log) | 0.05 | 0.40 | 0.66 |
| (0.77) | (0.01) | (0.00) | |
| 5. GDP per capita growth | −0.22 | −0.16 | −0.11 |
| (0.17) | (0.34) | (0.49) | |
| 6. Manuf. value added growth | 0.04 | 0.06 | 0.04 |
| (0.82) | (0.73) | (0.82) | |
| 7. Manuf. export growth | 0.05 | −0.09 | −0.03 |
| (0.76) | (0.58) | (0.88) | |
| 8. Service value added growth | −0.14 | −0.14 | −0.06 |
| (0.40) | (0.40) | (0.73) | |
| 9. Service export growth | −0.05 | 0.34 | 0.21 |
| (0.74) | (0.03) | (0.19) |
Source: Authors’ calculations based on data from the World Development Indicators, IMF, WTO, and the World Bank's Adjusted Net Savings databases.Note: The figures outside parentheses are pair-wise Pearson correlation coefficients, and those within parentheses indicate their p-values. GDP per capita is an average value from 1981–2014. The measurement and data sources of variables are given in table S1. The results in this table and all other tables in this paper are based on the sample of 42 resource-rich countries listed in table S2.
The bottom row of table 1 compares the growth performance of the 42 resource-rich countries with the rest of the world. For manufacturing, resource-rich countries registered lower per capita value-added growth (by one percentage point) and greater per capita export growth (by three percentage points), although neither of these differences is statistically significant. However, resource-rich countries have significantly lower levels of services growth, which is lower by 1.4 percentage points for per capita value added, and by almost two percentage points for per capita exports. These results are consistent with reports of declining service GDP shares in highly resource-rich countries (Diop, Marotta, and de Melo 2012), and suggest that the manifestations of Dutch Disease could extend to services in an increasingly globalized world where trade in services is becoming paramount. In addition to a slow-growing and volatile resource sector discussed by James (2015), an underperforming service sector could thus be a drag on GDP growth in resource-rich countries. We replicated the correlation results of table 2 using the full sample of countries to corroborate these results (see table S3.2 in the supplementary online material). The growth of service value added and exports is negatively and significantly correlated with resource dependence. Manufacturing value added growth, on the other hand, has no correlation with any of the resource wealth measures.
There are three plausible explanations for this result. First, developing a modern service sector could require comparatively higher levels of human capital, innovation, and private sector credit, which are likely to be missing in resource-rich countries. Indeed, all of these capabilities have a positive and significant correlation with service growth but are not correlated with manufacturing growth. Second, the service sector could be more prone to the vagaries of volatile commodity prices than manufacturing. If commodity price busts erode short-term growth gains in the services sector, the sector will achieve slower long-run performance. This effect could be compounded by labor reallocation processes that lead to unproductive service sectors in resource-rich economies (Kuralbayeva and Stefanski 2013). Finally, it is possible that manufacturing contains a greater share of resource-related activities compared to services, which could erase its negative relationship with resources. This is less likely since resource dependence does not show a significant correlation with the growth of manufacturing value added or exports, which come from very different data sources. In contrast, the relationship between resources and service growth is consistently negative for value added and export, although these data also come from different sources. The first two explanations are thus more likely to underpin the negative relationship between service sector growth and resource dependence.
As discussed in the measurement section, the baseline measures of resource wealth cover “point source” natural resources that are prone to elite capture and misappropriation (Isham et al. 2005; Boschini, Pettersson, and Roine 2007). Moreover, the non-renewability of natural resources means that weaning dependence on them is a necessity that can be delayed but not avoided, while diversifying away from agriculture might not be either feasible or desirable in many countries that have a comparative advantage in it. However, agricultural commodities and other natural resources share many similarities, including co-movements in their price cycles, which makes it important to check for a potential role of agriculture in the relationship between resources and non-resource growth. Table S3.1 in the supplementary online material replicates table 2 by including two additional measures of resource dependence: the export share of natural resources plus agriculture, and the export share of agriculture. To be consistent with the baseline analysis, both are measured using averages over 1971–1980, using data for agricultural exports from the World Development Indicators database. The augmented measure of resource dependence that includes natural resources and agriculture has no significant correlation with non-resource growth, which is consistent with the baseline analysis. Agriculture, on the other hand, has a positive and significant correlation with the growth of service value added, and service exports, potentially reflecting structural change through agribusiness-related value-adding services. These results suggest that agricultural dependence has a distinct, positive association with non-resource growth, although this effect is swamped by the effect of natural resources when an aggregate measure is used.
Competitive Capabilities for Diversification
This section discusses the performance of resource-rich countries in terms of a few major intermediary and final development outcomes, which we refer to as “competitive capabilities.” We draw the term “competitive capabilities” from the business strategy and development literatures, which emphasize the strategic use of policy and organizational resources to advance competitiveness (e.g., McEvily and Zaheer 1999; Rothaermel 2017). At a macro-level, competitive capabilities constitute policy outcomes that can enhance the value adding ability of an economy and thus advance its competitive advantage (Porter 1990). Such capabilities are consciously built by policy makers to achieve long-term growth and higher levels of prosperity for their citizens by developing productive capacity and designing competitive business environments (Schwab and Sala-i-Martin 2017). We thus see competitive capabilities as the proximate or immediate determinants of private sector performance and competitiveness, and focus on three broad categories as discussed below.
Human capital development. This includes a measure of human development index (HDI), a measure of human capital index (HCI), and tertiary education enrollment rate (TERT). Human capital is considered to be an important driver of economic growth and diversification that enables economic upgrading to greater value adding activities with higher skill requirements (Barro 2001; Bulte, Damania, and Deacon 2005; Stijn 2006).
Public and intellectual capital development. This includes expenditures in research and development as a share of GDP (R&D) to measure investment in fundamental scientific knowledge; patent application rate (PATENT) to measure overall innovation performance, and public infrastructure per capita (INFR) to capture aggregate investments in public service provision. Public infrastructure in the form of roads, railways, ports and public utilities is a fundamental input for economic growth (Bhattacharyya and Collier 2013). Likewise, developing intellectual capital and innovativeness enhances value upgrading and diversification by increasing domestic capacity to create new technologies, or the absorptive capacity to assimilate imported technologies (Schwab and Sala-i-Martin 2017).
Business capacity development. This specifically covers credit access (CREDIT), support for entrepreneurship and small business development (ENTP), and per capita new firm entry (ENTRY) to measure business dynamism. Favorable capabilities in business capacity development support the growth of a dynamic and competitive business ecosystem that facilitates new venture creation and greater productivity growth (Djankov et al. 2002; Claessens 2006; Schwab and Sala-i-Martin 2017). The measurement and data source of each of these indicators is summarized in table S1 in the supplementary online material.
Although some of these measures can be seen as eventual development outcomes in themselves, they can be more generally considered to be competitive capabilities that constitute immediate determinants of economic growth and diversification (Djankov et al. 2002). The advantage of focusing on competitive capabilities is that they are amenable to change through policy interventions, which makes them accessible mechanisms for improving economic diversification. By contrast, fundamental institutional constructs such as democracy that have been the objects of interest in the literature evolve very slowly (Van der Ploeg 2011), and thus are less accessible for policy manipulation (Morrison 2010). Looking into competitive capabilities thus offers an alternative to investigating direct measures of diversification performance (such as non-resource sector growth), which pose more serious methodological and measurement challenges. We choose to cover a broad set of competitive capabilities due to the diverse income level among resource-rich countries, which could lead to varying needs for capabilities to enable diversification.
Resource abundance can undermine the development of competitiveness policies for two reasons. First, resource revenues could undercut the need for implementing potentially painful reforms for boosting competitiveness in the non-resource sector (Bhattacharyya and Hodler 2014). Following resource discoveries, (non) state social groups or business interests that benefit from the resource boom can stand behind the status quo and sabotage reforms, leading to protectionist laws that favor rent-capture but limit the expansion of the non-resource sector and undermine economic diversification (Pritchett, Sen, and Werker 2017). Second, resource revenues could induce adverse political economic effects that directly undermine competitiveness. For example, Williams (2011) shows that resource-dependent countries tend to have less transparent governments, and Brollo et al. (2013) report that increased financial transfers from Brazil's federal government to municipal governments led to greater corruption. Busse and Gröning (2013) find that natural resources led to significantly higher corruption, and some degree of erosion in bureaucratic quality. The combination of reduced policy attention to non-extractive sectors, and the weakening of competitiveness could suffocate non-resource growth.
Is Resource Wealth Correlated with Weaker Competitive Capabilities?
Table 3 reports the correlation between our measures of competitive capabilities and the three measures of resource wealth for the sample of 42 countries that started off as resource rich in the 1970s. The correlations between these three measures and the indicators of human capital development are mixed, suggesting that the relationships are sensitive to the measurement of variables (Stijn 2006). Resource rent per capita, or resource abundance, is positively and significantly correlated with the human development index (HDI), which contradicts the negative relationship between resource intensity and HDI reported in Bulte, Damania, and Deacon (2005). The other export-based measures of resource dependence are significantly and negatively correlated with human capital index (HCI), and tertiary education enrollment rates (TERT), while the GDP-based measure of resource dependence is significantly and negatively correlated with TERT. These correlations appear to support Gylfason (2001), who found that resource dependence is associated with significantly less investment in human capital accumulation.
Correlation between Resource Wealth (1970s) and Competitive Capabilities (1981–2014)
| Resources | Resource rents | Resource rents | |
|---|---|---|---|
| (% of exports) | (% of GDP) | per capita (log) | |
| (1) | (2) | (3) | |
| Human capital development | |||
| 1. Human development index | −0.09 | 0.22 | 0.57 |
| (0.57) | (0.17) | (0.00) | |
| 2. Human capital index | −0.30 | −0.13 | 0.27 |
| (0.06) | (0.43) | (0.11) | |
| 3. Tertiary enrollment rate | −0.37 | −0.29 | 0.02 |
| (0.02) | (0.07) | (0.88) | |
| Public and intellectual capital | |||
| 4. Public capital per capita (log) | 0.25 | 0.52 | 0.73 |
| (0.13) | (0.00) | (0.00) | |
| 5. R&D expenditure (% of GDP) | −0.52 | −0.29 | 0.01 |
| (0.00) | (0.10) | (0.95) | |
| 6. Patent application pc (log) | −0.43 | −0.22 | 0.15 |
| (0.02) | (0.22) | (0.42) | |
| Business capacity development | |||
| 7. Private sector credit (% GDP) | −0.44 | −0.23 | 0.05 |
| (0.00) | (0.16) | (0.74) | |
| 8. Entrepreneurship support | −0.13 | 0.14 | 0.24 |
| (0.48) | (0.47) | (0.20) | |
| 9. Firm entry rate | −0.00 | 0.09 | 0.34 |
| (0.99) | (0.64) | (0.06) | |
Source: Authors’ calculations based on data from multiple sources.Note: Significance levels are given in parentheses. The results in this table and all other tables in this paper are based on the sample of 42 resource-rich countries listed in table S2.
Public capital per person is positively and significantly correlated with the share of resource rents in GDP and resource rents per capita. This conflicts with the negative relationship between resource rents and public investment per capita reported by Bhattacharyya and Collier (2013). The conflicting results potentially reflect the use of panel econometric analysis in their study, or sample differences since their data excludes oil-rich Middle Eastern countries that have relatively high levels of public capital stock. Both measures of resource dependence are significantly and negatively correlated with R&D expenditure, while the export-based measure is also negatively correlated with innovation output. Resource dependent countries thus appear to be investing significantly less on research and development, and consequently achieving less innovation output.
The relationship between resource dependence and measures of business capacity development is rather mixed. Greater resource exports appear to be associated with lower private sector credit access, confirming the findings of Bhattacharyya and Hodler (2014). On the other hand, resource rents per capita are associated with significantly higher new business entry rates. This contradicts Farzanegan (2014) and Majbouri (2016), who found negative relationships between resource rents and entrepreneurship performance. The difference between these studies could be a result of sample composition or model specification since both studies use samples of oil- and gas-producing countries in a dynamic panel set up. While we use broad measures of resources in a sample of resource-rich countries, Farzanegan (2014) focuses on oil rents as a share of GDP in 65 countries, and Majbouri (2016) focuses on oil and gas rents per capital in a sample of 50 countries, including those producing negligible amounts. Table 3 does not reveal any significant correlation between resource wealth and entrepreneurship support, suggesting that the significant correlation with firm entry is more likely an anomaly.
The significance of the correlations between resource dependence and competitive capabilities remain unchanged when we consider an extended measure of resource dependence that includes agricultural exports (see table S4.1 of the supplementary online material). Agricultural exports in itself is not significantly correlated with any measure of competitive capabilities among resource-rich countries, but it is negatively correlated with most measures when the full sample is considered (table S4.2). Across the full sample, therefore, agricultural export dependence is associated with more non-resource growth but reduced competitive capabilities, which is distinct from the relationship found for other natural resource exports. In sum, we conclude that the nature of association between resources and competitive capabilities depends on the way resource wealth is measured and the type of capability considered. More particularly, resource abundance is not negatively correlated with any measures of competitive capabilities, whereas resource dependence is negatively correlated with a number of competitive capabilities.
We now return to our descriptive exercise to see the actual realizations of competitive capabilities across countries. Table 4 reports the average value of competitiveness indicators by country groups, and individual values for the successful diversifiers identified in table 1. The data for the full sample of countries is reported in table S5 in the supplementary online material. We start by comparing the average level of competitive capabilities among the three groups of countries. Average income in extremely resource-rich countries is close to $56,000, whereas average income in highly and moderately resource-rich countries is $9,500 and $35,000, respectively (in PPP prices, see table S2). Given their level of income, we would expect that extremely resource-rich countries (i.e., Group I) would have, on average, the highest levels of competitive capabilities, followed by moderately and highly resource-rich countries (Group III and Group II, respectively).
Competitive Capabilities in Successfully Diversified Resource-rich Economies
| I. Human development | II. Public and intellectual capital | III. Business capacity | |||||||
|---|---|---|---|---|---|---|---|---|---|
| Human | Human | Tertiary | Public | R&D | Patent | Private | Firm | ||
| development | capital | enrollment | capital | expenditure | application | sector credit | Entrep/p | entry | |
| index | index | rate | per capita | (% GDP) | per capita | (% GDP) | support | per capita | |
| (1) | (2) | (3) | (4) | (5) | (6) | (7) | (8) | (9) | |
| Group I: Extremely resource-rich countries (resource share of exports >85%) | |||||||||
| Oman | 0.77 | 1.5 | 47,936 | 0.17 | 33 | 1.2 | |||
| Suriname | 0.70 | 1.4 | 6,526 | 26 | 2.4 | 1.0 | |||
| Nigeria | 0.49 | 1.4 | 0.9 | 2,976 | 0.21 | 5 | 15 | 2.1 | 0.7 |
| Saudi Arabia | 0.76 | 2.2 | 3.1 | 43,890 | 0.06 | 39 | 27 | 2.3 | 0.4 |
| Average | 0.69 | 2.1 | 2.4 | 34,671 | 0.26 | 71 | 32 | 2.4 | 3.2 |
| Group II: Highly resource-rich countries (resource share of exports 51%–85%) | |||||||||
| Laos | 0.49 | 1.6 | 1.2 | 1,680 | 0.04 | 8 | 0.2 | ||
| Indonesia | 0.61 | 2.1 | 2.0 | 2,259 | 0.09 | 16 | 31 | 2.7 | 0.3 |
| Peru | 0.68 | 2.4 | 5.0 | 3,426 | 0.12 | 28 | 20 | 2.2 | 3.3 |
| Chile | 0.78 | 2.8 | 5.1 | 2,808 | 0.37 | 131 | 72 | 2.5 | 5.4 |
| Average | 0.51 | 1.8 | 1.8 | 2,287 | 0.17 | 28 | 19 | 2.3 | 1.0 |
| Group III: Moderately resource-rich countries (resource share of exports 25%–50%) | |||||||||
| Egypt | 0.62 | 1.9 | 4.0 | 2,882 | 0.38 | 19 | 36 | 1.9 | |
| Malaysia | 0.73 | 2.5 | 3.0 | 13,007 | 0.87 | 195 | 108 | 2.9 | 2.3 |
| Tunisia | 0.66 | 1.8 | 2.8 | 8,011 | 0.63 | 31 | 64 | 2.7 | 1.4 |
| Norway | 0.91 | 3.3 | 5.8 | 27,378 | 1.21 | 1076 | 82 | 2.6 | 7.0 |
| Average | 0.68 | 2.4 | 3.7 | 9,942 | 0.67 | 273 | 54 | 2.4 | 2.5 |
| Grand average | 0.64 | 2.1 | 2.7 | 16,814 | 0.40 | 135 | 35 | 2.4 | 2.5 |
Source: Authors’ calculations based on data from multiple sources.Note: The average of each of the groups is for the whole group, not just the best performers listed on this table. Table S1 in the supplementary online material discusses the measurement of all variables, and detailed values per country are reported in table S5.
However, table 4 reveals that extremely resource-rich countries are no better than moderately resource-rich countries in terms of the three measures of human capital development. In fact, they perform worse in terms of average tertiary enrollment rates (2.4 vs. 3.7), reflecting the negative correlations between human capital and resources reported in table 2. Likewise, extremely resource-rich countries fare much worse than moderately resource-rich countries in terms of R&D expenditure, patent application, and private sector credit; the only two capabilities in which they register better performance are public capital and firm entry rate. While extremely resource-rich countries have significantly higher income levels and public capital, they either lag behind or fail to excel in most measures of competitive capabilities.5 Notably high-income level that is not accompanied by competitiveness capabilities is unique to the extremely resource-rich countries. For example, comparisons between the average levels of competitive capabilities between highly and moderately resource-rich countries (i.e., between Group II and Group III) reveals that the latter have consistently higher competitive capabilities in all areas, which is in line with their higher income levels. Thus, extreme resource wealth appears to raise GDP per capita without the development of competitive capabilities that are essential for sustaining non-resource growth, a result consistent with Dutch Disease resulting in high incomes but low productivity in non-tradable sectors.
Do Successful Diversifiers have Greater Competitive Capabilities?
We now compare the competitive capabilities of the successful diversifiers listed in table 4 with their peer countries in order to assess whether diversification success is associated with greater competitive capabilities. Figure 1 plots competitive capabilities against GDP per capita to assist in these comparisons. Among the best diversifiers in Group I, Nigeria stands out for its low levels of competitive capabilities, which may reflect its significantly lower income level relative to the other successful diversifiers (Oman, Suriname, and Saudi Arabia). However, all of the four successful diversifiers have HDI levels that are below what would be predicted from their income level. Data for human capital (HCI) is available only for Nigeria and Saudi Arabia, and their performance too is far below the line of prediction. The more complete data for tertiary education enrollment rate (TERT) confirms that the four diversifiers perform far worse than what their income would predict. Saudi Arabia has the highest tertiary enrollment rate among successful diversifiers in this group (3.1), but its performance compared to its income peers is only half as large (5.8 in Norway and 6.5 in Australia). In this group, therefore, it does not appear that non-resource growth has been accompanied by human capital accumulation.
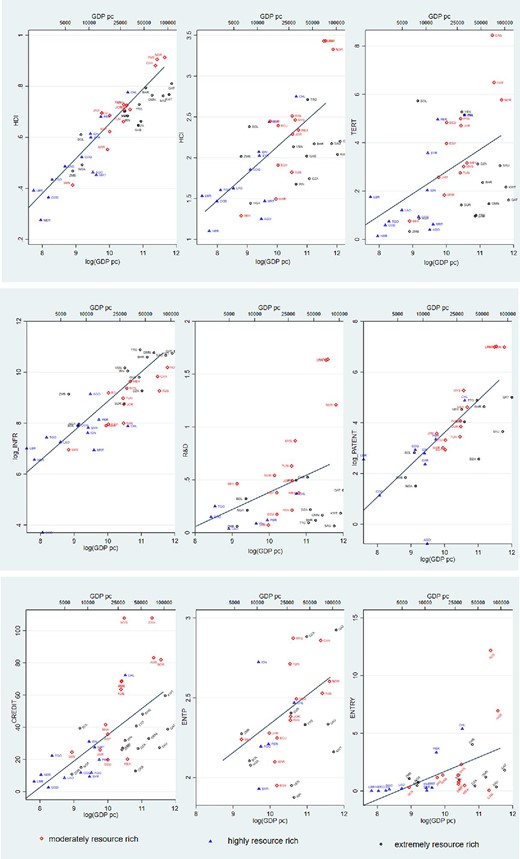
Scatter Plot and Linear Regression Fit of Competitive Capabilities against GDP per Capita
Source: Authors’ calculations based on data from multiple sources.Note: Extremely resource-rich countries are represented by black hollow circles, highly resource-rich countries by blue triangles, and moderately resource-rich countries by red diamonds. GDP per capita is calculated as total GDP in PPP per working population.
The same observation transpires when we consider intellectual capital since none of the best diversifiers have better R&D expenditure and patent application rates than their peers. The two best diversifiers for which we have R&D and patent data, Nigeria and Saudi Arabia, perform far worse than what we would predict from their levels of income (figure 1, middle panel). Manufacturing growth in these countries, therefore, could not have been in knowledge-intensive, high-tech industries. Public capital accumulation is an exception, since Oman and Saudi Arabia have significantly higher public capital stock per person than their peers. All of the best diversifiers except Suriname also have public capital levels higher than would be predicted from their income levels. In terms of the three indicators of business capacity development, the best diversifying countries in Group I are again lagging behind the group average, as well as from what we would predict given their income. A good example is firm entry rate, which is less than 1.2 per 1,000 individuals in all successful diversifiers, which is far lower than the average of 2.5 per 1,000 across the full sample. We thus conclude that greater diversification performance in extremely resource-rich countries is not accompanied by improvements in competitive capabilities in terms human and intellectual capital, as well as business capacity development.
Among the best diversifiers in Group II, Laos stands out for lagging behind the other countries. This should not be surprising considering that its average per capita GDP at the time was only one-half the level of Indonesia's, one-third of Peru's, and nearly one-sixth of Chile's. On the other hand, Chile has consistently higher levels of competitive capabilities than its peers—the only country to do so among successful diversifiers in Group I and Group II. Although Chile's strong performance is in part due to its relatively high level of GDP per capita, it outperforms countries with similar income levels in all measures of human capital development, and two measures of business capacity development (i.e., CREDIT & ENTRY). Chile performs at least as well as its income peers in other areas except in terms of public capital and R&D expenditure. The country's relatively consistent above-average performance in competitive capabilities suggests the presence of systematic policy efforts to enhance economic competitiveness. Peru closely follows Chile, performing better than its income level would predict for all measures of human capital, although it lags behind in terms of business capacity development (particularly CREDIT & ENTP), R&D expenditure, and physical infrastructure. The performance of Indonesia is more mixed, with a slightly better than average human development index, financial access, and entrepreneurship support, but lower than average R&D expenditure, patent application, and firm entry rate. Compared to highly resource-rich countries, countries in Group II thus exhibit more varied levels of competitive capabilities, ranging from very high (Chile), decent (Peru), mixed (Indonesia), to low (Laos).
Among the successful diversifiers in Group III, Norway stands out for having the highest levels of competitive capabilities. Norway, along with other high-income countries (Canada and Australia) have higher levels of competitive capabilities for their income levels in almost all areas (two minor exceptions are public capital and entrepreneurship support, see figure 1). Among the remaining three successful diversifiers, Malaysia has consistently high competitive capabilities compared to its peers. Malaysia has exceptionally high levels of financial access (108%), R&D expenditure, and entrepreneurship support for its income level, and has also decent levels of human development index. Entrepreneurship support in Malaysia is higher than in Norway (2.9 vs. 2.6) although entry rates are smaller than the group average. Egypt and Tunisia lag behind their peers in most measures of competitive capabilities with a few exceptions (e.g., above-average tertiary enrollment rate of 4% in Egypt, and also relatively higher financial access of 64% in Tunisia).
To conclude, these results suggest that some successful diversifiers have better competitive capabilities that seem to have underpinned their success, while this is not the case for many others. Very few of the successful diversifiers have uniformly high competitive capabilities. Among successful diversifiers, Chile, Norway, and Malaysia have relatively better competitive capabilities in most areas. Diversification is not associated with greater competitive capabilities in extremely resource-rich countries. Although these countries have very high income and well-developed public infrastructure, their competitive capabilities are below the sample average, and far lower than their income predicts. The decoupling between competitive capabilities and non-resource growth in these countries suggests that diversification might have resulted from other processes, such as state-owned enterprises or the use of imported technologies.
Case Studies of Successful Diversifiers
This section details the process of economic transformation in three countries that registered the fastest per capita manufacturing value added growth: Oman (10.9%), Laos (9.3%), and Indonesia (8.6%). The contribution of resources to export revenues in Oman, Laos, and Indonesia in the 1970s was 95%, 76%, and 67%, respectively (table S2). The three cases thus cover countries from moderate to extremely high levels of resource dependence. In each case study, we examine the drivers of economic diversification as well as the potential role (or not) of competitive capabilities in human, public, and intellectual capital, and business capacity development.
Oman
Oman is a small country in the Arabian Peninsula with a total population of 4.5 million as of 2017. Only 55% of the population (2.5 million) was composed of Omanis, the remaining 2 million being immigrant “guest” workers. As an absolute sultanate (monarchy), Oman has no independent parties that run for elections. Oman's GDP per person as of 2010 was $45,334 in parity prices ($14,000 in nominal prices), which is the fourth highest in the region after Qatar ($125,140), Kuwait ($75,200), and UAE ($57,600; all in parity prices). Since the start of petroleum extraction in 1967, Oman's economy has been dominated by resource export revenues. Oil and gas production per capita is one of the highest in the region but does not reach the levels of Qatar, UAE, Saudi Arabia, or Kuwait (figure S1), which has created a sharper policy focus towards diversification. Oman is not a member of OPEC, which gives it greater freedom to adjust its own production in response to market conditions. Petroleum Development Oman (PDO), which is owned by the government (60%) and foreign interests (mainly Shell), has been in charge of extraction activities since 1967. Gas production started in 2000, which is also evident from the export revenues in figure S4.
At the start of oil production in 1967, all oil revenues went directly to government accounts. With the explosion of oil revenues during 1978–81, the government decided to put aside parts of resource revenues into a sovereign wealth fund, which led to the establishment of the State General Reserve Fund (SGRF) in 1980. Although the proportion of gross public oil revenues flowing into the reserve fund was initially quite high, reaching 24.3% in 1981, it subsequently declined in the late 1980s due to increasing withdrawals to finance a government deficit. To limit the decline of the SGRF, a new Contingency Fund was established in 1991 to specifically finance public sector deficits from accumulated oil revenues. Another financial vehicle called the Oman Investment Fund was established in 2006 to invest oil revenues on domestic and international assets including private equity, real estate, infrastructure, and equities.
Oman has undergone large-scale infrastructural development and a massive expansion of health, educational, and other governmental services through a successive of development plans in the 1970s and 1980s, which were financed by public revenues from oil production (World Bank 1994). This is also apparent in our data, where its level of public capital is slightly higher than its peer countries in terms of income. The country started as a predominantly agricultural country in the 1960s, and became increasingly oil dependent in the 1970s. Natural resources contributed to an average of 95% of export revenues in the 1970s, which has remained more or less unchanged to this day (figure S4). Figure S3 reveals that the service sector became more important during the oil glut of the 1980s, contributing more to the economy than oil and gas until the most recent oil boom that started around 2000.
Since the 2000s, manufacturing witnessed significant expansion from a very low base. Nominal manufacturing value added increased 80-fold from $69.5 million in 1981 to $5.6 billion in 2014—an annual growth rate of about 14%. The sector's contribution to GDP, however, remained less than 10%, which is the same level as in developing countries in Sub-Saharan Africa. The continued dominance of resource-based manufactured exports (see figure S4) suggests that processed petroleum and gas products constituted an important part of this growth. Oman has not succeeded in improving its competitiveness capabilities as it performs far worse than its peers, with the exception of HDI and public capital, where its performance is slightly higher than its income would predict (figure 1). The country particularly lags far behind its income peers in tertiary education enrollment, R&D expenditure, credit access, and new firm entry rates, all of which are crucial for enabling diversification in a high-income country like Oman.
The lack of diversification and the excessive fiscal dependence on oil revenues has put Oman at the mercy of oil prices. Following the oil price decline that started in 2014, oil receipts covered only 70% of government revenues, leading to a fiscal deficit of 16.5% of GDP in 2015 and 20.3% of GDP in 2016 (World Bank 2017). Although the country has accumulated estimated resource revenue savings of $38 billion, the World Bank predicts that the public debt will rise significantly to over 50% of GDP by 2020 from just 5% in 2014. As a response, in 2016 the government initiated a national diversification program called “Tanfeedh” to increase the share of the local work force and reduce unemployment rates. ILO data shows that Oman faces a high unemployment rate of about 20%, while unemployment among the youth has reached 50% (World Bank 2017)—a pressing problem in a country where about 40% of the population is younger than 25. The country's diversification program seeks to address this by increasing private sector participation, focusing on logistics, manufacturing, and tourism. However, Omanis appear to prefer public-sector jobs where the pay is higher, working hours are shorter, and tenures more stable, sometimes waiting for as long as three years to get a public sector job (World Bank 2017). Diversification efforts also include unpopular policies such as the removal of electricity subsidies and an increase in the corporate tax rate from 12% to 15%, which took place in 2017, and a levy of 5% VAT, which is scheduled for 2021.
Laos
The Lao People's Democratic Republic is a landlocked country of 6.8 million inhabitants (2016) in Southeast Asia, bordered by Myanmar, China, Vietnam, Cambodia, and Thailand. Its income per person is $7,900 in parity prices and $2,700 in nominal terms (both 2018 estimates). Laos is a one-party socialist republic, having been ruled by the Lao People's Revolutionary Party since 1975. The country has followed an ambitious growth strategy that exploits its strategic location straddling large countries such as Thailand, Vietnam, and China. These fast-growing economies also provide an important market for the country's extractive sectors that produce raw materials like metal ores and wood products.
After a decade of socialist policies, the country introduced a new policy framework in the mid-1980s, which resulted in the gradual opening of the economy. The government lifted price controls, unified exchange rates, opened the country to foreign trade and investment, and allowed for private agriculture and manufacturing. Laos has also actively pursued regional economic integration in South East Asia, having joined the ASEAN Free Trade Area in 1997 and the WTO in 2013. As shown in figure S6 in the supplementary online material, natural resources had a greater contribution to exports in the 1970s, which fell significantly in the 1980s before rising again after the 1990s. Hydro power exports to Thailand, Vietnam, Cambodia, China, and Myanmar contributed to 30% of the country's export revenues in 2016. By 2010, mining (mainly copper ore) contributed slightly less than half of export revenues, and textiles and construction equipment contributed to about 40% of export revenues, the balance being covered by agricultural and timber products.
Laos’ economy grew rapidly from a low base since the 1990s. This rapid growth has been driven by FDI and regional integration, heavy government investment, and increasing exploitation of the country's resource wealth. During 2003–2013, for example, GDP more than doubled and employment increased by 20% (around 500,000 jobs) bringing total employment to about 3.1 million (World Bank 2016). The share of agriculture declined significantly, which was accompanied by an expansion of services and industrial sectors (figure S5). Agriculture, however, continued to employ 64% of the population in 2013, which was a significant decline from 73% a decade earlier (World Bank 2016). Natural resources and manufacturing each make a small contribution of about 10 percentage points to GDP. The contribution of mining picked up only after 2003, following a hike of FDI to exploit reserves of gold, copper, and zinc.
Laos’ manufacturing sector now attracts significant FDI, which is enticed by low labor costs, political stability, and a cheap energy supply. Most of the FDI originates from neighboring countries, and ends up in one of the country's 10 special industry zones (World Bank 2016). Increasingly, however, Laos has been able to attract a number of multinational companies, including Nikon, Essilor, Toyota, Mitsubishi, and Polycom, which resulted in rapid growth in the assembly and equipment parts sectors. The export of equipment parts (such as camera parts) has emerged and increased from a low base in 2013 to about $300 million in 2015. While production relies on imported intermediate inputs to a significant degree, the growth of the sector points to the potential of Laos to effectively participate in regional and global value chains. Laos’ competitive capabilities in terms of intellectual capital and business capacity development is low even for its level of income (figure 1), reflecting that diversification has been fueled by imported capital and technology. Further diversification into more sophisticated sectors with the help of a home-grown non-resource sector, however, will require significant improvements in the country's competitive capabilities.
Indonesia
Indonesia's economy is the fourth largest in east Asia after China, Japan, and South Korea. Average GDP per capita for 2017 is estimated at $13,120 in parity prices, and $4,100 in nominal prices. Being the fourth most populous country in the world (261 million), Indonesia has a sizeable GDP and is a member of the G20 club of countries. After full independence from The Netherlands in 1949, Indonesia went through the authoritarian regimes of Sukarno (1945–1967) and Suharto (1968–1998) before adopting a democratic system of government in 1998. Suharto is credited for masterminding Indonesia's economic rise (Temple 2003), but was forced out of office following the Asian financial crisis in 1997. The financial crisis triggered an exodus of capital from Indonesia, and led to a fall of GDP by 13%, exposing significant corruption and lax regulation in the country's financial systems (Temple 2003).
Indonesia's natural resource endowments are diverse, with oil and gas constituting approximately 40% of resource revenues (Elias and Noone 2011). Oil and gas development is implemented by a state-owned enterprise (Pertamina) as well as by multinational companies. Unlike Malaysia's Petronas, which has succeeded in becoming a competitive and global energy company, Pertamina has suffered from long-standing mismanagement and corruption. Domestic energy consumption has continued to rise while production has been falling, making Indonesia a net energy importer since the early 2000s. Other commodities in which Indonesia is a major global producer include tin (27% of global extraction in 2009), nickel (15% of global extraction in 2009), copper (6% of global production in 2009), and coal (4% of global production in 2010) (Elias and Noone 2011). In spite of this, the contribution of natural resources to GDP is less than 10% in recent years.
The Indonesian government initiated broad-based reforms in the 1980s in response to the collapse of oil prices. Major policy changes included a banking sector reform to ease entry barriers and remove credit subsidies; outsourcing the inefficient customs office; and a gradual reduction of import tariffs and dismantlement of non-tariff trade barriers (Temple 2003). These changes triggered a dramatic increase in the growth of manufacturing exports and a marked improvement in the TFP performance of the manufacturing sector (Temple 2003). Between 1983 and 1992, the share of manufactures in merchandise exports rose from 7% to 50%, although this could also be related to the reversal of the Dutch Disease due to the decline of oil prices. The state played an active developmental role by channeling oil revenues towards social projects (agriculture, education, and infrastructure), and by supporting the development of capital-intensive industries (Temple 2003). By 1996, Indonesia's poverty rate had dropped to around 11% from 45% in 1970, and life expectancy increased by nearly 20 years in the same period. Real GDP increased six-fold in the period 1981–2015, with the contribution of manufacturing rising significantly. Similarly, the share of the population living in urban areas increased from 17% to 53% over this period.
Services and industry sectors as well as manufacturing play an increasing role in Indonesia's economy, while agriculture and resource-related activities are declining (see figure S7). Figure S8 corroborates that resource-based exports are declining but still important, while increasing diversification is apparent from the expansion of the “other” export category. Although manufacturing is on a declining trend from its peak before the 1997 Asian financial crisis (27% of GDP and 60% exports), Indonesia remains one of the most manufacturing-intensive resource-rich countries. Compared to the rest of the region, Indonesia's manufacturing has focused on food, tobacco, and textiles rather than elaborately transformed manufactured goods (Elias and Noone 2011). The country's relative diversification success, therefore, seems to be driven by exploiting the “low-hanging fruit” of its comparative advantage in light manufacturing and agribusiness (Gelb 2010). This also explains why Indonesia's performance in terms of various competitiveness capabilities are for the most part modest for its income level (figure 1).
Summary
The case studies have revealed a number of insights into economic diversification success in resource-rich countries. First, the results indicate the structural challenges that extremely resource-rich countries face in extracting themselves from resource dependence. The example of Oman shows that high growth rates that appear to indicate successful diversification do not necessarily imply a significant change in the economic structure of a country that started as extremely resource dependent. Manufacturing and other non-resource sectors have been lagging so far behind the resource-based economy that, even after growing at double-digit rates for decades, their contribution to GDP remains limited. As a result, Oman's economy remains at the mercy of oil price shocks.
Second, the results suggest a decoupling between relative diversification performance on the one hand and the development of competitive capabilities on the other. This decoupling is particularly stark in extremely resource endowed countries like Oman that were able to achieve comparatively faster diversification without building their competitive capabilities. By comparison, diversification performance appears to be more successful in countries where resources have moderate economic importance and are also diverse, especially in Indonesia and to some extent in Laos. Yet success in Laos came in part from enclaving competitiveness in special economic zones.
Third, external market conditions have often been used to initiate diversification in resource-rich countries. In Laos, the economic rise of neighboring countries provided opportunities for regional integration, which increased non-traditional income sources such as hydro-power exports, as well as a window of opportunity for attracting FDI. In Indonesia, plummeting oil prices in the 1980s provided an opportunity for economic reforms that ignited growth in the non-resource sector. Whereas Indonesia had a domestic economy with sufficient demand to enable the development of a domestic manufacturing base, Laos relied on regional and international markets for its manufacturing production.
Conclusion
The imperative for economic diversification in resource-rich countries remains strong, given highly volatile commodity prices and the low employment potential of extractive sectors. The International Monetary Fund, for example, calls for “greater economic diversification [which] would unlock job-creating growth, [and] increase resilience to oil price volatility” (IMF 2016). Achieving diversification, however, remains a major challenge (Diop, Marotta, and de Melo 2012), and the academic literature offers little guidance on the issue (Ross 2017). This study has sought to bridge this gap by providing a rich account of the patterns of diversification, and their policy correlates, in resource-rich economies. In our sample of 42 countries, which were the most resource dependent in the 1970s, we fail to identify negative relationships between various measures of resource wealth and non-resource sectoral growth. When all countries are considered, we find a negative correlation between resource dependence and the growth of service value added and exports. These results cannot be causally interpreted considering various measurement and identification challenges.
The paper subsequently identified the best performing resource-rich countries based on their manufacturing value added growth. We characterized their performance in terms of a broad range of competitive capabilities, more specifically covering human capital attainment, public and intellectual capital development, and business capacity development. Through in-depth investigation of the most successful diversifier countries in our sample, namely Oman, Laos, and Indonesia, we examined the potential mechanism between developing competitive capabilities and achieving economic diversification.
Improvements in diversification were not often accompanied by stronger competitive capabilities, especially among extremely resource-rich countries. Among other relatively successful diversifiers, Chile and Norway, and to some extent Malaysia, have improved their competitive capabilities in most areas. The case study of Oman showed that true diversification remains elusive for one extremely resource-dependent, oil-producing country. In spite of the rapid expansion of manufacturing from a small base, which grew at the fastest rate in our sample, the country remains heavily dependent on oil revenues, and manufacturing (including processed oil, gas, and minerals) contributes merely 10% of GDP.
Finally, the relationship between resource wealth and competitive capabilities depends on the way resource wealth is measured and the type of capability considered. In our subsample of resource-rich countries, resource dependence exhibits a negative correlation with a number of competitive capabilities (i.e., certain measures of human capital attainment, R&D expenditure, innovation output, and financial access), while resource abundance is positively correlated with some competitive capabilities. These results are correlational and thus only suggestive, but are in line with prior evidence that the way resource wealth is measured affects research findings in important ways (Brunnschweiler and Bulte 2008; Alexeev and Conrad 2009; Smith 2015).
Given the attention paid to diversification as a policy priority for resource-dependent countries (Gelb 2010; Diop, Marotta, and de Melo 2012), the results point to the need for further research. First, the exceptional diversification challenge in extremely resource-dependent countries suggests a potentially non-monotonic relationship between resource dependence and structural transformation. A potential alternative explanation is that petroleum-producing countries, which dominate the extremely resource-dependent group of countries, face a more serious diversification challenge either because of the difficulty to create backward and forward linkages (Hausmann and Klinger 2006) or because of unique rent appropriation dynamics (cf. Ross 2015). In contrast, our descriptive results suggest that mineral-rich countries, especially those endowed with diverse resources such as Indonesia, Laos, and Malaysia, were comparatively more successful in building their capabilities and/or achieving diversification. Future research can explore possible explanations such as the mitigation of commodity price risks in countries with diversified resource portfolios and the potential role of growth-friendly rent appropriation dynamics in countries with diverse or moderate levels of resource wealth. Second, while manufacturing and service growth can provide a complementary measure of economic diversification that better approximates welfare gains than product mix per se, it nonetheless suffers from certain data limitations. Since these measures could also capture natural resource-driven activities like petroleum refining, there is a need for further research with more disaggregated measures. Finally, the lack of a clear association between most measures of competitive capabilities and non-resource growth invites further inquiry into the conditions under which competitive capabilities become important drivers of (non-resource) growth.
Notes
Addisu Lashitew is research fellow at the Global Economy and Development program of Brookings Institution, and can be reached at alashitew@brookings.edu. Michael Ross is a professor at the Department of Political Science, University of California Los Angeles, and can be reached at mlross@polisci.ucla.edu. Eric Werker (corresponding author) is a professor at the Beedie School of Business, Simon Fraser University, and can be reached at ewerker@sfu.ca. This work was supported by a research grant from UK’s Department for International Development (DFID) through the Effective States and Inclusive Development (ESID) research center, which is led by the University of Manchester (Grant Number PO5013). A supplementary online appendix is available with this article at The World Bank Research Observer website.
Footnotes
The IMF classifies countries as resource-rich when they generate at least 20% of their merchandise exports or government revenues from oil, gas, or minerals. Using data for 2006–2010, the International Monetary Fund (IMF; 2012) identified 51 resource-dependent countries, home to 1.4 billion people. Venables (2016) uses a subset of 29 low and lower-middle income countries from the IMF list for his analysis.
This list excludes countries with a population of less than half a million, namely: Antigua and Barbuda, The Bahamas, Bermuda, Brunei Darussalam, Cayman Islands, Greenland, New Caledonia, and Virgin Islands. These countries have peculiar economic structures as a result of being small islands (leading to major tourism and fisheries sectors), and in many cases because they are tax havens. Guyana, Libya, and Papua New Guinea were also excluded from our analysis because of lack of data for non-resource sectors, although they qualified as resource-rich according to our criterion.
Although we did not have resource export data for Botswana and Iraq in the 1970s, we followed IMF (2012) and classified them as highly and extremely resource-rich countries, respectively, based on their export resource dependence in subsequent years.
To our knowledge, the only exception is James (2015), who finds that the growth rate of the non-resource sector (manufacturing and services) closely follows the growth of total GDP, which in turn appears to move in tandem with commodity price cycles.
Average income per capita and infrastructure capital stock per capita (both in log form) have a very high and significant correlation (coefficient = 0.85).
