


Abstract
In the past decade, an international consensus on the value of well-functioning systems has driven considerable health systems research. This research falls into two broad categories. The first provides conceptual frameworks that take complex healthcare systems and create simplified constructs of interactions and functions. The second focuses on granular inputs and outputs. This paper presents a novel translational mapping tool – the University of California, San Francisco mapping tool (the Tool) - which bridges the gap between these two areas of research, creating a platform for multi-country comparative analysis.
Using the Murray-Frenk framework, we create a macro-level representation of a country's structure, focusing on how it finances and delivers healthcare. The map visually depicts the fundamental policy questions in healthcare system design: funding sources and amount spent through each source, purchasers, populations covered, provider categories; and the relationship between these entities.
We use the Tool to provide a macro-level comparative analysis of the structure of India's and Thailand's healthcare systems.
As part of the systems strengthening arsenal, the Tool can stimulate debate about the merits and consequences of different healthcare systems structural designs, using a common framework that fosters multi-country comparative analyses.
Introduction
Since the publication of the World Health Report (WHR) 2000, the importance of strong and resilient health systems has gained prominence in global health discourse.1,2 Yet, the vulnerability of fragile health systems continues to echo through persistent global health challenges, such as the stress-test of the Ebola crisis.3 Health systems strengthening in low and middle-income countries remains a global priority in achieving the health-related Sustainable Development Goals (SDGs), particularly in the call for universal health coverage.4,5
An international consensus on the value of well-functioning health systems has driven much-needed attention and some resources towards health systems policy research.6 Shakarishvili and colleagues classify this research into three broad categories.7 The first includes descriptive frameworks focused on various components of health systems such as care delivery, provider payment mechanisms or regulatory structures. The second includes deterministic and predictive frameworks including actuarial or economic modeling. The final category takes a broader view to create analytical frameworks that describe health systems functions and their complex interactions. A gap in the literature exists, however, in translating these broad analytical frameworks into practical diagrams of the health system as a whole.7 In this paper we present a novel translational mapping tool that provides a macro-level visual representation of a country's healthcare financing and provision structure to enable clearer understanding of key policy choices, and offer a platform for multi-country comparative analyses. The University of California, San Francisco (UCSF) Healthcare Systems Mapping Tool (the Tool) provides another step in the ‘concept-to-action roadmap’7 for health systems strengthening.
We initially published an early version of this tool in Cross Border Health Insurance: An Overview.8 Policymakers found it useful to better understand their national health systems, and for cross-country comparisons.9–20 In this paper we present for the first time, an advanced and updated version of the Tool, explain the methodology behind its development, and highlight the key policy questions it can be used to address. We conclude with an example of how to apply the Tool to compare the healthcare structure, organization, and high-level policy decisions made by two countries in Asia: India and Thailand.
Materials and methods
The UCSF Healthcare Systems Mapping Tool
The WHR 2000 defines the healthcare system as the ‘…provision of, and investment in, health services…whether directed to individuals or to populations.’2 While acknowledging the enormous contribution of population health activities to health outcomes, the Tool concentrates on the macro-level structure for financing and delivering personal rather than non-personal or population health services. This domain accounts for the largest portion of healthcare expenditures and is significantly influenced by public policy choices.21
The Tool is based on the Murray and Frenk health systems framework.22 We focus specifically on two of the four functions described in the framework – financing and provision – which are highlighted in Figure 1. We recognize that stewardship and resource generation (the two other functions in Murray and Frenk's framework), are essential to well-functioning health systems and provide the foundation for financing and delivery of healthcare. We find that policy decisions on the design of financing and provision are often the most politically contested when charting a path towards universal health coverage, and are a key focus of policymakers in any health systems reform.
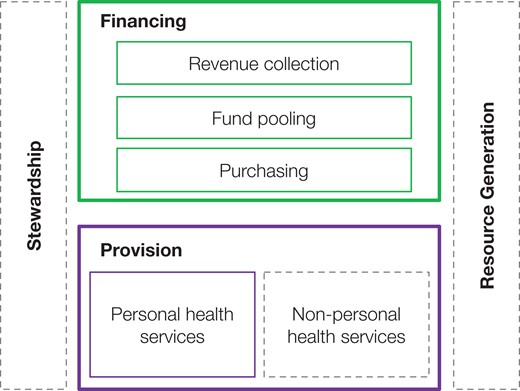
Murray and Frenk framework for health systems organization and functions.22 Complete health systems perform the functions of financing, provision, stewardship, and resource generation. Figure reproduced with permission of the Bulletin of the World Health Organization.
The Tool provides a country-level perspective and highlights the high-level policy choices that governments implicitly or explicitly make when deciding how they finance and deliver healthcare. It is designed to visually represent the foundational questions of any healthcare system structure: What are the funding sources? Who are the purchasers? What populations are covered? Who are the providers? And how are these entities related? The Tool does not attempt to depict all the factors that influence the performance of a healthcare system. Several factors that may be equally or more important, such as quality of care, are external to the structures represented in the healthcare system map generated by the Tool.
Figure 2 presents the general structure of the Tool. Health system entities fall along the horizontal x-axis. The vertical y-axis represents the functions of these entities.
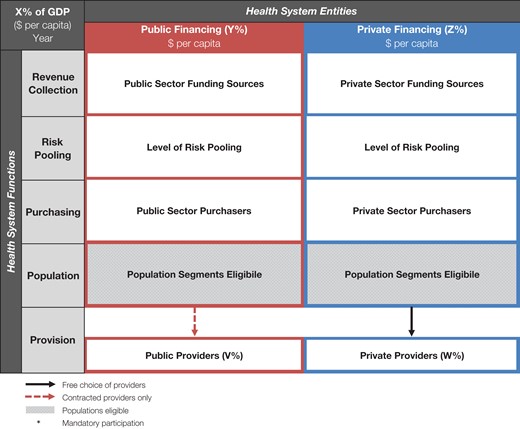
Basic structure of University of California, San Francisco (UCSF) Healthcare Systems Mapping Tool. Health system entities fall along the horizontal axis. The vertical axis represents the functions of these entities. Gray shading shows the populations eligible. X, Y, Z, V, and W should be filled in with the relevant numbers for the country. For ease of comparison between countries, we use US$. GDP: gross domestic product.
The entities on the horizontal axis are categorized as either public (or publically mandated) or private. We classify public entities as those under the direct control of the government or quasi-government agencies and private entities as those outside of government control.23 These two categories are differentiated by color in the map: red represents a public entity and blue, private. The color distinctions are carried throughout the map. The extent of public and private funding in the healthcare system overall is shown visually by the relative width of the header row under financing. This is based on the percentage of total healthcare spending in the country attributed to public vs private funding sources using WHO National Health Accounts definitions.24 The map also includes health expenditures by source.
The vertical axis represents the functions of the entities. This structural skeleton follows the broad conceptual model outlined by Murray and Frenk22 and includes revenue collection, risk pooling, purchasing, populations served, and provision.
The first row in the map identifies revenue collection mechanisms. These are defined as the mobilization of resources from households, businesses, and external sources.22 These include public sources such as general taxation, social health insurance, and external (donor) funding; and private sources such as private health insurance (including community health insurance), and out-of-pocket spending (OOPS).24
The second row indicates the level at which risk pooling occurs. Risk pooling is defined as ‘…the accumulation of revenues for the common advantage of participants’,22 with all those participating sharing financial risk for the costs of care.
The third row depicts the purchasing entities within the system. Purchasing is defined as the process of spending funds to pay providers for delivery of health services.22 Entities responsible for purchasing include public institutions such as government agencies and publically funded coverage schemes, and private ones such as insurers, or households.
The next row shows the populations who are beneficiaries of each of the schemes or purchasers. These various groups can include formal or informal sector workers, the elderly, low-income persons and dependents, the disabled, or civil servants. Populations are listed based on eligibility rather than actual use patterns.
Provision at the final level is defined as the delivery of healthcare services by institutions and practitioners.22 These groups include hospitals and clinics in the public sector and private providers such as faith-based organizations, non-governmental organizations, and private-for-profit entities.25 There are also a myriad of informal providers in the private sector such as traditional healers and drug vendors. If data are available, the percentage of care delivered by public vs private providers can be included. However, in many countries public providers also practice in the private sector resulting in considerable overlap between these two sectors. Because of its macro-level focus, the map as we present it, does not include the organization of health services delivery or the relationship between different levels of care or the governance structures of hospitals and clinics. Sub-system maps can be created to diagram this level of detail using the Tool.
Relationships
Relationships between key structures, actors and mechanisms of the healthcare system can be understood by reading the map vertically. For example, in Figure 3, general taxes pay for services for the general population including the poor, elderly, disabled and informal workers; while social health insurance, financed by employer/employee taxes, covers only those in the formal sector.
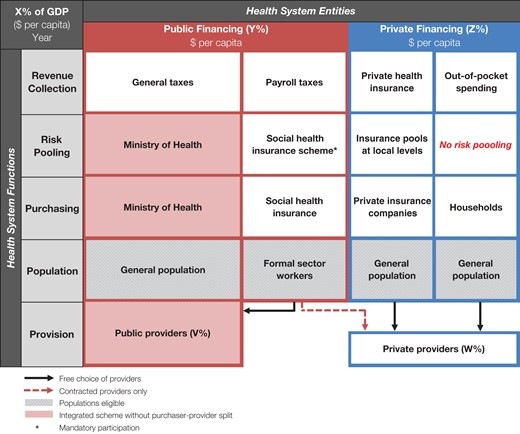
Example of the University of California, San Francisco (UCSF) Healthcare Systems Mapping Tool. A generalized application of the Tool where vertical integration is indicated by light red shading. Gray shading shows the populations eligible. Health system entities fall along the horizontal axis. The vertical axis represents the functions of these entities. X, Y, Z, V, and W should be filled in with the relevant numbers for the country. For ease of comparison between countries, we use US$. GDP: gross domestic product.
We define vertical integration in the healthcare system as occurring when purchasing and provision are performed by the same entity.22 Vertical integration is indicated in the map through shading these entities (Figure 3). A common example of vertical integration is when general taxes allocated to a ministry of health flow through internal budgets to hospitals and clinics operated by that ministry. The opposite of this is a purchaser–provider split where the purchaser of care, such as a social insurance program, is organizationally separate from the providers of care.26
More detailed coverage eligibility is indicated in the map with the use of arrows. Black arrows connect populations to providers from whom they are eligible to receive healthcare. Red dashed arrows connect populations to contracted providers. As depicted in Figure 3, formal sector workers who are funded through the social health insurance scheme are eligible to receive care from both public providers and contracted private providers. We use asterisks to denote if participation in a scheme is mandatory. In Figure 3 this is only true for the social health insurance scheme.
Additional complexities in healthcare system structures
For some countries, parastatals provide a notable share of healthcare services. Parastatals are defined here as organizations controlled fully or partially by a government entity. They often operate their own healthcare facilities, generally for the benefit of employees, dependents, and retirees. Typical parastatals include railways and state-owned oil, gas or telecommunications firms. Parastatals in the map are shown as vertically integrated when they function as both purchasers and providers of healthcare. Large private employers may also provide a full range of healthcare for workers, families and communities. The Tool can be expanded to include these additional sectors across the x-axis.
Limitations
In its current form, the Tool provides a cross-sectional snapshot of a country's healthcare system at a point in time. This limitation can be addressed through creating a series of healthcare system maps to depict changes in structure over time, such as over a period of healthcare reform.
Perhaps the biggest limitation is how much can be depicted in a visual representation without it becoming too complicated for ease of understanding and comparison. As a result, the macro-level map is necessarily limited in representing subsystems. This is particularly evident in the critical area of care provision. For example, the macro-level map does not depict the crucial choices available for organizing the provision of healthcare services such as centralization or decentralization of care delivery, integration of care, governance of healthcare, or how different levels of care are organized.
Likewise, there are important decisions related to purchasing of care such as benefits packages, provider payment mechanisms, accreditation of providers, and prioritization of specific areas of care (such as prevention, primary and secondary), geographies or groups that will affect health systems performance.
However, in practice the Tool is flexible and provides a springboard for the creation of more detailed subsystem representations. For example, focusing on the organization of care delivery; mapping state, regional, or local levels, focusing on specific areas such as public vs private services; or mapping the financing, purchasing and delivery of primary care vs hospital services.
The Tool is also limited by the extent and reliability of health systems data. The financing components of the Tool are supported by information in the National Health Accounts database.27 Key indicators include total health expenditure and expenditure by financing agent. These are further divided by general government expenditure on health, which includes social security (social health insurance), and private expenditure on health. For countries with donor funding, the National Health Accounts separates the proportion of general government expenditure on health between external resources/rest of world funds, and those from domestic sources, which are referred to as ‘public funds.’28
As in all global health research using multi-country data, caution should be exercised in interpretation and analysis. The reliability of health data is dependent on the robustness of data collection methodologies and statistical systems in reporting countries, which vary widely.29 Therefore data should be interpreted as indicative rather than precise. Additional sources may enhance reliability in analyses when data are contradictory.
Policy relevance
The map informs an array of policy decisions in the areas of financing and provision of healthcare. Some of the most important policy choices represented in the map are outlined below and summarized in Figure 4.
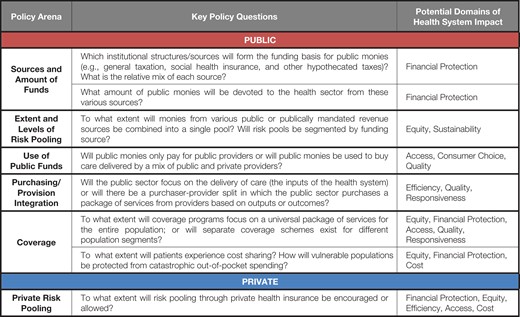
Policy choices in healthcare systems design. A table of the key public and private sector policy questions and the relevant health system domain impact.
Public financing
Decisions about the sources and uses of public financing impact all aspects of the health system, and are described below.
Sources and amount of funds
At the most fundamental level countries must decide the amount of public monies spent on the health sector and the institutions for spending these monies. Most public monies are collected through some form of taxation, and these create the foundation for health system financing. Public policy choices include the amount of general taxes devoted to the health sector, the creation or expansion of social health insurance programs with mandatory contributions from employers and employees, and the implementation of other hypothecated taxes such as sin taxes (e.g., alcohol, gambling and tobacco) for health.
Decisions on the amount of public funding and the range of revenue sources will directly affect the extent of financial protection provided to the population.
Extent and levels of risk pooling
Public or publically mandated funds can be combined in national (or subnational) risk pools or they can be separated by funding source or program. For example, contributions through social health insurance can be co-mingled with general tax revenues to provide services for the entire population in a national health insurance program, or they can remain in a separate pool to cover only those who contribute.
Decisions on the level at which funds are pooled will affect equity in financing for different population groups, the sustainability of risk pools, and the extent to which subsidies from general taxes, or cross-subsidies between programs, may be necessary to provide equity and stability.
Use of public funds
A critical policy question in use of funds is whether public monies will only pay for publically provided care or whether they will be used to buy a mix of services from both public and private providers. Historically, Bismarkian models such as Germany and France contract with both public and private providers to deliver healthcare using public funds, whereas Beveridge systems such as the UK have preferentially directed public monies to publically operated hospitals and clinics.30
Decisions on how public funds will be used to purchase care from different provider sectors will affect geographic access to care, the size of the private delivery system, and consumer choice. They may also affect the quality of care, particularly in resource-poor settings.
Purchasing/provision integration
A related design decision is to what extent public purchasers will also deliver care (vertical integration) or whether there will be a purchaser-provider split in which the public sector buys a defined package of services from providers.
These policy decisions can affect the extent to which ministries of health focus their attention on inputs and production functions, rather than the outputs and outcomes of the health system.21 Extensive public management of healthcare delivery may impact efficiency and responsiveness.31
Coverage
Policymakers need to determine whether there will be a variety of public schemes to fund care for different populations, or whether there will be a universal scheme that provides care to the entire population.32,33 Different coverage schemes may have different rules regarding benefits and providers that can be accessed.
A corollary question is to what extent patients will be expected to contribute to the costs of their care either in the form of insurance premiums or through user fees. In all countries, public benefit packages cannot cover all healthcare needs, so some level of cost-sharing by patients for excluded services is expected. Coverage decisions should include how the vulnerable will be protected from excessive out-of-pocket expenditures.
Decisions in this arena will affect equity and the level of financial protection offered to each population group, if coverage schemes vary. They may also affect access to care, and quality and responsiveness of services.
Private financing
By definition, monies spent outside of the government sector are private health expenditures.24 The absolute amount of private financing for healthcare is dependent on a complex array of factors including the amount of public funds devoted to the health sector, whether public monies pay for private providers, the comprehensiveness of public coverage, the perceived quality of public and private providers, the level of cost-sharing in health services in publically covered facilities, and provider prices. The purchasing power of consumers and their demand for healthcare outside of the public spending envelope will also affect total private spending. Two areas in which public policy can impact private spending include:
Extent of private risk pooling
Public policy can directly influence the extent to which risk pooling is encouraged to promote financial risk protection, such as through the use of private health insurance including community-based health insurance. Decisions on whether to promote or allow a private health insurance market will affect, and can impact provider prices.34 Depending on the robustness of regulatory structures, these decisions can also impact equity and access.35
Medical savings accounts are an alternative to private health insurance that promote pre-payment (though not risk pooling) and offer a degree of financial protection in times of illness. Of note, Singapore is the only country where medical savings accounts are a significant source of healthcare financing.36
OOPS
By default, private household spending on health that is neither risk-pooled nor prepaid is considered OOPS.24 WHO suggests that if OOPS exceeds 15–20% of a country's total health financing, it will erode financial protection for the population and lead to higher rates of catastrophic health expenditures and household impoverishment, especially for the most vulnerable.37
Results
Applying the Tool to India and Thailand
To demonstrate how the Tool can be applied to countries with very different financing and provision structures, we followed the methods described above to map and compare the healthcare systems of India and Thailand. We retrieved National Health Accounts data from the WHO Global Health Expenditure Database. We also conducted a review of peer-reviewed and grey literature to understand risk pooling and provision in these two countries.
The first section provides an overview of the healthcare system of each country and shows its respective healthcare system map. The second section provides a brief comparison of these maps.
India
Though India spends 4.7% of its gross domestic product (GDP) on health, only 30% of this is from public sources (Figure 5).38 Public monies from general tax revenues are generated primarily from the States (78%) and are used to provide healthcare services in public facilities run by state ministries of health.39,40 General taxes also fund nationally mandated schemes such as a unique voluntary public insurance program for the poor known as the Universal Health Insurance Scheme (previously Rashtriya Swasthya Bima Yojna).39,41 This scheme requires cost-sharing from those covered. General taxes and payroll taxes jointly fund the Employee's State Insurance Scheme for low-wage, formal sector workers and the Central Government Health Scheme for civil servants, their families, and government retirees.42 Donors and non-governmental organizations contribute a relatively small share of total health expenditure (less than 1%), often for specific programs or population groups.
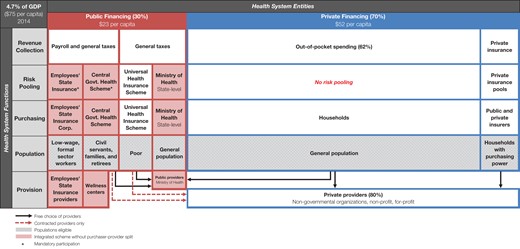
The University of California, San Francisco (UCSF) Healthcare System Map of India. Health system entities fall along the horizontal axis. The vertical axis represents the functions of these entities. Proportions may not add to 100% based on available National Health Accounts (NHA) data.38 All currency is in US$ at current exchange rate. GDP: gross domestic product.
Seventy percent of India's health spending is from private sources, primarily through OOPS at the time of care.38 Less than 2% of total health expenditure is spent on private health insurance premiums and about 1% is from parastatals such as the Indian Railways, and from major private employers.38 Increasingly, states are developing their own state-based insurance programs funded through general taxes. Some states such as Andhra Pradesh have achieved high rates of coverage, while others, such as Punjab, are still largely privately financed.43
Risk pooling occurs at the state level and may be further segmented by individual schemes within states. The majority of public monies are allocated to state ministries of health to operate public hospitals and clinics. National and several state-based public insurance schemes also contract with private providers, though there are large variations by state.41,43 Over 75% of healthcare providers in India practice in the private sector.44,45 Most healthcare received from the large and diverse private health sector is paid for directly by patients through OOPS at the time of illness. Cost-sharing in public facilities also contributes to the significant share of OOPS in India. The low level of public spending and high cost-sharing, result in very high rates of catastrophic expenditures for the Indian people.39,46–50
Thailand
Thailand spends 4.1% of its GDP on health, with the majority (86%) of this from public sources (Figure 6).38 General taxes fund the Civil Servants Medical Benefits Scheme and the Universal Coverage Scheme. The Social Security Scheme, a social health insurance program for the formal sector, is funded by payroll contributions and topped up by general taxes by the Thai government, which provides a third of the scheme's financing.32 These three public schemes provide health coverage to over 99% of the population.32 Funds are pooled at the national level but are segregated by scheme and not combined into a single risk pool, leading to disparities in financing across the three schemes.32
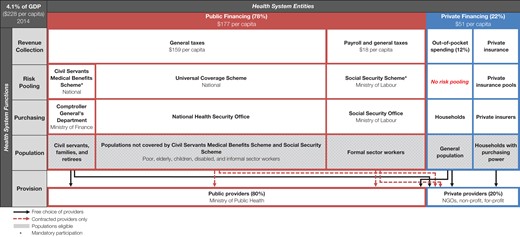
The University of California, San Francisco (UCSF) Healthcare System Map of Thailand. Health system entities fall along the horizontal axis. The vertical axis represents the functions of these entities. Proportions may not add to 100% based on available National Health Accounts (NHA) data.38 All currency is in US$ at current exchange rate. GDP: gross domestic product; NGOs: nongovernmental organizations.
All public schemes have a purchaser–provider split and contract with a mix of public and private providers to deliver healthcare to their beneficiaries.32 This has made strategic purchasing of healthcare possible and created an accountable public sector, enabling strong cost containment in a mixed system.51 There is a gatekeeping system in all three schemes that prevents individuals from seeking care from specialists (including those from the private sector) without a referral from a primary care practitioner.32 Bypassing this system results in beneficiaries having to pay for the full costs of their care out-of-pocket. Universal Coverage Scheme and Social Security Scheme members also bear the full cost of their care if they go out of the contracted network of public and private providers and facilities.
Eighty percent of providers in Thailand work in the public sector, although a small but growing private sector is present in urban centers, particularly the capital city of Bangkok. There are also providers who work in both sectors in larger cities.32 The development of a strong public sector has allowed broader access to care in areas where private providers might not choose to practice and has created leverage for tough negotiating with private providers on prices.
Private health spending is only 14% of total health expenditure, of which over half (54%) is from OOPS on services and products not covered by public insurance schemes, as well as expenses borne by individuals who choose to seek care in the private sector or who bypass the referral system described above.38,52 Thirty-five percent of private health spending goes to private health insurance, while the remaining proportion is spending by non-profit institutions serving households.38
India–Thailand comparison
We compare the public policy decisions made by India and Thailand in structuring their healthcare systems using the policy choice framework above.
Sources and amount of funds
As a share of GDP, Thailand spends slightly less on health than India. In Thailand, the majority of health spending (78%) is from public sources, whereas in India the majority is in the form of OOPS. This results in low financial protection in India50 and robust financial protection for the people of Thailand.52,53
Thailand's public sources include a mix of general and payroll taxes, while India relies almost exclusively on general taxation. Use of multiple sources of financing has contributed to the expansion of Thailand's high coverage rates.54
Extent and levels of risk pooling
In neither country are public revenue sources combined into a national pool that covers the entire population. In India, funding is largely at the state level and funds are risk pooled within states, which creates large disparities across states.50 In Thailand, risk is pooled by scheme, but general taxes are used to ensure sustainability and promote equity across the schemes. Despite this, some schemes still spend considerably more per beneficiary than others, creating inequities between schemes.32
Use of public funds
India's healthcare system initially resembled a Beveridge model based on its colonial past, in which public funds were used only to pay for hospitals and clinics operated by ministries of health. This is still how the largest proportion of public monies is spent, though the recent expansion of insurance programs has expanded provision to include some contracted private providers.39,41,43 In contrast, Thailand has more fully evolved to a mixed system where public funding is directed to both contracted private and public providers. This has increased access to providers for the population in both rural and urban areas.55,56
Purchasing/provision integration
In India, since most public money is directed towards public facilities, there is no purchaser–provider split and ministry of health attention is largely focused on delivering care. However, insurance schemes are emerging and changing the landscape by creating a purchaser–provider split. In contrast, all schemes in Thailand have a purchaser–provider split, which is credited with allowing the ministry of health to focus its attention on improving outcomes, efficiency and accountability rather than on the production function of care delivery.51
Coverage
Public schemes in both India and Thailand cover distinct segments of the population, though overall coverage rates differ considerably. In Thailand, near universal coverage has been achieved, while in India significant portions of the population are left without adequate health coverage.50,51 To better understand the differences presented by the maps, additional research reports that in India there is significant cost-sharing by patients even in public insurance programs, and payment at the point of care is common. In Thailand, care is free at the point of service if patients follow the gatekeeper system and seek care within the provider network.
The high level of cost-sharing by patients in India results in a large proportion of the population facing catastrophic healthcare costs, as high as 64% among the poorest, in some states.41 In Thailand it is below 5%.51
Extent of private risk pooling
Neither country has a large private health insurance sector. India's policies, however, are resulting in more rapid growth of its largely unregulated private health insurance market. In both countries, private health insurers tend to enroll the most well-off.32,39,57
OOPS
Due to the small amount spent by the public sector in India, most Indians pay out-of-pocket for care, generally at the point of service. Much of this care is provided by private providers either because patients believe them to be of higher quality, or because they are more accessible than public facilities, as reported in published research on this topic.43,58,59 Even in public facilities, user charges at the point of service can be significant; according to the 2015 National Health Policy, ‘…almost all hospitalization even in public hospitals leads to catastrophic health expenditures…’.60 By contrast, OOPS in Thailand is small and incurred from seeking services outside the prescribed network of providers.52
Discussion
The financing and delivery of healthcare are complex and varied across all countries. Discussions at both the national and international levels are prone to getting bogged down by the complexity of the detail and it is easy to lose sight of the important policy decisions that each country must take and the informative international comparisons that can be made by focusing on the macro structure of healthcare systems.
The UCSF Healthcare Systems Mapping Tool, described comprehensively for the first time in this paper, is an attempt to clarify and highlight select macro-level structural features of any country's healthcare system to allow meaningful policy debate and international comparison. Applying the Tool to map the healthcare systems of countries at various income levels has revealed a notable degree of convergence among high-income countries and a clear direction of movement by some middle-income countries towards high-income country models.
In this paper we have applied the Tool statically to examine the macro-level organization and structure of two countries. The Tool offers two more dynamic uses, which may be useful for policymakers.
First, it is possible to look back in time and apply the Tool through the recent history of a country either at particular intervals or during a period of reform. This application will reveal the evolution of the healthcare system over time and clarify the direction of progress, which in some cases may turn out to be very different from that intended in health policy plans.
Second, the Tool can be applied looking forward. Many countries will wish to consider their ideal healthcare financing and delivery structure, perhaps in the year 2030 as they move towards universal health coverage. There will be no common model for success. The ideal structure in 2030 for each country will depend on its history, its starting point today, its basic values on issues such as social solidarity and the likely trajectory of its overall economy. By clarifying the desirable future with a 2030 healthcare system map, policymakers may be able to build political consensus for this intended structure, and to visually chart the course of reform. Prospective time-series maps can enable deliberate policy shifts and purposeful actions to ensure that milestones are met on the journey towards the envisaged arrangements. Few countries engage in this critical exercise and as result, debates about the future shape of the healthcare system are quickly overwhelmed by a lack of common understanding of the current situation, ideological debates, and a focus on excessive detail too early in the political process.
Conclusions
As countries embark on the long, winding, and challenging road to universal health coverage, the UCSF Healthcare Systems Mapping Tool provides a novel way to visualize key public policy choices. As part of the health systems strengthening toolbox, it can stimulate debate about the merits and consequences of different system designs, using a common framework that fosters multi-country comparative analyses.
Authors’ contributions: NSF conceived the study; NSF, AA, CP, and ALVA conducted the literature review; NSF, AA, CP, and ALVA wrote initial drafts and the final manuscript. All authors read and approved the final version of the paper. NSF is the guarantor of the paper.
Acknowledgements: We extend our gratitude to Richard G.A. Feachem, Stefan Nachuk, Arian Hatefi, and Felix Holl for their helpful feedback on earlier versions of the manuscript and Tool. We also thank Stefan Nachuk (UCSF Global Health Group) and Viroj Tangcharoensathien (International Health Policy Program, Thailand Ministry of Public Health) for commenting on the Thailand healthcare system map and Nachiket Mor (Executive Director, Gates Foundation, India) on the India healthcare system map.
Funding: None.
Competing interests: None declared.
Ethical approval: Not required.
References

Comments