


Abstract
Many school districts with centralized school choice adopt strategy-proof assignment mechanisms to relieve applicants from needing to strategize based on beliefs about their own admissions chances. This article shows that beliefs about admissions chances shape choice outcomes even when the assignment mechanism is strategy-proof by influencing how applicants search for schools and that “smart matching platforms” that provide live feedback on admissions chances help applicants search more effectively. Motivated by a model in which applicants engage in costly search for schools and overoptimism can lead to undersearch, we use data from a large-scale survey of choice participants in Chile to show that learning about schools is hard, beliefs about admissions chances guide the decision to stop searching, and applicants systematically underestimate nonplacement risk. We use RCT and RD research designs to evaluate scaled live feedback policies in the Chilean and New Haven choice systems. Twenty-two percent of applicants submitting applications where risks of nonplacement are high respond to warnings by adding schools to their lists, reducing nonplacement risk by 58% and increasing test score value added at the schools where they enroll by 0.10 standard deviations. Reducing the burden of school choice requires not just strategy-proofness inside the centralized system but also choice supports for the strategic decisions that inevitably remain outside of it.
I. Introduction
Many school systems around the world use centralized mechanisms to assign students to schools. An important contribution economists have made to the design of centralized school choice is to guide policy makers toward centralized mechanisms that are strategically simple for participants to use. In cities including New York, Boston, New Haven, and Santiago, economists have helped design “strategy-proof” choice systems where applicants’ dominant strategy is to list schools they like in the order that they like them (Abdulkadiroğlu et al. 2005; Abdulkadiroğlu, Pathak, and Roth 2005; Correa et al. 2019; Akbarpour et al. 2020). A central point in the case for strategy-proof approaches is that knowledge of admissions chances—which may be costly to acquire or unequally distributed—is not required for optimal play.
The conclusion that strategy-proof centralized mechanisms relieve choice participants from needing to know about their admissions chances follows from the maintained assumptions of the canonical “school choice problem” (Abdulkadiroğlu and Sönmez 2003) that applicants know which schools are available to them and which they like. But what if learning about schools is costly, and families do not know about all of their options? This article examines how costly search interacts with beliefs about admissions chances to shape what families know about schools, how much this matters for choice outcomes, and what policy makers can do about it. We take an empirical approach, drawing on large-scale surveys and policy variation in the Chilean and New Haven school choice systems.
We make two main points. The first is that costly search for schools is central to the way families experience choice, and this places beliefs about assignment chances back in a key role even when the assignment mechanism is strategy-proof. Many participants stop searching for schools because they think they will be admitted to a school already on their application. Systematic overoptimism about admissions chances leads participants to submit applications with high nonplacement risk.
The second point is that a new kind of intervention, which we call a “smart matching platform,” can help families navigate costly search more effectively. Smart matching platforms aggregate data on the distribution of choice applications to provide live feedback on admissions chances to platform users. We use experimental and quasi-experimental research designs to test smart platforms at scale and find that they change application behavior, raise placement rates, and cause students to enroll in higher-quality schools. We conclude that reducing the burden of choice requires not just strategy-proofness inside the centralized system but also support during the search process that precedes it.
We begin by developing a simple model of school search in a strategy-proof assignment mechanism. We draw on models of job search such as McCall (1970), with the key difference being that individuals add schools they find to an application portfolio, rather than making onetime decisions to accept or decline an offer. Applicants engage in costly, sequential search for schools to add to their choice application. Once applicants decide to stop searching, they submit the application to a strategy-proof assignment mechanism.
The key insight of the model is that the value of search depends on how likely the applicant thinks she is to be placed in the school she finds. We use the model to derive two main results. First, overoptimism about admissions chances can reduce search and increase the risk of nonplacement. Second, information interventions implemented after individuals have decided to stop search weakly raise the probability that applicants search for and find additional schools to add to their applications. Applicants who respond to the intervention by adding schools to their applications are “compliers” with the intervention policy (Angrist, Imbens, and Rubin 1996).
The theory of costly school search has testable predictions. People should not know about all the available schools. People should report that the activities involved in search are challenging, and that one reason they stopped searching is that they thought they would be placed. If in addition people tend to be overoptimistic, they should respond to information about admissions chances by searching more and adding schools to their applications.
We test these predictions using data from two school choice systems. The first is the national centralized choice system in Chile. Chile implemented centralized primary and secondary school choice in 2016. All cities in Chile use the same choice platform to implement a strategy-proof deferred acceptance (DA) assignment mechanism. We use data from the entire system for 2018–2020. Our second setting is the school choice system in New Haven, Connecticut, in 2020. New Haven uses a “truncated” DA mechanism in which applicants can list a limited number of schools. Truncated DA mechanisms are not strategy-proof, but they are less manipulable than the common alternative of immediate acceptance (Haeringer and Klijn 2009; Pathak and Sönmez 2013). Studying the Chilean and New Haven settings together allows us to consider the role of search under different implementations of DA, in different choice platforms, and in different cultural contexts.
We supplement our administrative records with extensive survey data on choice participants in Chile. As part of the 2020 choice process, the Chilean government surveyed families submitting applications to the choice process about their search for schools, their preferences over schools, and their beliefs about their placement chances. These surveys were administered online, after the submission of applications but before results were known. A total of 48,929 applicants completed the choice survey. The combination of a very large sample size and novel questions about the choice application and the search process allow us to construct a detailed picture of how families navigate choice.
Survey findings provide strong evidence that strategic, costly search for schools is one of the central challenges applicants face in the choice process and that our stylized model captures important elements of the way students use potentially inaccurate beliefs to build their application portfolios. We have four main survey findings.
Our first survey finding is that search is, in fact, costly, and applicants have limited information about relevant schools. When asked about what steps they need to take to know a school, large majorities of respondents give a long list of attributes and activities, including academic performance, extracurriculars, and interviews with staff. Obtaining this information would typically require internet research and in-person visits or phone calls. Only 17% of respondents report that they know a randomly chosen nearby school well, compared with 64% who report knowing their first choice well.
Our second survey finding is that the choice to terminate search is a strategic one for which beliefs about admissions chances are an important input. When we ask applicants why they did not add more schools to their list, the modal response is that they think they will be placed at one of the schools on the list already. Of respondents, 35% give this answer, compared with 30% who say they stopped adding schools because there are no more schools around. Applicants reporting higher subjective placement probabilities are much more likely to say they stopped their search because they thought they would be placed.
Our third survey finding is that applicants are overoptimistic about their admissions chances. On average, respondents submitting applications with nonzero risk of nonplacement overestimate their admissions chances by 32 percentage points. Applicants with true placement chances close to zero report average subjective placement beliefs of nearly 70%. Beliefs matter for search, but they are often wrong.
Our fourth survey finding is that the welfare stakes are large. Only 12% of applicants report that they would be at least somewhat satisfied with an outcome of no placement, compared with 69% who report they would be satisfied with the last-ranked school on their application. Differences in satisfaction manifest in enrollment choices. Of applicants, 93% placed at a school where they say they would be very satisfied go on to enroll in the school, compared with 40% of students placed at schools where they say they would be unsatisfied.
The survey results suggest that access to information about admissions chances would be helpful to applicants searching for schools. However, providing this information presents a logistical challenge. Placement chances are attributes of applications, not schools, and depend not just on individual submissions but also on the distribution of submissions in the market.
We develop a new approach to address these challenges, which we call a “smart matching platform.” The smart matching platform aggregates back-end data on the distribution of submitted applications to produce live, personalized predictions about application risk for platform users on the front end. This approach combines several features that past research has shown to be critical for successful information interventions, including the reduction of computational burdens, timely provision, and provision from a trusted source (Mani et al. 2013; Fernandes, Lynch, and Netemeyer 2014; Dynarski et al. 2021).
We evaluate smart matching platforms in Chile and New Haven. In both cases, the platform warned applicants submitting applications with high nonplacement risk. In Chile, these warnings consisted of a pop-up message in the application platform, as well as off-platform text messages. In New Haven, warnings came via email and directed applicants to an application simulator, which they could use to view placement chances for hypothetical applications. To assess risk in advance of application deadlines, policy makers combined data from previous years with data on applications already submitted in the current cycle. These policies were implemented nationwide in Chile starting in 2017, and in New Haven starting in 2020.
Because choice administrators need to choose some cutoff for what makes an application “risky,” risk warnings lend themselves naturally to a regression discontinuity (RD) research design. In the face of quantity limits on messaging, choice administrators in Chile also randomized the provision of off-platform messages on the intensive margin. That is, all risky applicants received a text message, but some received an additional, earlier message including an image. This allows us to employ randomized controlled trial (RCT) research designs as well. These experimental and quasi-experimental approaches allow us to evaluate the theoretical model without restricting access to information or reducing policy efficacy.
Warning applicants about their risky applications leads to lengthened applications, reduced risk of nonplacement, and enrollment in better schools. We focus first on Chile, where sample sizes are much larger. Policy makers designated all applications with at least a 30% predicted chance of nonplacement as risky. All applications above that cutoff received the live notification on the choice platform.
Receiving a warning caused 21.6% of students (std. err. = 1.0) to add schools to their applications, corresponding to the complier group in our model. This is an extremely large effect for a light-touch policy: only 3 of 241 such policies analyzed in DellaVigna and Linos (2022) generated higher take-up rates. Consistent with model predictions, essentially all of the application changes we observe in response to treatment are additions of new schools.
Students complying with the intervention reduced their nonplacement risk by an average of 15.5 percentage points (std. err. = 1.3), or 58% of mean ex post application risk. Most of the additional placements are at schools with slack capacity, suggesting that the intervention reduces market-level congestion. Applicants receiving the intervention are no less likely to enroll in their placed schools. This is consistent with the idea that the intervention does not cause students to match to schools they like less.
Applicants who receive risk warnings enroll in higher-quality schools. Compliers with the intervention enroll in schools where test score value added is 0.10σ higher. These schools pay teachers 12% more, enroll 40% more students per grade, and are 54% more likely to charge students a monthly fee. The intervention helps families avoid the fringe of small, low-quality schools that characterizes some voucher systems (Abdulkadiroğlu, Pathak, and Walters 2018; Neilson 2021).
Smart matching platforms are effective in a wide variety of choice settings. We find large treatment effects across cities and years, and effects do not vary with market-level school choice experience, suggesting a limited role for “learning-by-doing” about admissions chances. We observe treatment effects in markets of all sizes, but applicants with more schooling options nearby tend to add more schools to their applications. Effects are large for both high and low socioeconomic status (SES) students. Results from the text-message RCT show that our findings are not local to the cutoff and that warnings matter on the intensive margin.
The “smart” part of the smart platforms—the personalized risk information—is critical for their effectiveness. We present four pieces of evidence on this point. First, we show that people who receive warnings change their beliefs about placement risk, consistent with the key causal channel in our model. Second, we present results from a series of behavioral nudge RCTs that encouraged people to add schools to their application but did not include risk information. These nudges did not change behavior. Third, we show that personalized smart platforms outperform warnings about aggregate risk. Fourth, we show that “coercive nudges” that require students to add schools to their application but do not explain why adding schools is important lead to low rates of enrollment in placed schools. This contrasts with what we see in our smart platforms intervention, and is consistent with the hypothesis that smart platforms work because they motivate applicants to engage in meaningful search.
In the last part of the article, we present results from a smart platform intervention in New Haven, Connecticut. While the broad structure of the New Haven intervention paralleled the approach in Chile, the cultural context, choice institutions, and intervention details differed substantially. Nevertheless, the intervention had similar effects. Of applicants, 13.8% near the risk cutoff comply with the intervention policy by lengthening their application; these applicants reduce their application risk by 42%. Also as in Chile, a randomly assigned nudge without risk information had no effect on choice behavior.
We contribute to three strands of literature. First, we show that strategy-proofness in the school choice problem does not correspond to strategy-proofness in the broader choice process, and that the divergence between the two places substantial information demands on participants. Many papers consider how students make choices under different assignment mechanisms (Abdulkadiroğlu, Che, and Yasuda 2011; Pathak and Sönmez 2013; De Haan et al. 2015; Agarwal and Somaini 2018; Calsamiglia, Fu, and Güell 2020; Kapor, Neilson, and Zimmerman 2020). These papers analyze behavior in the choice problem and typically ignore deviations from optimal behavior in strategy-proof settings. We show that these deviations are empirically important and provide an economic rationale for why they occur.
An emerging literature considers the search aspect of school choice directly. Several recent papers use theoretical and laboratory approaches to study the equilibrium implications of costly (but rational) search in matching markets (Immorlica et al. 2020; Chen and He 2021, forthcoming; Hakimov et al. 2021). Son (2020) and Ajayi and Sidibe (2021) use application data from centralized choice systems to estimate empirical models that allow for limited consideration sets and belief errors.1 Our empirical contributions are to provide survey evidence that the frictions these papers build into their models are important in practice, provide credible tests of model predictions that shocks to beliefs affect search, and demonstrate that smart matching platforms are an effective policy response. From the theory side, our contribution is to unpack how systematic belief errors affect search from the perspective of the individual applicant. Our work fits into a broader set of studies that consider how strategic actions taken prior to participation in centralized mechanisms affect assignments in the mechanism, for example, in spectrum auctions (Doraszelski et al. 2017; Milgrom and Segal 2020).
Our second contribution is to illustrate the importance of information interventions that target search strategy, as opposed to fixed product attributes. Research on education and product markets explores the effect of providing consumers with information on choice attributes (e.g., Jin and Leslie 2003; Hastings and Weinstein 2008; Allende, Gallego, and Neilson 2019). Findings are mixed, with some interventions changing choices and others finding precise zeros (e.g., Gurantz et al. 2021). Although our intervention is conceptually quite different, our findings can help rationalize null results in some attribute-focused studies. If applicants are confident they will be admitted to a school they like, they may not think it is worth it to conduct the additional due diligence to add a new option to their portfolio, even when prompted with appealing (but limited) information about that option. On the measurement side, we innovate by linking scaled policy evaluation with participant surveys. Direct evidence on how people approach the economic challenges of market participation is crucial for designing interventions on strategy and understanding why they work.
Our third contribution is to show the power of combining market design principles, which limit the need for strategic sophistication, with “prediction machines” (Agrawal, Gans, and Goldfarb 2018) and “choice engines” (Thaler and Tucker 2013), which distill complex data sets into the information people need to make the strategic decisions that remain. We bring narrow AI into a matching setting where it aggregates information on market-level outcomes and identifies the part of that information relevant for specific participants. This contrasts with previous work focusing on attribute comparisons in product markets (Gruber et al. 2020).
II. Searching for Schools
II.A. Model Overview
We guide our empirical analysis using a model of search for schools with imperfect information about admissions chances. The theoretical analysis has two goals. The first is to show how beliefs about admissions chances affect students’ decisions to search for schools to add to their applications. The second is to show how interventions that reduce optimism about placement can cause students to search more, discover more schools, and reduce application risk.
Our analysis takes the perspective of an individual student searching for schools to add to her school choice application. The approach is similar to models of job search (McCall 1970), with the key difference being that agents in our model add schools they find to a multischool application portfolio, from which placement outcomes are determined by a centralized assignment mechanism. This contrasts with the standard approach to job search models, in which agents decide whether to take jobs as they arrive and search terminates once the agent accepts an offer. It also contrasts with models of the school choice problem that focus on market equilibria as the main outcomes of interest. Our model highlights the strategic challenges facing individuals even when the centralized assignment mechanism is strategy-proof, and allows us to draw out the role of beliefs about admissions chances.
II.B. Model Setup
Consider an applicant to a strategy-proof centralized assignment mechanism with limited information about what schools are available to her. The applicant is endowed at time 0 with consideration set |$\mathcal {C}_0 \equiv \lbrace 1,2,3,\ldots ,N_0 \rbrace \subseteq \mathcal {J}$|, where |$\mathcal {J}$| is the set of all schools. The applicant receives utility uj from placement at school j. Without loss of generality suppose |$u_1 > u_2 > \ldots > u_{N_0}>0$|, and that utilities are measured relative to the outside option of nonplacement, which yields utility 0. For each |$j \in \mathcal {C}_0$|, the individual knows their utility from placement at j, |$u_j\in \mathbb {R}$|, and has subjective beliefs about admissions chances pj ∈ [0, 1], which they believe to be independent across j.2
Individuals may choose to pay a cost κ, known to them, to add a school to their consideration set. If so, this school’s subjective placement probability p ∈ [0, 1] and utility |$u \in \mathbb {R}$| are drawn from a distribution Fp,u(p,u) with marginal distribution of utilities Fu(u) and conditional distribution Fp(p|u), where Fu(0) = 0 without loss.3 We emphasize that although Fp,u(·) is the distribution from which new schools are drawn, the initial consideration set |$\mathcal {C}_0$| need not be drawn from this distribution. Individuals have accurate beliefs about the distribution of utilities at schools outside their consideration set, Fu(u), and potentially inaccurate beliefs about the distribution of admissions chances, Fp(p|u), that may depend on their value of being placed at the school. Search costs differ across individuals and are distributed according to Φ(κ), which we assume is differentiable with pdf φ.
This setup captures the idea that students need to know what a school is like before they apply to it. We think of κ as reflecting the cost of achieving this level of familiarity. As in the canonical school choice model, we assume that students know the utilities of the schools that they are considering. We also assume that students have accurate beliefs about the distribution of utilities of schools they have not yet discovered. These assumptions let us focus on the novel aspect of our contribution, which is to analyze the effects of erroneous beliefs about admissions chances.
II.C. The Value of Learning about a School
II.D. Optimism and the Value of Finding a School
The effect of optimism on the value of adding new schools operates through three channels. The first channel is that more optimism reduces the value of adding school s by increasing applicants’ confidence they will be placed in a school they prefer to s. This is the first term in the sum. It is equal to zero if r = 1 (i.e., if added school s is first-ranked on the new application) and negative for r > 1. It will tend to be bigger as optimism grows.
Second, increased optimism raises the value of adding a school to the portfolio because applicants think they are more likely to be admitted to that school. The second term of the sum captures this effect. It is positive for all values of a.
Third, increasing optimism reduces the value of adding school s by raising the expected value of falling below s on the application. The third term of the sum is negative whenever s is not the last school on the application, in which case it is equal to zero. |$\frac{d \Gamma _r}{da}>0$|, because optimism shifts students toward believing they will be placed at higher-ranked schools given that they have fallen below s. We have |$\frac{1}{\Gamma _r-u_s}<0$| because the value of a placement at s is larger than the expected value of possible placement at schools with lower utility than s.
These channels combine to affect the subjective value of adding school s to the application.
Let |$\mathcal {C}_0$| contain N0 ≥ 1 schools, and let school |$s \notin \mathcal {C}_0$| have |$0 < u_s < u_{N_0}$|. Then, letting r = N0 + 1, we have |$\frac{r-1}{r R_s^* }>0$|, and the value of adding s to the application is decreasing in a whenever |$a>1-\frac{r-1}{r R_s^* }$| .
See Online Appendix A.
This proposition shows that for sufficiently high levels of baseline optimism, additional increases in optimism reduce the value of adding schools to the bottom of the application. As we discuss later, this case—optimistic students adding schools to the bottom of their applications—is the modal one in our setting. More broadly, this analysis shows that information on admissions chances can be important to choice strategy even if it does not affect the applications students submit given their consideration set.
II.E. Information Interventions and Search Behavior
Taking this optimal portfolio as a starting point, consider how a decrease in optimism, −Δa for Δa > 0, alters search behavior. Individuals for whom this change reduces the value of search cannot “unsearch,” so their search behavior does not change. Individuals for whom changing optimism raises the value of search, such as those identified in Proposition 1, increase search if their decision to stop was marginal.
Consider an applicant with optimism a who has searched optimally given this level of optimism. The effect of a surprise reduction in optimism by Δa is to weakly raise the probability of further search and to raise the probability of adding at least one school to the choice application by an equal amount.
See Online Appendix A.
Applicants who add at least one school to their application in response to the information treatment Δa are compliers with the intervention policy. In our model, this set is identical to the set of people who engage in additional search.
II.F. Enrollment and Welfare
Online Appendix A extends our baseline model to include applicants’ decisions about whether to enroll in the school where they are placed. The insight this extension delivers is that individual utility from an information intervention increases in proportion to placement rate, except to the extent it is offset by declines in enrollment conditional on placement. Enrollment is a common measure of satisfaction in market design research (Abdulkadiroğlu, Agarwal, and Pathak 2017; Kapor, Neilson, and Zimmerman 2020). Section IV presents evidence that it applies in our setting as well.
II.G. Discussion
Our goal is to study the effects of interventions that provide accurate information about placement chances in settings in which applicants tend to be optimistic. One might extend our model to relax the assumptions that applicants know their utilities, know the distribution of utilities of schools they have not considered, and can discover acceptable new schools at a constant cost. These assumptions are not essential and are not imposed in our empirical work. In addition, it is unlikely that our empirical findings are driven by violations of these assumptions, as the channels that our simplified model rules out would tend to push the effects of our interventions toward zero. See Online Appendix A for further discussion.
III. Setting
III.A. Centralized Choice in Chile
We study the importance of costly search using nationwide survey and administrative data from Chile and district-level data from New Haven, Connecticut. We focus first on Chile, where sample sizes are several orders of magnitude larger. This section describes school choice institutions in Chile and interactions between policy makers and choice applicants that help us understand the role of search. We return to the New Haven setting in Section VII.
Chile introduced nationwide, voucher-based school choice in 1981 (Hsieh and Urquiola 2006). Students receive vouchers they can spend at schools, and schools may charge limited additional fees. For the first 35 years, school choice in Chile was decentralized. Families applied to each school separately. In 2016, policy makers adopted centralized assignment with the goal of making the school choice process more transparent and equitable (Gobierno de Chile Ministerio de Educación 2017). The centralized choice system was rolled out on a region-by-region basis, with adoption in all cities by 2019 and all grades by 2020. The centralized process includes 93% of primary school matriculation in the country, covering almost all public schools and private schools that accept school vouchers.5 In 2020, 450,000 applicants participated.
All cities in Chile use the same choice platform, which assigns students to schools using a DA assignment mechanism (Correa et al. 2019). To ration seats in oversubscribed schools, the mechanism combines coarse sibling, school employee, and alumni priorities with lottery-based tiebreakers.6 Applicants may list as many schools as they want on their choice application.7 This means that the mechanism is strategy-proof. The approach Chile takes to centralized assignment is similar to that used in major U.S. districts such as New York and Boston (Abdulkadiroğlu et al. 2005; Abdulkadiroğlu, Pathak, and Roth 2005).
The centralized school choice platform opens in August each year. Applicants have access to the platform for roughly one month, during which time they may view, submit, and edit their applications. The application deadline falls in early September, and students are notified of their placements in late October. Applicants who receive a placement can turn down that placement if they want. Applicants who reject their placement, who are not placed, or who did not participate in the main round can join a secondary application process in late November that lasts one week. Between early January and the beginning of the school year in March, students who still do not have a placement and placed students who decide to decline their placements may enroll in undersubscribed schools, outside of the centralized system. We focus our analysis on the first placement round, which accounts for more than 90% of placements over the period we study. See Online Appendix C for further discussion of school choice institutions and enrollment outcomes for unplaced students.
We analyze the choice process using data on all applicants to the centralized platform between 2018 and 2020. We describe the applicant population in Table I.8 The platform received just under 1.2 million applications (defined at the student-year level) over this period. Of these, 49% applications came from students identified by the Chilean Ministry of Education (Mineduc) as “economically vulnerable,” a classification based primarily on income and benefits receipt. Of all applicants, 95% come from urban areas, as defined by the 2017 census.9
Descriptive Statistics for Chilean Choice Applicants
| Not | Risky | ||||
|---|---|---|---|---|---|
| Economically | economically | Pop-up | (predicted | ||
| All | vulnerable | vulnerable | eligible | risk > 0.3) | |
| (1) | (2) | (3) | (4) | (5) | |
| N | 1,168,706 | 575,521 | 593,185 | 848,795 | 233,678 |
| % | 1.00 | 0.49 | 0.51 | 0.73 | 0.20 |
| Panel A: Demographics | |||||
| Economically vulnerable | 0.49 | 1.00 | 0.00 | 0.51 | 0.37 |
| Rural | 0.05 | 0.07 | 0.03 | 0.06 | 0.02 |
| Panel B: Application behavior | |||||
| Length initial attempt | 2.77 | 2.61 | 2.93 | 2.70 | 2.36 |
| Length final attempt | 3.14 | 2.92 | 3.36 | 3.06 | 3.20 |
| Total attempts | 1.41 | 1.35 | 1.46 | 1.38 | 1.74 |
| Any modification | 0.25 | 0.22 | 0.27 | 0.24 | 0.43 |
| Add any | 0.21 | 0.19 | 0.23 | 0.21 | 0.41 |
| Panel C: Placement | |||||
| Placed in pref. | 0.79 | 0.84 | 0.74 | 0.80 | 0.45 |
| Placed 1st | 0.54 | 0.61 | 0.47 | 0.56 | 0.18 |
| Particip. in 2nd round | 0.09 | 0.08 | 0.10 | 0.08 | 0.15 |
| Placed in 2nd round | 0.07 | 0.06 | 0.07 | 0.06 | 0.11 |
| Panel D: School capacity available after placement (at local market level defined for each student) | |||||
| Share of total seats | 0.42 | 0.41 | 0.42 | 0.42 | 0.50 |
| Share of seats in free schools | 0.46 | 0.45 | 0.47 | 0.47 | 0.55 |
| Panel E: Attributes of enrolled school | |||||
| Enrolled at some school | 0.97 | 0.98 | 0.96 | 0.97 | 0.95 |
| Enrolled at placed | 0.62 | 0.66 | 0.57 | 0.63 | 0.31 |
| Have value added measure|grade ≤ 8 | 0.77 | 0.76 | 0.78 | 0.75 | 0.77 |
| Value added|enrolled at placed | 0.11 | 0.06 | 0.14 | 0.10 | 0.20 |
| Value added|not enrolled at placed | 0.04 | −0.03 | 0.10 | 0.04 | 0.08 |
| School monthly fee (US$) | 17.02 | 10.20 | 24.05 | 15.14 | 24.25 |
| Share of vulnerable students | 0.61 | 0.66 | 0.56 | 0.62 | 0.56 |
| Panel F: Classification by true risk of initial attempt | |||||
| Mean risk | 0.24 | 0.18 | 0.30 | 0.23 | 0.69 |
| Zero risk | 0.59 | 0.67 | 0.51 | 0.62 | 0.05 |
| Risky (risk > 0.3) | 0.30 | 0.23 | 0.37 | 0.29 | 0.86 |
Notes. N: 1,168,706 (20% from 2018, 41% from 2019, and 39% from 2020). All statistics are means in the population defined by the column header. “Pop-up eligible” (column (4)) are students who submitted applications that received a risk prediction. “Risky” (column (5)) is applicants whose first attempt had a predicted risk > 0.3. Selected row variable definitions are as follows. “Economically vulnerable” is an SES measure computed by Mineduc. “Rural” is an indicator if students live in rural areas. “Length of initial/final attempt” is the number of schools on an applicant's first and final choice application. “Total attempts” is the number of times an applicant submitted an application to the centralized system. Application change and addition variables describe the share of applicants making different kinds of changes applicants make between their first and final submission. “Placed in pref/1st” are indicators for any placement or for placement in the school ranked 1st. “2nd round” variables describe participation and placement outcomes in the second centralized placement round. “Share of total seats/seats in free schools” is the share of seats in all schools/in schools without fees unfilled after the first application round in a student’s local market. Value added and school characteristic variables are described in Online Appendix D. Value added is calculated only for grades 8 and below. True risk of initial attempt variables describe the nonplacement risk of an applicant’s initial application, evaluated using ex post observed applications.
Many applicants interact more than once with the application platform between the time it opens and the application deadline. Table I, Panel B describes these interactions. The first portfolio an applicant submits contains an average of 2.8 schools. Following their initial submission, applicants are free to revisit their submission and change, add, or subtract schools at any time before the deadline. At the deadline, the average portfolio length rises to 3.1 schools. The average applicant submits 1.4 distinct portfolios to the centralized platform before the deadline. Twenty-five percent of applicants submit a final application that differs from their initial application. The most common change is to add a new school to the application: 21% of all applicants have a school on their final application that was not on their initial application. Most people who add schools add them to the bottom of their portfolio—18% make such an addition—but 3% add a new school to the middle of their application (i.e., above some but not all previously ranked schools) and 2% add a school to the top (above all previously ranked schools).10Table I, columns (2) and (3) show that lower-income students tend to have shorter applications and are less likely to change their applications.
Most but not all students receive a placement through the centralized process. As reported in Table I, Panel C, 79% of applicants receive a placement at some school on their first-round application: 54% of students are placed in their first-ranked school, 13% in their second, and 6% in their third. Five percent of students place at a school lower than third. Placement rates are higher for lower-income students despite their shorter applications. Of low-income students, 84% receive a placement, compared with 74% of higher-income students. Nine percent of students who participate in the first round go on to participate in the second centralized round, and 7% receive a second-round placement.11
Nonplacement occurs despite slack capacity. Table I, Panel D displays the (applicant-weighted) average share of seats in a market that are unfilled after the first placement round. On average, participants apply in markets where 42% of seats are unfilled; the share of unfilled seats in schools that are free to students is even higher. These values exceed the share of students placed in the second placement round, indicating that follow-up attempts to fill slack capacity do not fully succeed.
Most students who are placed in a school enroll in that school. As reported in Table I, Panel E nearly all (97%) students enroll in some school; 62% of students enroll in a school where they were placed through the centralized process, reflecting a compliance rate of 78% for the 79% of students who receive a placement.
We describe the schools students attend using school-by-year outcome and input data from Neilson (2021). Our main measure of quality is test score value added (VA). The scale is student-level standard deviations, with the mean normalized to zero in 2016. We measure VA using fourth-grade scores, which are available for most primary schools but few schools serving grades 9 and up. We focus our VA analysis on students in grades 8 and below. Of these students, 77% enroll in schools with a VA estimate. See Online Appendix D for details.
Students who enroll through the centralized process enroll in better schools. Mean value added for students who enroll at their placed school is 0.11, compared with 0.04 for other students. This gap is larger (0.09 standard deviations) for economically vulnerable students than for other students (0.04 standard deviations). Low-SES students enroll at schools with lower average monthly fees than high-SES students and with higher shares of low-SES peers.
III.B. Intervention Design
Heading into the 2017 process, nonplacement risk was a major concern for education policy makers in Chile. Our research team worked with Mineduc to evaluate the causes of nonplacement risk and formulate a policy response. Preliminary descriptive and qualitative evidence suggested that some families had inaccurate, overly optimistic beliefs about their chances of being assigned to schools. Based on this evidence, we helped Mineduc design a set of information interventions alerting applicants to nonplacement risk. These interventions identified applicants whose submissions placed them at risk of nonplacement and notified them of this risk prior to the close of the application deadline.
The key feature enabling these interventions is the ability to interact with application data and applicants in real time over the course of the application process, to compute and communicate risk. The technical and logistical demands of implementing live feedback at scale led one member of the research team (Neilson) to found a nongovernmental organization (NGO), ConsiliumBots, specializing in school choice services. The NGO partnered with Mineduc to run the interventions from 2018 on. See our Disclosure Statement in the Online Appendix for details on the relationship between the research team and the implementing partner NGO.
Mineduc conducted two kinds of information interventions over the period we study. We summarize them here with additional detail in Online Appendix C.
The first intervention was an interactive pop-up message embedded in the application platform, which we label the platform pop-up. This intervention computed a predicted risk value for each application submitted through the platform. Applications identified as “risky”—defined as having a nonplacement risk greater than 30%—received a pop-up warning about their application immediately after they clicked submit. The warning stated that many families were applying to the same schools, and not enough seats were available for all applicants. It encouraged students to add more schools to their applications, while also offering the option to continue and submit the application as is. Online Appendix Figure B.I displays the pop-up, with key text translated to English.
Mineduc implemented this intervention throughout the choice system. In 2018 and 2019, Mineduc activated the pop-up functionality one to two days after the date that applications opened. This delay reflected a combination of implementation difficulties and a desire to collect data on early applications for use in demand predictions. Our empirical analysis of pop-up effects in 2018 and 2019 excludes the students who submitted their first application attempt before the pop-up came online. These students made up 39% of applicants in these years. In 2020, the pop-up was available over the full application window for most applicants.12
Table I, column (4) describes the 73% of applicants who submitted applications at times and in markets where the pop-up was available. We label this group “pop-up eligible” because members received a warning if their application was deemed risky. Pop-up eligible applicants resemble the full population in their demographic characteristics and application behavior.
The second kind of intervention consisted of supplemental “reminders” to risky students. These reminders were delivered via text message or the messaging service WhatsApp and contained information similar to the pop-up.
Our analysis of reminder interventions focuses on the 2020 application cycle, when Mineduc sent a sequence of up to three messages to applicants who submitted risky applications. As in previous years, these interactions began with the pop-up intervention on students’ initial application submission. All applicants who had submitted risky applications as of day 20 of the application cycle received a text message from Mineduc. Mineduc sent another text message to risky applicants on day 27 (the day before applications close) repeating this information and providing a link to the student’s choice application.
On day 25 of the application cycle, between the two text messages to all risky applicants, Mineduc and the NGO conducted an RCT evaluation of a WhatsApp intervention. We call this the WhatsApp RCT. The NGO chose a random subset of 10,000 risky applicants and sent them a WhatsApp message with an image containing a personalized risk warning.13 The warning stated that their risk of nonplacement was high and suggested that students add schools to their applications to address this risk. Two factors motivated the WhatsApp RCT. The first was the idea that an image sent through the popular messaging service might be an effective supplement to the other interventions. The second was a constraint placed by the WhatsApp messaging contractor, which capped the number of messages that could be sent. Online Appendix Figure B.II outlines the time path of interactions with risky applicants in 2020 and presents images of each intervention.
The set of reminders implemented in 2020 built on a more limited reminder policy implemented in 2018. In 2018, Mineduc sent a single SMS message to all risky students four days before the application deadline. Mineduc did not send any reminder messages in 2019.
We evaluate the platform pop-up using an RD design around the 30% risk cutoff. In 2019, the RD estimates capture the effect of the pop-up for applicants near the cutoff. In 2018 and 2020, the RD estimates capture the effect of the pop-up and its interaction with the subsequent reminder interventions. Our goal in the RD analysis is to provide proof of concept that smart platform information interventions affect search behavior and placement outcomes, not to unpack the differential effects of interventions by medium and timing. In what follows, we present RD estimates separately by year. Readers who are interested in understanding the effects of pop-ups absent their interactions with subsequent reminders can focus on the 2019 implementation year.14
We evaluate the WhatsApp reminder in a standard RCT framework. Because treatment and control in the WhatsApp RCT are drawn from the set of students who still have risky applications after receiving previous reminders, the RCT evaluation tells us about intensive-margin treatment effects in a group that is negatively selected on its response to previous similar treatments. It also provides information on the distribution of effects close to the risk cutoff and higher in the distribution of application risk. Putting the RCT together with the RD yields a rich picture of how information on admissions chances shapes outcomes for students at different points in the risk distribution and at different points in the choice process.
In addition to our main analyses of the 2018–2020 platform pop-up and the WhatsApp RCT, we present some supplemental results from the 2016, 2017, and 2021 choice processes. The process in these years was similar to 2018–2020. We note relevant cross-year differences in the text as needed, with details in Online Appendix C.
III.C. Application Risk and Risk Predictions
Predicted application risk is a critical input to the interventions we study. The NGO computed application risk in each market-year as follows. They first obtained the vector of reported school capacities for the current year, a projected number of applicants N, and a data set of applications and student types (i.e., priorities). For the first few days of each market-year, these data consisted of the previous year’s joint distribution of applications and priorities. For the remaining days, these data consisted of submissions thus far in the current process.
The NGO’s algorithm resampled N (application list, student priority type) tuples from this data set, drew lottery numbers, and simulated the matching process. Repeating this process 500 times, the NGO computed the probability of nonplacement within each school-grade-priority group. This procedure is related to the resampling approach introduced by Agarwal and Somaini (2018) for calculating placement probabilities.
The NGO then developed a web service that used the calculated probabilities to predict the risk of nonplacement for any individual application. These are equal to the probability of not being assigned to any of the schools in the list, for the specific grade and priority of the applicant. For more details on simulation and demand prediction, see Online Appendix F.
Risk predictions closely track applicants’ true nonplacement risk. Figure I, Panel A describes the distribution of predicted placement probabilities across different values of true, ex post placement probability. The ex post placement probability is constructed identically to the placement prediction, but using realized rather than predicted applications. Predicted values cluster around true placement probabilities across the distribution. The slope of the predicted value in the true value is 0.81, with deviations from 1 driven by slight but systematic underprediction of risk among the most risky applications. Our assessment is that the predicted risk measure provides a reasonable guide to true risk, particularly in comparison with applicants’ risk beliefs, which we discuss in detail below.
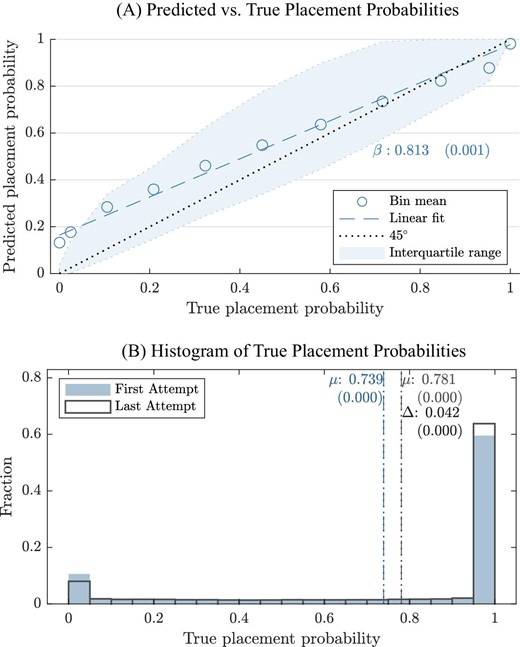
Distribution of Placement Probabilities and Probability Predictions
Panel A: binned means, linear fit, and interquartile range of predicted placement probability by true placement probability. Points are centered means of 10 quantile-spaced bins of the support of the true placement probability ∈ [0.00; 0.99]. The last point at the right represents the mean of predicted placement probability for observations with true probability greater than 0.99. Placement predictions in Panel A combine observed applications at the time an individual submits her application with historical projections. See Section III.C for details. Panel B: histogram of the true placement probability for the initial application attempt and final application submission. Vertical lines display means.
Many applicants submit risky initial applications. Table I, Panel F describes ex post (or “true”) risk on the initial application attempt. Mean nonplacement risk on the initial application is 24%. A majority—59%—of applicants are almost sure to be placed. We classify individuals as facing zero risk if their nonassignment probability is less than 0.01. At the same time, many applicants submit very risky applications: 30% submit initial applications with nonplacement risk above 30%. Median risk for students submitting applications with nonzero risk is 62%, and 25% of such applicants have nonplacement risk of 92% or higher. Figure I, Panel B plots the histogram of the risk distribution for the first and final application attempts. Mass stacks on the edges of the distribution, at very high and low risk levels. Mass shifts slightly toward lower-risk applications between the initial and final submissions.
As reported in Table I, column (5), 20% of all applicants—233,678 students over the three years—are classified as risky by the choice platform based on their initial application. Risky applicants are less likely to be economically vulnerable than other applicants and more likely to come from urban areas. They submit shorter initial applications than the sample population as a whole, but longer final applications and are more likely to change their applications between their initial submission and the deadline. Forty-five percent end up being placed at one of their preferences in the first round, while 11% receive a second-round placement.
Online Appendix Table B.II describes the sample of students critical to our analysis of the effects of application warnings. Applicants near the cutoff for receiving a pop-up warning (defined here as having nonplacement risk between 0.1 and 0.5) have slightly higher SES, slightly longer applications, and similar rates of application changes to the full sample. Like the broader sample of risky applicants, the sample of risky 2020 applicants in the text message RCT is relatively high income and characterized by longer choice applications and more frequent engagement with the choice process than the population as a whole.
III.D. Survey Design
To learn more about how families engaged with the choice process, the NGO helped Mineduc conduct a survey of choice participants in 2020. The survey asked questions about several school choice topics. It included modules about preferences, beliefs, and search designed to provide context for the interventions we study here. The survey innovates over past surveys of choice participants (De Haan et al. 2015; Kapor, Neilson, and Zimmerman 2020; Wang and Zhou 2020) by recruiting a larger sample and by asking about search in addition to preferences and beliefs. See Online Appendix G for survey text.
Mineduc contacted students using an email message sent from the official school choice email account. Mineduc sent the message following the application deadline, but before the release of placement outcomes. They chose this time to maximize applicants’ recall of their school choice experience while ruling out the possibility that the survey might affect applicants’ portfolios. In total, Mineduc contacted 373,710 families. Of these, 48,929, or 13%, completed the survey. Online Appendix Table B.II describes survey respondents. They are slightly less likely to be economically vulnerable and rural than the population as a whole, but they closely resemble the broader population in terms of application behavior.
IV. Survey Findings
IV.A. Placement, Enrollment, and Student Welfare
The main focus of our analysis is whether students receive any placement through the centralized mechanism. Evidence from our applicant survey supports the idea that placement versus nonplacement is a critical margin from a welfare perspective. The survey asked respondents to report how satisfied they would feel if they were placed at the first-ranked school on their application, if they were placed at the last-ranked school, or if they were unplaced. At the time of the survey, applicants had submitted their applications but had not received results, so responses reflect certainty over what the schools in question were, but not ex post rationalization of known outcomes. Online Appendix Figure B.III reports two findings, which we summarize here. First, most (69%) applicants would be satisfied with a placement at their last-ranked school, while nearly all (89%) would be unsatisfied with nonplacement. Second, the choice to enroll in the placed school tracks measures of preference for the school. Of students placed in schools they give the highest satisfaction rating, 93% choose to enroll, compared with 40% at schools with the lowest rating.
IV.B. Search Costs and Search Strategies
We turn to the question of how applicants search for schools. Our first result here is that getting to know a school well requires a lot of information, some of which may be costly to obtain. Our survey asked respondents what they needed to know about a school to feel that they knew it well. Respondents could select multiple options from a list of possibilities. As reported in Figure II, Panel A, large majorities gave a long list of attributes. Some of these attributes are relatively easy to learn about from public sources. Eighty-three percent said they would need to visit a school’s website, and 93% said they would need to learn about a school’s academic performance, which is also available online. Information on others, like extracurricular activities or school infrastructure, could likely be obtained with a short visit. However, some kinds of information that respondents value would likely be hard to find. For example, 66% of respondents said they needed to interview school staff; 79% said they required references from current families.
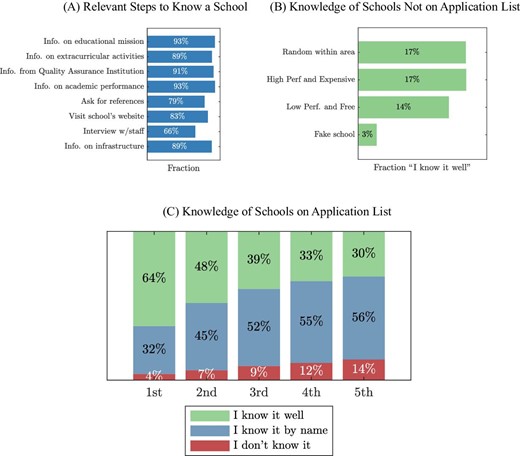
Knowledge of and Search for Schools
Panel A: share of survey respondents stating that an understanding of the listed attribute was relevant for “know[ing] a school well.” “Info on educational mission” refers to qualitative information on a school’s educational goals and approach; schools are required to report this information to Mineduc, and it is posted online. “Info from Quality Assurance Institution” is information on academic performance and other indicators not related to standardized tests from education regulators in charge of the evaluation of schools. Panel B: share of students stating that they “know well” schools not listed on their application, for schools of type listed on the horizontal axis. All schools are within an applicant’s local area, defined as 2 km from the student’s location (home address reported on the platform, replaced with the centroid of application if geocoding was unreliable). “High performing and expensive schools” are those classified in the two best tiers of performance (out of four) by the Quality Assurance Institution, with a monthly copayment of US$35 or more. “Low performing and free” schools are defined as schools in the worst tier of performance, with no copayment. “Fake schools” are schools that do not exist in the student’s local area. Panel C: stated knowledge of schools on application list, by rank. See Section IV.B for details.
Our second result is that applicants do not feel that they know many schools well. We asked each respondent how well they knew a randomly selected nearby school, a nearby school that was high performing and expensive, and a nearby school that was low performing and free.15 We asked respondents about a “fake” school—that is, a school that did not exist. Figure II, Panel B reports the share of students that claim to know each school well. Only 17% of students report knowing the random nearby school and the high-performing, expensive school well. Fourteen percent report that they know the low-performing, free school well. Encouragingly, only 3% report knowing the fake school well. Search is costly enough that at the end of the choice process, most families do not feel well informed about many nearby schools.
Consistent with the idea that applicants learn about schools before applying to them, respondents claim to know the schools on their applications better than they know randomly chosen nearby schools. Figure II, Panel C displays applicants’ responses to a question asking how much they knew about the schools on their submitted application. Sixty-four percent of students claim to know their first-listed school well, and 48% claimed to know the second-listed school well. Knowledge declines with application rank, but 30% of students who submit applications including at least five schools claimed to know the fifth school well. This is nearly twice the share claiming to know a randomly chosen school well.
We now turn to the role of beliefs about admissions chances in search. Proposition 1 provides conditions under which applicants who think they will be admitted to a school in their existing portfolio will be less likely to engage in additional search. Two survey findings suggest that this kind of behavior is widespread.
First, we asked applicants directly why they stopped adding schools to their application. Respondents could choose from four options: (i) there were no more schools around to add, (ii) there were schools around but they would rather not attend these schools, (iii) it is hard to find more schools, and (iv) they think they will be placed at one of the schools already on their application.
The most common reason applicants give for stopping search is that they think they will be placed in a school already on their list. As reported in Figure III, Panel A, 35% of respondents chose this option. Another 17% said they stopped adding schools because additional schools were hard to find, a response that also invokes costly search. Together, these two search-related responses account for a majority (52%) of all responses. We interpret this as a likely lower bound on the share of respondents for whom costly search affected choice, since costly search might also have played a meaningful but not primary role for applicants giving other responses. The remaining 48% of respondents gave answers more in line with the traditional school choice problem, in which applicants list all available schools (“no more schools around”) or list schools preferable to an outside option (“I’d rather not be placed at remaining schools”).
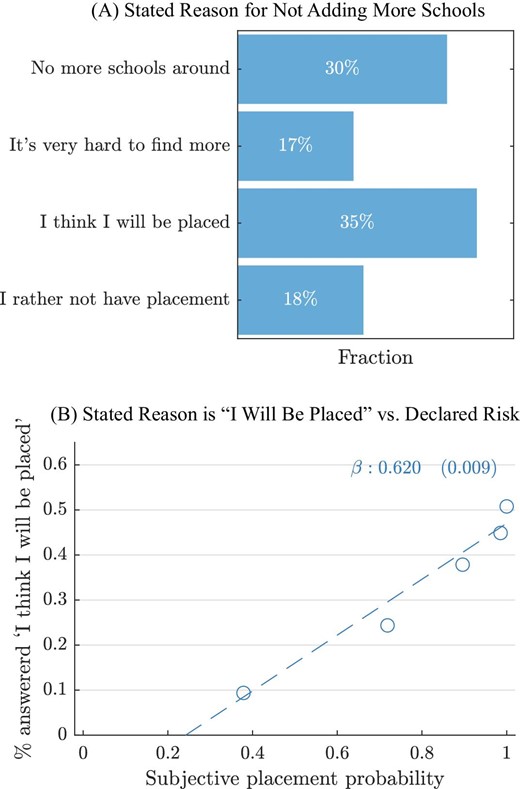
Reasons for Stopping School Search
Panel A: survey reports of reason for not adding more schools to the choice application. Panel B: share of survey completers stating that they stopped search because they think they will be placed, by survey report of subjective placement probability. Sample in both panels: survey completers.
Second, applicants who thought their chances of being placed were high were the most likely to say they stopped search because they thought they would be placed. Our survey asked respondents what they thought their chances were of being placed at any school on their submitted portfolio. Figure III, Panel B plots the share of students saying they stopped search because they thought they would be placed at one of their submitted options at each quintile of the distribution of subjective placement chances. Respondents become much more likely to give this reason for stopping search as their subjective placement beliefs increase. Of respondents in the top quintile of the subjective belief distribution, 51% said they stopped search because they were confident in their placement chances. In contrast, only 9% of respondents in the bottom quintile gave this reason for stopping search.
IV.C. Optimism and Search
Our first set of survey findings shows that search for schools is hard and beliefs about placement chances are a critical input to search strategy. Our second set of findings shows that these beliefs are wrong. We do so by comparing respondents’ reported beliefs about placement chances to our calculations of objective placement chances.
Figure IV, Panel A shows the distribution of subjective and true placement chances for applicants with nonzero risk of nonplacement. Applicants far overrate their placement chances. The mean subjective placement probability is 76%, 32 percentage points above the mean true placement probability of 44%. The graph shows a mass of subjective beliefs piling up around a placement probability of 1. The densest part of the distribution of true placement chances for these students is near zero, with no corresponding mass in subjective beliefs. Panel B shows the distribution of optimism, defined as the difference between subjective and true placement chances. This distribution is shifted far to the right of zero. Many respondents overestimate their placement chances by 50 percentage points or more.
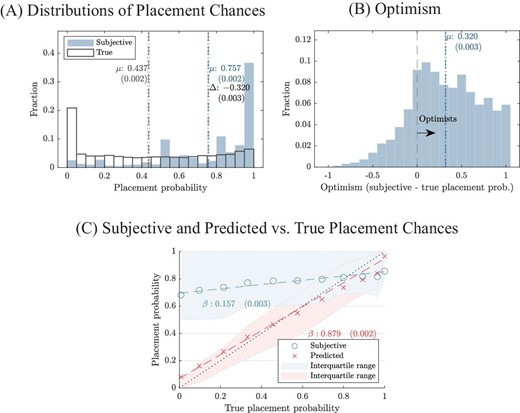
Subjective versus Observed Application Risk
Panel A: distribution of true placement chances and survey-reported subjective placement chances. Vertical lines display means of each distribution. Panel B: distribution of optimism, defined as the difference between subjective and true placement chances. Panel C: mean subjective placement belief in bins defined by the true placement probability. The bottom bin includes applicants with placement probability less than 1%, and the top bin includes applicants with placement probability of 99% or more. The middle eight groups split the remaining observations into equally sized bins. Dashed lines are linear fits. Shaded areas are IQRs for subjective beliefs and risk predictions (within survey sample). The 45-degree line is displayed for reference. Sample: survey completers.
In a mechanical sense, the source of this optimism is that many applicants with low true placement chances think they are likely to receive a placement. Figure IV, Panel C plots the distribution of subjective placement beliefs, binned into groups by true placement probability. If beliefs were accurate on average, they would follow the 45-degree line. We instead observe a weak positive relationship with a large upward shift. The mean subjective belief for applicants with true admissions chances near zero is close to 70%.
For comparison, we also plot the distribution of the NGO’s predicted risk measure, as computed at the time of the application for the set of survey respondents. As in the full sample, risk predictions do not precisely track the final risk values. However, it is clear that predictions are much closer to true placement probabilities than are subjective beliefs.
Several pieces of evidence indicate that our belief measures are credible. We have already shown that beliefs are related to stated reasons for stopping search. Additional results in Online Appendix Figure B.IV show that our findings on the distribution of beliefs are consistent whether we frame the question in terms of placement chances or in terms of nonplacement risk and that respondents’ overall assessments of application risk are closely related to the level of application risk implied by their beliefs about school-specific placement chances.
V. Warnings, Choice Behavior, and Choice Outcomes
V.A. The Platform Pop-Up
Our survey findings show that many applicants strategize on the basis of overly optimistic beliefs about admissions chances. Along with our theoretical analysis, this suggests that applicants should respond to warnings about nonplacement risk by adding more schools to their portfolios. We test this proposition using experimental and quasi-experimental research designs implemented in the Chilean and New Haven choice systems.
We focus first on the platform pop-up administered to Chilean students inside the choice system. Because all students with at least a 30% chance of nonplacement received this warning, we evaluate it using a RD design. In our visual analysis of RD outcomes, we display binned means together with global polynomial fits to provide a sense of broad patterns in the data and how they relate to observed discontinuities. When computing estimates of RD effects, we use local linear specifications with a triangular kernel and a bandwidth of 0.1. This bandwidth approximates that given by optimal bandwidth calculations (Calonico, Cattaneo, and Titiunik 2014).16
We first show that applicants’ observable characteristics are unrelated to which side of the 30% cutoff they fall on. Table II, Panel A shows how the share of students from rural areas and the share of low-income students vary by position relative to the cutoff for the full sample and for each choice year. Cross-threshold differences in these attributes are small in economic terms. Because our sample size is quite large—roughly 41,000 applicants in the local bandwidth—our estimates are very precise, and some economically small effects are marginally statistically significant. Online Appendix Figure B.V shows that there is no visual evidence of discontinuities in predetermined covariates or in the density of the running variable. These findings are consistent with the observation that the 30% cutoff had no significance for applicants prior to policy implementation.
RD Estimates of Platform Pop-Up Effects
| All | |||||
|---|---|---|---|---|---|
| IV | 2018 | 2019 | 2020 | ||
| (1) | (2) | (3) | (4) | (5) | |
| Panel A: Balance | |||||
| Economically vulnerable | −0.004 | −0.014 | 0.016 | −0.012 | |
| (0.010) | (0.029) | (0.018) | (0.013) | ||
| Rural | −0.007 | −0.002 | −0.009 | −0.008 | |
| (0.003) | (0.007) | (0.005) | (0.003) | ||
| Panel B: Choice behavior | |||||
| Any modification | 0.214 | 0.164 | 0.217 | 0.224 | |
| (0.010) | (0.025) | (0.018) | (0.013) | ||
| Add any | 0.216 | 0.176 | 0.224 | 0.223 | |
| (0.010) | (0.024) | (0.018) | (0.013) | ||
| Schools added | 0.340 | 1.573 | 0.379 | 0.317 | 0.344 |
| (0.026) | (0.090) | (0.068) | (0.050) | (0.033) | |
| Δ Risk | −0.033 | −0.155 | −0.039 | −0.040 | −0.029 |
| (0.003) | (0.013) | (0.009) | (0.007) | (0.004) | |
| Add as first | −0.003 | −0.012 | −0.007 | −0.005 | −0.000 |
| (0.003) | (0.013) | (0.008) | (0.005) | (0.003) | |
| Add to middle | 0.017 | 0.078 | 0.017 | 0.023 | 0.014 |
| (0.004) | (0.018) | (0.012) | (0.007) | (0.005) | |
| Add as last | 0.205 | 0.949 | 0.172 | 0.207 | 0.213 |
| (0.009) | (0.018) | (0.023) | (0.017) | (0.012) | |
| Drop any | −0.001 | −0.003 | −0.009 | 0.018 | −0.008 |
| (0.004) | (0.019) | (0.010) | (0.008) | (0.005) | |
| Reorder | 0.014 | 0.065 | 0.026 | 0.005 | 0.015 |
| (0.005) | (0.022) | (0.013) | (0.009) | (0.006) | |
| Panel C: Choice outcome | |||||
| Placed to preference | 0.038 | 0.178 | 0.033 | 0.086 | 0.020 |
| (0.009) | (0.041) | (0.026) | (0.018) | (0.011) | |
| Enrolled in placed | 0.024 | 0.113 | 0.008 | 0.055 | 0.018 |
| (0.010) | (0.049) | (0.029) | (0.020) | (0.013) | |
| Enrolled in placed|placed | −0.006 | −0.025 | −0.021 | −0.009 | 0.003 |
| (0.011) | (0.045) | (0.031) | (0.022) | (0.013) | |
| Panel D: Congestion-related outcomes | |||||
| Add any undersubscribed | 0.073 | 0.339 | 0.052 | 0.081 | 0.075 |
| (0.007) | (0.026) | (0.016) | (0.012) | (0.009) | |
| Δ prob. placed to undersubscribed | 0.019 | 0.088 | 0.015 | 0.032 | 0.014 |
| (0.003) | (0.014) | (0.008) | (0.007) | (0.004) | |
| N to the left of the cutoff | 20,359 | 20,359 | 2,834 | 6,076 | 11,449 |
| N to the right of the cutoff | 21,145 | 21,145 | 2,776 | 6,015 | 12,354 |
Notes. Local linear RD estimates of pop-up effects from warning pop-up on application platform. Computed using a triangular kernel with bandwidth 0.1. A heteroskedasticity-robust nearest-neighbor variance estimator with minimum of three neighbors is reported in parentheses; this is computed as in Calonico, Cattaneo, and Titiunik (2014). We report estimates in the pooled sample and for each year. IV (column (2)) shows the instrumental variable specifications, where the endogenous regressor is the “add any school” indicator. Panel A: predetermined covariates. Panel B: measures of choice behavior from initial to final application. Δ risk is change in application risk from first to final attempt. “Add to X” are additions of schools in the given place on the list, relative to initial application submission. Panel C: outcomes of choice process. “Enrolled in placed” is equal to 1 for students who receive a placement and enroll in the placed school. “Enrolled in placed | placed” is the enrollment rate in the placed school, conditional on receiving a placement. Panel D: congestion attributes of behavior and placement outcomes. “Undersubscribed” schools are those with excess capacity.
V.B. Choice Behavior
Figure V, Panels A–C and Table II, Panel B show how receiving the platform pop-up changed choice behavior. Receiving a warning caused 21.4% of applicants to alter their submissions. Essentially all of these changes are additions to the application. Receiving a warning caused 21.6% of applicants to add at least one school to their application.17 Students add an average of 0.34 schools, and ex post risk of nonplacement falls by 3.3 percentage points, 13% of the below-threshold mean. These effects are stable across years.
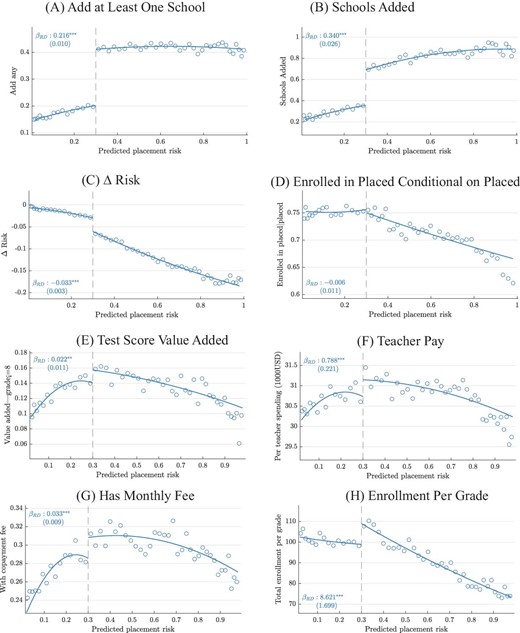
Choice Behavior and Enrollment Outcomes in the Platform Pop-Up RD
Binned means and global fits of choice outcomes by predicted risk for initial application. Points are centered means of 50 quantile-spaced bins of the support of the predicted placement risk ∈ [0.02; 0.98]. Solid lines show the quadratic fit. Reported coefficients and standard errors are from local linear specifications using ±0.1 bandwidth. See Section V.A for details. Because coefficients are local and polynomial fits are global, there may be minor differences between displayed fits and reported coefficients. Outcomes by panel are as follows. Panel A: add at least one school to application. Panel B: count of schools added. Panel C: change in risk from initial to final application. Panel D: Enroll in placed school conditional on placement. Panel E: value added at enrolled school. Panel F: teacher compensation at enrolled school. Panel G: indicator for monthly fee at enrolled school. Panel H: students per grade at enrolled school.
The effects of the warning on choice behavior are extremely large in the context of light-touch policies. DellaVigna and Linos (2022) describe the results of 241 randomized evaluations of light-touch interventions implemented as public policy. The average effect of these interventions on take-up rates for the desired action is 1.4 percentage points, roughly 6% of the 21.6 percentage point effect we observe. Only 3 of the 241 policies had take-up effects of 20 percentage points or more.
As discussed in Proposition 2, the 21.6% of students who add a school to their application in response to the intervention are compliers with the warnings policy. The second column of Table II displays instrumental variables estimates in which adding at least one school to the application is the endogenous regressor. The resulting effect estimates can be interpreted as local average treatment effects for the complier group. Compliers add an average of 1.6 schools to their application list, and reduce their ex post nonplacement risk by 15.5 percentage points, equal to 58% of the below-threshold mean. The share of compliers with the intervention policy is large, and the risk reduction in this group is substantial.
The changes applicants make to their applications are consistent with the idea that the intervention leads to additional search. As reported in Table II, Panel B, most but not all students who change their applications do so by adding schools to the end. Receiving the warning raises the chance a student will add a school to the end of their application by 20.5 percentage points, about 95% of the share of students adding any school to their application. The frequency with which students add schools to the end of their application indicates that Proposition 1’s focus on students adding schools to the bottom of their rank list is empirically relevant. However, receiving a warning also causes 7.8% of policy compliers to add schools to the middle of their list. This suggests that at least some applicants are learning about new schools, and not just adding known schools to the bottom of their rank lists. Very few students add schools to the top of their rank list, indicating that for the most part students identify their top-choice schools early in the search process.
The platform pop-up does not cause students to drop schools from their rank lists. This is consistent with our model, in which students who find additional schools add them to their portfolio and do not “un-search.” We find some evidence that a small share (1%) of students reorder the existing schools on their application in response to the intervention, although the visual evidence here is not as compelling.18 The warning may prompt some students to revise their applications as their preferences change over time (Narita 2018). However, any such effect is second order compared with the share of students adding schools.
V.C. Enrollment and Welfare
Changes in application behavior translate to changes in choice outcomes. Table II, Panel C reports the effect of receiving the warning on placement outcomes. Students receiving a warning are 3.8 percentage points more likely to be placed in one of their listed schools. As expected, this closely tracks the reduction in nonplacement risk (within one standard error).
Warnings do not produce lower-quality placements. Overall rates of enrollment rise in proportion to changes in placement across the cutoff, and the rate at which students enroll in school conditional on placement is continuous through the cutoff value. Figure V, Panel D displays the RD plot for this outcome, which shows no evidence of a discontinuity.
In Online Appendix A, we show that the effect of the intervention on individual welfare is proportional to the change in placement rates, except as offset by declines in enrollment conditional on placement. Our findings suggest that there are no offsetting enrollment effects. The implication is that receiving the warnings intervention raises welfare (excluding search costs) for compliers with the information intervention by 21% (|$=\!\frac{0.15}{0.74}$|)—the per complier change in placement rate as a percentage of the below-threshold mean.19
V.D. Decongestion versus Reshuffling
The goal of our analysis is to understand how beliefs about admissions chances affect school search and placement outcomes from the perspective of individuals. However, it is also useful to think about how information on placement chances affects market-level congestion. If the warnings policy causes applicants to place in undersubscribed schools, the individual gains we observe may come “for free,” in the sense that other students are not displaced. Congestion effects are important to consider because beliefs interventions do not guide applicants toward specific schools. This contrasts with the provision of information on school attributes, which may point applicants toward oversubscribed schools.
We assess the congestion effects of the platform pop-up by looking at how receiving a warning affects placement rates at schools with excess capacity. As reported in Table II, Panel D, receiving a warning raises the chances that students add at least one undersubscribed school to their application by 7.3 percentage points. Put another way, roughly one-third of applicants adding at least one school add an undersubscribed school.
Most of the decline in application risk from receiving a warning comes from increased chances of placement in an undersubscribed school. Receiving a warning raises applicants’ chances of placing at an undersubscribed school by 1.9 percentage points. This corresponds to an 8.8 percentage point increase for compliers with the warnings policy, 57% of the overall risk reduction of 15.5 percentage points reported in Table II, Panel B. The warnings policy helps reduce congestion, a core goal of centralized choice (Abdulkadiroğlu, Agarwal, and Pathak 2017).
V.E. School Quality and Characteristics
In addition to affecting whether applicants place in schools they like, receiving risk warnings shapes the characteristics of the schools students attend. Table III and Figure V, Panels E–H report results from RD specifications with characteristics of the schools where students enroll as the outcomes of interest. Table III, Panel A reports that nearly all students on both sides of the cutoff enroll in some school (inside or outside the centralized process). The share of applicants for whom value-added measures are available is also stable across the cutoff. Differential censoring is not a concern.
RD Estimates of Platform Pop-Up Effects on Enrolled School Outcomes
| Pooled | |||
|---|---|---|---|
| Pooled | IV | E[Y|X = 0.3−] | |
| (1) | (2) | (3) | |
| Panel A: First stage and enrollment | |||
| Add any | 0.216 | 0.199 | |
| (0.010) | |||
| Enrolled | −0.004 | 0.966 | |
| (0.004) | |||
| Have value added measure|grade ≤ 8 | 0.014 | 0.753 | |
| (0.010) | |||
| Panel B: Attributes of enrolled school | |||
| Distance (km) | 0.050 | 0.239 | 3.022 |
| (0.243) | (1.158) | ||
| Value added|grade ≤ 8 | 0.022 | 0.103 | 0.138 |
| (0.011) | (0.051) | ||
| Per teacher spending (US$1,000) | 0.788 | 3.714 | 30.646 |
| (0.221) | (1.065) | ||
| Per student spending (US$1,000) | 0.002 | 0.007 | 2.245 |
| (0.015) | (0.071) | ||
| With copayment fee | 0.033 | 0.152 | 0.279 |
| (0.009) | (0.044) | ||
| School monthly fee (US$) | 2.016 | 9.237 | 21.839 |
| (0.815) | (3.778) | ||
| Share of vulnerable students | −0.006 | −0.029 | 0.567 |
| (0.003) | (0.013) | ||
| Total enrollment per grade | 8.621 | 39.467 | 98.981 |
| (1.699) | (7.964) | ||
| N to the left of the cutoff | 19,550 | 19,550 | |
| N to the right of the cutoff | 20,222 | 20,222 | |
Notes. Local linear RD estimates of platform pop-up effects. Computed using a triangular kernel with bandwidth 0.1. A heteroskedasticity-robust nearest-neighbor variance estimator with minimum of three neighbors is reported in parentheses; computed as in Calonico, Cattaneo, and Titiunik (2014). IV estimates in the second column report instrumental variable specifications where the endogenous regressor is the “add any school” indicator. The third column reports below-cutoff means of the variable listed in the row in the analysis sample. The sample for value-added outcomes is restricted to grades 8 and below. Reported sample sizes are counts of enrolling students. See Section V.E for discussion and Online Appendix D.4 for detailed variable definitions.
Our headline finding here is that receiving a risk warning improves school quality. Value added at the schools where students enroll rises by 0.022 student-level standard deviations across the cutoff. This corresponds to a 0.103 standard deviation increase for compliers. This is a large effect. For example, it is roughly comparable to a one standard deviation improvement in teacher quality (Chetty, Friedman, and Rockoff 2014) or one-half to one-quarter of the gains from attending a high-performing charter school (Abdulkadiroğlu et al. 2011). In our context, it is roughly equal to the difference in school quality between the schools that low-SES and high-SES students attend.
Measures of market demand, input intensity, and peer social status rise along with value added. Focusing first on demand measures, both price and quantity shift upward across the cutoff. Compliers with the warnings treatment are 15.2 percentage points (54%) more likely to enroll in schools that require some copayment, with the average monthly copayment rising by US$9 on a base of $22. Total enrollment per grade (i.e., quantity) rises by 39.5 students on a base of 99 students. Turning to the input side, mean teacher compensation rises by US$3,700, or 12%. Interestingly, spending per student is flat, suggesting that the high value-added, highly demanded schools that students shift toward do not necessarily spend more per student but do spend more efficiently. Finally, on the peer attributes side, compliers with risk warnings attend schools where the share of economically vulnerable peers is 2.9 percentage points (5.1%) lower. Distance from home to school does not change.
These findings support our revealed preference argument that warnings increase individual welfare. By facilitating search, the warnings treatment gives families the opportunity to make larger investments in their own education and avoid the small, low-price, low-quality schools associated with poor performance in voucher systems in Chile and elsewhere, including the United States (Abdulkadiroğlu, Pathak, and Walters 2018; Neilson 2021). Online Appendix H further explores the shifts in enrollment patterns that drive the observed increases in school quality.
V.F. Replication and Heterogeneity
The platform pop-up intervention increases search across markets. Online Appendix Figure B.XI describes the distribution of estimated effects over all markets (defined by city-year) and split by measures of market size. Looking across markets, modal values of treatment effects on adding any school and number of schools added are similar to the reported overall effects of 0.22 and 0.34, respectively. The cross-market interquartile range (IQR) of the estimated effect of treatment on adding any school is (0.11, 0.29), and, as reported in Online Appendix Table B.IV, effects in the three largest markets are each close to the nationwide average. Splits by market size, as measured by total number of available choice options and number of schools geographically close to an individual applicant, show that treatment effects on the add any school outcome are similar across different-sized markets but that treatment effects on the count of schools added are larger in larger markets.
The effects of risk warnings on beliefs might diminish as market participants gain experience with choice. To test this, Online Appendix Table B.V repeats Table II but splits the sample by the number of years a city-by-grade combination has used the centralized platform. Shifts in search and risk are similar for city-grade-years with one, two, or three or more years experience using the centralized platform. We see no evidence that the effects of the platform pop-up intervention decline as experience with choice rises. This is consistent with results in Kapor, Neilson, and Zimmerman (2020) showing large belief errors in a setting with a long history of choice.
Smart matching platforms affect both high- and low-SES applicants. Online Appendix Table B.VI repeats the analysis of Table II, splitting by economic vulnerability. Rates of application modification and risk reduction are slightly larger for economically vulnerable applicants. As reported in Online Appendix Table B.VII, attributes of enrolled schools shift for high- and low-SES students. Gains in VA are large for high-SES students and small (but noisily estimated) for others. Gains in teacher pay, enrollment per grade, and copayment fees, as well as declines in low-SES peer share, are all larger for low-SES applicants.
V.G. Warnings across the Risk Distribution
We use the random assignment of reminder message interventions to study how the effects of warnings about risky applications vary away from the 30% risk cutoff and on the intensive margin. In the 2020 choice process, randomly selected risky applicants received a WhatsApp text warning three days before the application deadline. Forty-four hours after that, on the day before the deadline, all risky applicants received the same warning through an SMS. In this context, what random assignment does is raise the number of warnings to which risky applicants are exposed between the time they first fill out their application and the application deadline. For nonrisky students (below the 30% risk cutoff) treatment and control status are randomly assigned, but the “treated” group does not receive a risk warning.
Figure VI presents the effects of the RCT by plotting outcomes for the treatment and control groups by application risk at the time of randomization into the text message treatment. Panel A shows that the number of warnings students receive (summing over all interventions) rises across the cutoff for both treatment and control groups, but rises more for the treatment group, which receives the additional WhatsApp message. The 0.48 difference in messages viewed for treatment relative to control among risky applicants reflects the share of applicants who opened WhatsApp and viewed the image.
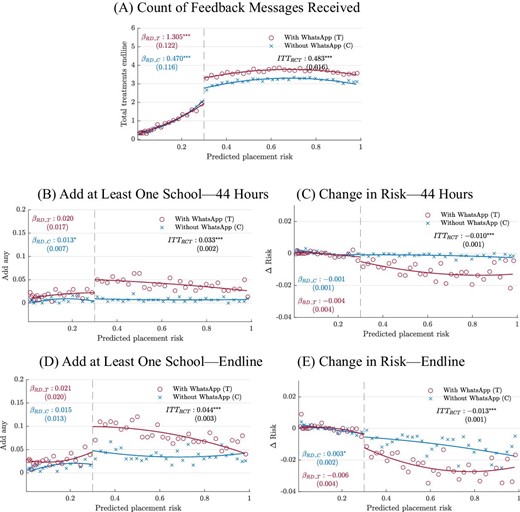
WhatsApp RCT Outcomes
Binned means and global fits of message receipt, application behavior, and risk outcomes by predicted placement risk in the RCT sample. Points are centered means of 50 quantile-spaced bins of the support of the predicted placement risk ∈ [0.02; 0.98]. Solid lines show the quadratic fit. The figures are split by RCT treatment and control group, above and below the treatment threshold. The “With WhatsApp” group receives the WhatsApp warning when above the cutoff. The “Without WhatsApp” group receives no warning. Below 0.30 predicted risk cutoff, the treatment group receives WhatsApp message with no risk-related information. Reported βRD coefficients are RD estimates within treatment and control group, computed from local linear specifications using ±0.1 bandwidth. See Section V.A for details. Because coefficients are local while polynomial fits are global, there may be minor differences between displayed fits and reported coefficients. Reported ITTRCT estimate is the experimental RCT effect for all above-cutoff students on the listed outcome. Outcomes, listed in panel titles, are as follows. Panel A: count of warning messages received over the full application period. Panel B: add any school in the 44-hour window between WhatsApp message and SMS followup. Panel C: change in risk within 44-hour window between WhatsApp message and application followup. Panel D: add any school between WhatsApp message and application close. Panel E: change in risk by application close. See Section V.G for details.
Figure VI, Panels B and C describe application behavior in the 44-hour window between the randomized message to the WhatsApp treatment group and the message to all risky students. Risky students randomly assigned to the WhatsApp treatment are more likely to add schools to their application and reduce their application risk than untreated students. On average, assignment to the treatment group causes 3.3% of risky students to add at least one school to their application. This corresponds to a 6.8 percentage point effect for each student who views the treatment image. These changes cause application risk to fall by 1.0 percentage points, or 2.1 percentage points per message view. The implied risk reduction for applicants who comply with the WhatsApp intervention by adding schools is 29.7 percentage points, equal to 49% of mean risk in the RCT sample.
Search and risk reduction outcomes in the treatment group outpace those in the control group over the full distribution of risk values above 30%. To facilitate comparison between RCT and RD estimates, Figure VI, Panels B and C display RD estimates for the WhatsApp treatment calculated across the risk cutoff within the treatment group. RD estimates are smaller than RCT estimates. We see little evidence that students near the 30% risk cutoff respond more to information interventions than applicants higher in the risk distribution.
Panels D and E repeat the analysis from Panels B and C, but now look at all application changes between the randomized warning and the application deadline. These measures include the effects of the final text reminder sent to all risky students. Despite the text message followup, gaps between treatment and control expand over time. As for the 44-hour outcomes, treatment-control comparisons span the full distribution of risk above the risk cutoff, except perhaps the very top. Average treatment effects in the RCT are larger for endline outcomes than for the 44-hour outcomes. Of students, 4.4% add a school to their application, and the mean risk reduction for these students is 30 percentage points.
Table IV summarizes findings from the RCT and RD analysis of the WhatsApp intervention. Treatment and control groups are balanced on observable characteristics. For choice outcomes, we present both ITT effects reported in Figure VI and IV estimates that take adding at least one school as the endogenous regressor of interest.
WhatsApp RD and RCT Results, 2020
| RCT | RD | |||
|---|---|---|---|---|
| ITT | IV | ITT | IV | |
| (1) | (2) | (3) | (4) | |
| Panel A: Balance | ||||
| Economically vulnerable | −0.019 | −0.012 | ||
| (0.006) | (0.039) | |||
| Panel B: Message receipt | ||||
| WhatsApp read | 0.466 | 0.528 | ||
| (0.005) | (0.030) | |||
| SMS reminder received | −0.028 | 0.459 | ||
| (0.004) | (0.034) | |||
| Total treatments before final SMS | 0.506 | 0.845 | ||
| (0.016) | (0.116) | |||
| Total treatments endline | 0.483 | 1.305 | ||
| (0.016) | (0.122) | |||
| Panel C: Outcomes in clean 44 hours before SMS followup | ||||
| Any modification | 0.035 | 0.015 | ||
| (0.002) | (0.017) | |||
| Add any | 0.033 | 0.020 | ||
| (0.002) | (0.017) | |||
| Schools added | 0.075 | 2.281 | 0.103 | 5.260 |
| (0.007) | (0.136) | (0.042) | (3.194) | |
| Δ Risk | −0.010 | −0.297 | −0.004 | −0.209 |
| (0.001) | (0.018) | (0.004) | (0.131) | |
| Panel D: Endline outcomes | ||||
| Any modification | 0.046 | 0.012 | ||
| (0.004) | (0.021) | |||
| Add any | 0.044 | 0.021 | ||
| (0.003) | (0.020) | |||
| Schools added | 0.112 | 2.550 | 0.138 | 6.681 |
| (0.011) | (0.175) | (0.065) | (4.764) | |
| Δ Risk | −0.013 | −0.301 | −0.006 | −0.307 |
| (0.001) | (0.022) | (0.004) | (0.206) | |
Notes. ITT and IV effects of the 2020 WhatsApp warnings intervention. RCT columns: effects of random assignment to the treatment group versus control group for students with predicted risk > 0.30. Robust standard errors are in parentheses. N = 17,970. RD columns: regression discontinuity evaluation in treatment group around 0.30 cutoff. RD specifications computed using a local linear fit with a bandwidth of 0.1. Standard errors are a heteroskedasticity-robust nearest-neighbor variance estimator with minimum of three neighbors, as in Calonico, Cattaneo, and Titiunik (2014). ITT column shows effects of group assignment. IV columns show the instrumental variable specification, where the endogenous regressor is the “add any school” indicator, instrumented with group assignment for the RCT, and with a dummy of crossing the risky threshold for the RD. Panel A: balance tests on predetermined characteristics. Panel B: message receipt. “WhatsApp read” is an indicator equal to 1 if applicant views the WhatsApp treatment message. “SMS remainder received” is an indicator for receiving an SMS reminder 44 hours later. Panel C: outcomes within the 44-hour window between WhatsApp intervention and follow-up SMS. Panel D: endline choice behavior and placement outcomes. See Section V.G for details.
Overall, compared with the platform pop-up, the share of compliers with the WhatsApp RCT is smaller. This makes sense given that the RCT population is negatively selected on the response to previous interventions. However, the percent reduction in risk per complier is similar, and the percentage point reduction in risk is larger.
We draw two conclusions from this analysis. The first is that the effects of warnings persist across the risk distribution. Online Appendix I provides additional evidence in support of this point from a 2017 pilot of the platform pop-up that included warnings cutoffs at 30%, 50%, and 70% risk levels. The second is that there may be benefits to providing the same person with information multiple times. The effects of information provision tend to be largest near the time of choice (Madrian 2014). Providing multiple reminders may raise the chances that one is received around the time applicants need it.
VI. Why Do Smart Platforms Work?
Smart platforms work. But why? Thus far, we have focused on the idea that the information intervention shifts students’ beliefs about admissions chances, which in turn leads them to engage in costly search for new schools. Our survey analysis showed that inaccurate beliefs and costly search are key features of applicants’ choice experiences. This section provides direct evidence that (i) the intervention operates by shifting beliefs and (ii) interventions that do not include personalized information are not as effective.
VI.A. Smart Platforms Change Beliefs, Not Preferences
Because our survey of placement beliefs took place after applications closed but before results were revealed, we can test the theoretical prediction that risk warnings shift beliefs by placing survey belief measures on the left side of our main RD specifications. Table V reports results from this test. Panels A and B show that receiving a risk warning does not affect the probability that applicants respond to our questions about subjective beliefs, and that respondents’ behavioral responses to the risk intervention are broadly similar to those in the population.
RD Estimates of Platform Pop-Up Effects on Subjective Beliefs
| 2020 | E[Y|X = 0.3−] | |
|---|---|---|
| (1) | (2) | |
| Panel A: Survey takeup and completion | ||
| Survey take-up | −0.020 | 0.173 |
| (0.010) | ||
| Answered expectation questions | −0.013 | 0.150 |
| (0.010) | ||
| Panel B: Application behavior in survey sample | ||
| Add any | 0.196 | 0.265 |
| (0.033) | ||
| Δ Risk | −0.016 | −0.027 |
| (0.008) | ||
| Panel C: Subjective beliefs | ||
| Subjective P(not assigned to any) | 0.036 | 0.165 |
| (0.017) | ||
| Subjective P(assigned to 1st) | −0.049 | 0.754 |
| (0.021) | ||
| Panel D: Stated preferences | ||
| Satisfaction if assigned to 1st choice (1–7) | −0.017 | 6.855 |
| (0.047) | ||
| N to the left of the cutoff | 1,381 | |
| N to the right of the cutoff | 1,500 | |
Notes. Local linear RD estimates of platform pop-up effects on survey-reported subjective beliefs. Computed using triangular kernel with bandwidth 0.1. A heteroskedasticity-robust nearest-neighbor variance estimator with minimum of three neighbors is reported in parentheses; this is computed as in Calonico, Cattaneo, and Titiunik (2014). The second column reports the below-cutoff means of the row variables. Panels B and C restrict the sample to applicants who completed the beliefs module of the 2020 survey. See Section VI.A for details.
Panel C reports how the intervention shaped beliefs. Applicants’ average subjective nonplacement risk rises by 3.6 percentage points (22%) across the cutoff. Because applicants who receive the risk warning add schools to their lists, the estimated mean effect here understates the true belief shift, holding the application fixed. Applicants’ subjective beliefs about placement in their first choice school fall by 4.9 percentage points (6.5%) at the cutoff. Because treatment does not cause applicants to alter their first choices and because admissions chances at the first choice do not depend on other features of the application, this estimate is closer to a “pure” beliefs effect. Both effects are visually apparent in standard RD plots. See Online Appendix Figure B.XII.
Our survey also provides evidence that the treatment does not change preferences. In principle, applicants might draw inferences about the quality of schools on their choice applications from information about demand for those schools. Table V, Panel D places survey levels of stated satisfaction with (hypothetical) placement at the first-listed school on the left side of the RD specifications. We see no evidence that preference for the first-choice school changes, even as beliefs about admissions chances decline. Although it is not possible to prove the null that the intervention had no effect on preferences, we view these results as a strong indicator that the intervention acts mainly by changing beliefs, rather than preferences.
VI.B. Behavioral Nudges, Costly Shoving, and Impersonal Information
1. Testing “Behavioral” Nudges
Nudge policies that encourage students to raise their placement chances by applying to more schools but do not include information about risk produce much smaller effects than smart matching platforms. In 2016, we worked with Mineduc to test a variety of behavioral nudges aimed at getting students to apply to more schools. These interventions were similar in format and timing to our later smart platform interventions but did not contain any risk information. Our goal was to test whether approaches from the behavioral nudge toolkit could shift students toward less risky applications. Online Appendix C reports implementation details.
We considered three kinds of nudges. The “more schools, higher chances” nudge gave applicants guidance that applying to more schools increases one’s chance of being placed. The “range heuristic” nudge told applicants that listing 5–10 schools increased one’s chances of being placed. The “role model” nudge told applicants that families who have submitted “good” applications typically listed five or more schools. Each option aimed to reduce the complexity of choice by providing guidance about how many schools to list. Because the interventions came from the choice authority (via SMS), they conveyed official approval for long lists. The second intervention adds to the first by providing a decision-making heuristic (Tversky and Kahneman 1974). The third augments the second with a social pressure/social identity message (Lavecchia, Liu, and Oreopoulos 2016).
None of these approaches worked. Table VI reports results pooling all of the behavioral nudge interventions and separately by treatment arm. In the full sample, the average effect was to raise the chance applicants added at least one school to their application by a statistically insignificant and economically small 1.5 percentage points. This is an order of magnitude smaller than the effects on the same outcome we observe in the smart platform interventions from 2017 and later. We observe similarly small effects when the sample is restricted to applicants with nontrivial application risk and when we look at each branch separately.
RCT Estimates of Behavioral Nudge Effects
| By message type | |||||
|---|---|---|---|---|---|
| More schools, | Range | Role | |||
| Pooled | Risk>0.01 | higher chances | suggestion | model | |
| (1) | (2) | (3) | (4) | (5) | |
| Add any | 0.015 | 0.027 | 0.006 | 0.008 | 0.031 |
| (0.009) | (0.018) | (0.012) | (0.012) | (0.013) | |
| N treatment | 1,402 | 479 | 463 | 455 | 484 |
| N control | 648 | 215 | 648 | 648 | 648 |
Notes. RCT effect estimates for behavioral nudge interventions conducted as part of the 2016 choice process. These interventions encouraged people to add schools to their lists but did not include information on nonplacement risk. The sample is limited to the Puntarenas region, which was the only region with centralized choice in 2016. Estimates are differences in the share of students adding any school to their baseline application between the treatment group and a control group that did not get any message. Columns (1) and (2) are pooled estimates of the treatments from columns (3)–(5). Column (2) limits the sample to applicants facing nonzero application risk. See Section VI.B and Online Appendix C for details.
These findings provide further evidence that the information that smart platforms provide is a key reason that they are effective. In fact, it was the failure of these initial behavioral nudges that motivated us to pilot smart platforms in the 2017 cycle.
2. Impersonal Information
The second type of alternate policy we consider is the provision of impersonalized information on application risk. The evidence we have presented so far shows that smart platforms work and that they shift applicants’ beliefs about their admissions chances. However, it does not show that smart platforms are the only way to shift beliefs. It may be possible to obtain similar effects using approaches that do not require personalized messages, such as providing information about aggregate nonplacement rates. To the extent that misperceptions of own application risk are rooted in misperceptions of average risk, our theoretical and empirical analyses thus far predict that aggregate information interventions could also be effective.
To test the value of personalized relative to aggregate risk warnings, we conducted a supplemental WhatsApp RCT in the 2021 application process. Randomly selected applicants above the 0.3 risk cutoff received a personalized risk warning with text similar to the platform pop-up intervention. The key addition in the 2021 RCT is that randomly selected applicants in the 0.2 to 0.3 risk range received a message identical to the main treatment but with a warning about aggregate as opposed to personal risk.20 We evaluate the effects of the aggregate information and smart platform treatments by comparing treatment and control groups in the relevant risk bins, and we assess the effect of personalized relative to aggregate information by looking at the discontinuity at the cutoff in the treated group. A point of contrast with the 2020 RCT is that applicants in the 2021 RCT sample universe were selected from a subgroup that did not receive the platform pop-up, so the WhatsApp message was their first risk warning. See Online Appendix C.3 for details. Online Appendix Figure B.XIII shows that predetermined covariates are balanced with respect to treatment.
Figure VII reports three key results. First, we replicate the 2020 WhatsApp RCT finding that the smart platform warning causes applicants to lengthen their lists.21 Second, we show that aggregate information also causes students to lengthen their applications, but the effect is about half as big as the smart platform effect. Third, the RD comparison of aggregate to personalized information interventions at the 0.3 risk cutoff confirms that the aggregate information effect is about half the size of the smart platform effect. Findings from both interventions support the central claim that risk information shapes application choices, and the comparison between them shows that personalization matters for policy efficacy.
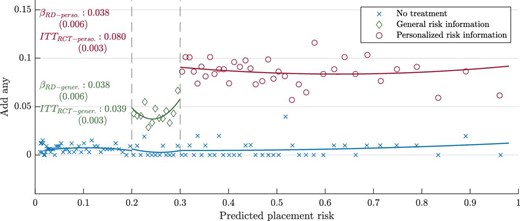
2021 WhatsApp RCT with Personalized and Aggregate Information Treatments
Results from the 2021 WhatsApp RCT. The outcome is adding any school to the choice application. Treatments are as follows. “No treatment”: control group that receives no WhatsApp message. “General risk information”: treatment group that receives information about nonplacement risk in aggregate, not personalized to own application. “Personalized risk information”: treatment group that receives information about own application risk, as in the 2020 WhatsApp RCT. βRD − general is the RD estimate of the general risk treatment group against the control group at the 0.2 cutoff. βRD − personal is the RD estimate of the personalized risk information treatment group relative to the general risk treatment group. ITTRCT − personal and ITTRCT − general are RCT estimates of treatment effects for the personal and general info treatments (respectively) relative to the control group in the same risk range. See Section VI.B and Online Appendix C.3 for design details and additional results. Reported RD coefficients and standard errors are from local linear specifications using ±0.1 bandwidth. See Section V.A for details.
3. Costly Shoving
The third type of alternate policy we consider is coercive nudges or “shoves” toward longer applications. These policies require students to list a certain number of schools on their application before they submit. Our costly search/limited information model predicts that shoves will produce low-quality matches. Applicants who are forced to add schools but believe they will be placed in a higher-ranked school may list schools they don’t know much about, take up spots in those schools, and then decline their placements. This contrasts with smart platform interventions that make clear to students that added schools are welfare relevant.
The distinction between coercive and search-inducing nudges is important. As described in Section III.A, the Chilean application system required many applicants to list at least two schools. Online Appendix Figure B.XIV compares enrollment rates for students who applied to two schools on their initial application to enrollment rates for students who initially applied to one and were forced to add a second school. Conditional on being placed to the first-choice school, enrollment rates for the two groups are similar. However, students who were forced to add a second school are 17% (10 percentage points) less likely to enroll in that school (if placed there) than students who added the second school voluntarily (and are placed in that school).22
These results contrast with findings from the smart platform intervention, where we see no difference in enrollment rates conditional on placement. The contrast supports our theoretical argument about the mechanisms underlying the smart platform intervention. Furthermore, because declined placements can produce market congestion, these findings also provide an argument for the efficacy of smart platform policies relative to plausible alternatives.
VII. Smart Matching Platforms in New Haven
In addition to our work in Chile, we partnered with the NGO and the New Haven, Connecticut school district to implement a warnings intervention during the 2020 choice process. The New Haven implementation of the smart platforms policy involved much smaller sample sizes than the Chilean implementation, but it incorporated both smart platform and encouragement-focused nudge arms. It provides additional evidence on the cross-setting generalizability of smart platforms and on the comparison between smart platform and behavioral nudges.
New Haven is a medium-sized school district that has used centralized choice since the mid-1990s. Starting in 2019, New Haven adopted a truncated deferred acceptance assignment mechanism. See Kapor, Neilson, and Zimmerman (2020) and Akbarpour et al. (2020) for institutional details.
The warnings policy in New Haven was broadly similar to the policies implemented in Chile. The application window opened at the end of January with a deadline of March 2. Seven days before the deadline, the district identified applications with a nonplacement risk of greater than 50% as risky. Application risk was computed using data from the previous year.23 All applicants identified as risky received an email stating they were at risk of nonplacement. The email included a link to a website where they could input hypothetical applications and view the chances of admission at each school, again based on the previous year’s data.24
The New Haven policy differed from the Chile policy in two important ways. The first is that in addition to warning all risky applicants, the district selected a randomly chosen 50 percent of nonrisky applicants to receive an email that provided a recommendation to learn more about admissions chances by visiting the same application simulator website. This encouragement nudge intervention did not include information on application risk. The second contrast is sample size: in Chile, 233,768 students received a warning about a risky application. In New Haven, the number was 740. This substantially reduces statistical precision.
Figure VIII presents a visual summary of our findings in New Haven. These graphs plot the rate at which students make different kinds of application changes in each 10 percentage point bin of the predicted risk distribution, with additional bins for risk values of 0 and 1. We display these statistics for 2020 applicants, who received a warning email when predicted risk was 50% or higher, and for a comparison group of 2019 applicants, who did not receive a warning regardless of risk score.25 For nonrisky applicants in 2020, the graphs split out the set of applicants who received the encouragement prompt from those who were not contacted.
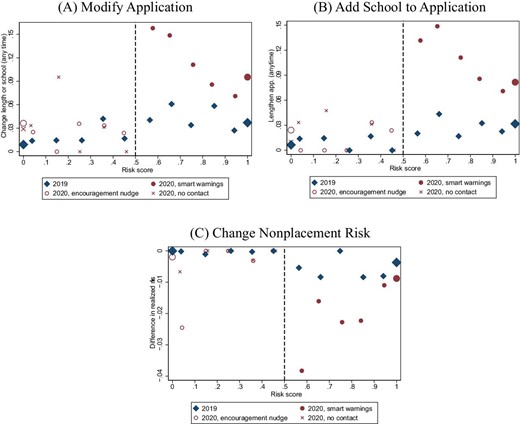
Smart Warnings and Encouragement Nudges in New Haven
Outcomes of the warnings intervention in New Haven’s centralized choice system. Panels show changes in application behavior by risk score as of seven days prior to application deadline in 2019 and 2020. Points are centered binned means within intervals of width 0.1, except for top- and bottom-most points, which are for students with risk scores of 1 and 0, respectively. In 2020, all applicants with risk scores above 0.5 received the warnings intervention. Randomly chosen applicants with risk scores below 0.5 received an encouragement nudge (a nonpersonalized message encouraging them to learn more about their assignment chances); the remaining nonrisky applicants received no intervention. In 2019, no applicant received any intervention. Panel A: any change in application. Panel B: lengthen application. Panel C: change in risk from initial to final portfolio. See Section VII for details.
Figure VIII, Panel A shows results for application modification. Rates of application modification for low-risk applicants were similar in 2019 and 2020. In 2020, we observe a large jump in rates of modification at the 50% cutoff for the warning treatment, with no similar increase for the 2019 comparison group. As shown in Panel B, almost all of these changes involve lengthening the application. As shown in Panel C, the effect of these additions is to reduce application risk. RD estimates reported in Online Appendix K show that crossing the threshold causes 13.8% of applicants to add at least one school to their application and that compliers with the warnings policy reduce their application risk by 23.2 percentage points, or 42% of below-threshold mean ex post risk. The encouragement nudge does not affect search in any panel: the nudge and no contact series track each other at all tested values of risk.
These findings add to our findings from Chile in two ways. First, they show that information on admissions chances is an important input to choice behavior in a variety of contexts. Second, they provide further evidence that the “smart” part of smart matching platforms is important to their efficacy at expanding search.
To conclude our discussion of generalizability across settings, we highlight a simple statistic. In both Chile and New Haven, we conducted surveys asking applicants what information would be helpful in filling out their applications. Roughly 90% of respondents in both settings said they needed information on admissions chances. See Online Appendix Figure B.XV for details.
VIII. Conclusion
This article shows that beliefs about admissions chances are a key determinant of the way applicants search for schools in centralized choice systems, that optimism about school placement chances leads applicants to search too little, and that the smart matching platforms which build live feedback on application risk into the choice system increase search, reduce nonplacement risk, and help students enroll in better schools.
The main implication of our findings is that policy makers seeking to reduce the burden school choice places on participants need to choose a strategy-proof assignment mechanism and provide choice supports that aid with search for schools. The strategic challenges posed by school search are central to families’ experiences of school choice even when the centralized assignment mechanism is strategy-proof.
The smart matching platforms we propose and evaluate are an effective and generalizable approach to reducing the burden of school search. Critically, smart platforms are not researcher-driven proofs-of-concept, which often decline in effectiveness when taken to scale (DellaVigna and Linos 2022). They are products already at scale. At the time of this writing, policy makers in Brazil, Peru, and Ecuador are in the process of implementing the techniques we discuss herein. The close collaboration between researchers, policy makers, and implementation partners that made this work possible may be a useful approach for conducting scalable interventions in other domains.
Data Availability
Code replicating the tables and figures in this article can be found in Arteaga et al. (2022) in the Harvard Dataverse, https://doi.org/10.7910/DVN/VCXL6A.
Footnotes
We thank Joseph Altonji, Francisco Gallego, Paul Goldsmith-Pinkham, John Eric Humphries, Karthik Muralidharan, Nick Ryan, Modibo Sidibe, and seminar participants at NYU Economics/Stern, UCSD, Yale, Duke, the 2021 AEA meetings, and the NBER Economics of Education workshop for comments and suggestions. We thank Isabel Jacas, Jan Knuf, Manuel Martinez, Cecilia Moreira, Fernando Ochoa, and Eric Solomon for research assistance. We thank JPAL-LAC and the implementation team of data scientists and developers at ConsiliumBots for their help throughout the project. We thank Claudia Allende for her support in survey design and implementation. We thank the government partners that made this research possible, in particular the leadership at the Sistema de Admission Escolar (SAE) of the Ministry of Education in Chile and the Office of School Choice and Enrollment at New Haven Public Schools (NHPS).
In addition, Grenet, He, and Kübler (2021) model information acquisition in college choice. Bobba and Frisancho (forthcoming) and Tincani, Kosse, and Miglino (2021) consider how college applicants learn about their own abilities.
In the empirical settings that we consider, admissions outcomes are determined by lotteries which are independent across schools. In principle, additional uncertainty about the general number of seats or level of demand might induce correlation in beliefs within a portfolio. For instance, rejection by school j might indicate that demand for some other school k was higher than the student had believed. In practice, school choice applicants seem to exhibit “correlation neglect” (Enke and Zimmermann 2019; Rees-Jones, Shorrer, and Tergiman 2020).
Suppose that, at constant cost |$\tilde{\kappa }> 0$|, students may discover a new school with utility distributed according to |$\tilde{F}_u(\cdot )$| where |$\tilde{F}_u(0)>0$|. Because search costs are sunk, if the expected benefit of finding a new school exceeds the cost at consideration set |$\tilde{C}_0$| and cost |$\tilde{\kappa }$|, but the school that was found is unacceptable, it is worthwhile to search again. In expectation, the applicant will have to conduct |$\frac{1}{1-\tilde{F}_u(0)}$| searches to discover a school with positive utility. Define |$F_u(u) = \tilde{F}_u(u | u>0)$| and |$\kappa = \frac{\tilde{\kappa }}{1-\tilde{F}_u(0)}.$|
We adopt the convention that when h > l, we have |$\prod _{j=h}^l x_j = 1$| and |$\sum _{j=h}^l x_j= 0$| for any xj.
The remaining 7% of PK-12 students enroll in expensive private schools that do not accept vouchers or in schools where the highest grade is kindergarten. These schools do not participate in the centralized process.
Alumni priorities are for students who want to return to a school they previously attended. Schools also use quotas for vulnerable students and, in a very small number of cases, for high-performing students.
Students applying in zones with more than one option who are either entering the schooling system from outside or enrolled in a school that does not offer the next grade must list a minimum of two schools.
See Online Appendix D for a discussion of our data sources.
The census definition of urban areas includes (primarily) all settlements with more than 2,000 inhabitants. We define applicants’ geographic zone based on the location of their first-choice school. Individual geocoding is unreliable for a large portion of applicants, whereas school locations are known precisely.
See Online Appendix Table B.I for details on the changes students make to their applications.
Applicants who do not participate in the first round are not included in our analysis.
Demand predictions for early applicants in 2020 relied on data from the previous year. We did not have previous year demand data for students applying to nonentry grades in the metropolitan region, hence the pop-up was activated later for them (9% of total 2020 applicants). See below and Online Appendix F.
In addition to high application risk, the NGO imposed other restrictions on the sample universe for RCT randomization. To be RCT eligible, applicants needed to be (i) early-grade applicants in (ii) urban zones who (iii) did not have access to sibling priority. In addition, they (iv) had to have declined engagement with previous Mineduc outreach attempts (unrelated to application risk) sent via email. See Online Appendix C.3.
See Online Appendix E for a detailed discussion of interactions between treatment types.
Schools in this question were selected from the alternatives within 2 km from the residential location of the student that were not included in her application. We used the performance classification of the Agencia de la Calidad de la Educación, an institution that classifies schools in four tiers using standardized test scores, after taking into account SES of the student body. We classify a school as “high performing” if it is in the top two tiers and “low performing” if it is in the worst tier. “Expensive schools” are those that charge a monthly copayment of at least US$35 on top of the voucher.
We report estimates obtained with Calonico, Cattaneo, and Titiunik (2014) bandwidth selection in Online Appendix Table B.III and Figures B.VII– B.X. Alternate approaches to RD estimation do not change our findings.
These calculations compare students across the RD threshold. Hence, although applicants who add a school are a subset of those who alter an application, treatment effects need not be ordered in this way. The estimated share induced to add a school is slightly larger than the share induced to make any change because a slightly larger fraction of “control” students change their applications without adding schools.
Online Appendix Figure B.VI displays this plot and plots for other outcomes not shown in the main text.
The IV estimate of the Δ risk effect reported in Table II is 0.15; 0.74 is the mean placement rate at the risk cutoff, computed as the intercept term from our main RD specifications with placement probability as the outcome. Note that placement chances at the risk cutoff are slightly above 0.7. This is because the running variable in the RD is the simulated risk of the initial application, while the placement chances outcome is the true risk of the final submitted application.
That is, we targeted the aggregate treatment using personalized information. The goal was to avoid scaring low-risk applicants. Improved targeting is a benefit of smart platforms that we abstract from here.
The behavioral effects of smart platforms in 2021 were roughly twice as big as in 2020, consistent with the ideas that (i) the first risk warning changes behavior more than subsequent warnings, and (ii) messaging interventions can have large effects on choice behavior when the messages are well formulated.
“Placeholder” schools show up in other choice contexts. In Ghana, 20% of students add repeat or nonexistent programs to satisfy length requirements (Ajayi and Sidibe 2021; correspondence with Modibo Sidibe).
The district focused on major choice grades, where choice probabilities are relatively stable across years. Two schools opened in 2020. Risk scores were not computed for applicants to these schools.
See Online Appendix K for a detailed description of the intervention procedures in New Haven, the distribution of application risk, and the relationship between our risk simulations and realized application risk.
We compute predicted risk for 2019 applicants using a snapshot of predicted risk status as of seven days prior to the admissions deadline. This procedure parallels our approach to identifying risky applicants in 2020.
