


Abstract
The opioid overdose crisis is driven by an intersecting set of social, structural, and economic forces. Simulation models are a tool to help us understand and address thiscomplex, dynamic, and nonlinear social phenomenon. We conducted a systematic review of the literature on simulation models of opioid use and overdose up to September 2019. We extracted modeling types, target populations, interventions, and findings; created a database of model parameters used for model calibration; and evaluated study transparency and reproducibility. Of the 1,398 articles screened, we identified 88 eligible articles. The most frequent types of models were compartmental (36%), Markov (20%), system dynamics (16%), and agent-based models (16%). Intervention cost-effectiveness was evaluated in 40% of the studies, and 39% focused on services for people with opioid use disorder (OUD). In 61% of the eligible articles, authors discussed calibrating their models to empirical data, and in 31%, validation approaches used in the modeling process were discussed. From the 63 studies that provided model parameters, we extracted the data sources on opioid use, OUD, OUD treatment, cessation or relapse, emergency medical services, and death parameters. From this database, potential model inputs can be identified and models can be compared with prior work. Simulation models should be used to tackle key methodological challenges, including the potential for bias in the choice of parameter inputs, investment in model calibration and validation, and transparency in the assumptions and mechanics of simulation models to facilitate reproducibility.
Abbreviation
- ABM
agent-based model
- IDU
injection drug use/users
- MOUD
medications for opioid use disorder
- NSDUH
National Survey on Drug Use and Health
- OUD
opioid use disorder; SD, system dynamics
INTRODUCTION
Opioid use is one of the leading public health concerns in countries across the world. In 2017, opioid use accounted for almost 80% of the 42 million years of life lost to disability and premature death, and 66% of the estimated 167,000 deaths attributed to drug use disorders (1). The problem is particularly acute in the United States, where more than 50,000 people died of an opioid overdose in 2019 (2). This represented a 4.9% increase in the overdose death rate from 2018, and it was 3.6 times higher than in 1999 (2, 3). Provisional data suggest that the problem has only worsened since the start of the COVID-19 pandemic: syndromic surveillance by the Overdose Detection Mapping Application Program, including data provided by agencies in 47 states, indicated an 18% increase in suspected overdose submissions from March 19 to May 19, 2020, in the United States, after the beginning of stay-at-home orders, compared with January 1 to March 18, 2020 (4).
The opioid overdose crisis is driven by a complex system of social, structural, and economic forces and individual behaviors (5). Supply forces include the increase in prescriptions of opioids for acute and chronic pain, increase in the supply and decline in the price of heroin, and introduction of illegally manufactured synthetics to the drug market, which are cheaper and 30–40 times stronger than heroin (6, 7). Demand forces include, among others, regional decline in industry activity and weakened institutional protections for worker rights, safety, and benefits, which have led to increasingly precarious employment and wage stagnation; demoralization among people facing unemployment or high-risk, poorly paid work; and increased rates of job-related injury and disability (8, 9). After the start of the COVID-19 pandemic, the stress of lives lost to COVID-19, economic hardship, social isolation resulting from pandemic mitigation measures, and potential reduced access to medication for opioid use disorder (MOUD) may have further contributed to the increase in opioid misuse and overdose risk (10, 11). Such a complex set of factors interacts in nonlinear ways to shape the different phases of the epidemic (6, 7, 9, 12, 13). The opioid overdose epidemic is dynamic in space and time. The epidemic was once characterized by overdoses involving prescription opioids; it now has shifted to one characterized by heroin and illegally manufactured synthetic opioid overdoses (14, 15). In the United States, for example, opioid overdose deaths were first concentrated in states with large rural areas such as Kentucky, West Virginia, and Ohio; in more recent years, however, the number of opioid overdose deaths increased exponentially in the Northeast and Western regions (16). These complex, dynamic, and nonlinear features of the opioid overdose crisis make it more difficult to predict and explain the epidemic.
Simulation models are a critical tool to identify and understand a complex, dynamic, nonlinear, social phenomenon such as the opioid overdose crisis (17). The process of building systems-level simulation models forces us to be clear about our assumptions regarding the way systems interact, the availability and quality of data, the way interventions work, and their potential barriers. Simulation approaches can efficiently combine a wide variety of data sources to deliver quantitative results to inform policy. The types of simulation models range widely. They include statistical simulation approaches such as Markov models, which are stochastic models used to model transitions across states, assuming that future states only depend on the current state (18). They also include computational simulation approaches such as system dynamics (SD) models (19) and agent-based models (ABM) (20, 21), which use computer-based algorithms to model nonlinear relations and feedback processes between units, within and across levels, so small changes in the system can produce emergent properties that are not predicted by individual elements of the model. A classic example of emergence was proposed by Schelling (22, 23), who used a checkerboard model that assigned households preference for a certain fraction of their neighbors be the same race to illustrate that population patterns of racial residential segregation emerge that are more extreme than would be predicted from individual preferences. Simulation models have been used to predict and forecast, model potential impacts of intervention and prevention, and assess the risks and benefits of different intervention strategies (24–26).
In the case of the opioid overdose crisis, simulation models can be used to answer a range of questions. First, simulation models can capture nonlinear interactions between multiple potential predictors of overdose risk, screen out factors that are not predictive of overdose risk, and potentially provide more accurate predictions of the types of drug products, population groups, and geographic areas that can be anticipated to experience an increase in overdoses. Second, they can be used to test assumptions about the underlying mechanisms that give rise to the population distribution of opioid misuse and its consequences, including the roles that availability, accessibility, physical properties of the drug product, and societal sources of demand play in shaping opioid misuse trajectories. Such insights can be critical information to inform the design of prevention programs and policies. Third, simulation models can help predict the types of intervention and policy approaches with the greatest potential to reduce overdoses, in the future, or in new locations, and conduct economic evaluation (e.g., cost-effectiveness analysis) of different types of approaches.
As simulation models to answer questions about opioid misuse proliferate, it is important to assess the scope of research in this area and to investigate the quality and reproducibility of simulation model–based studies of opioid misuse. To this end, we conducted a systematic review of the literature on studies in which researchers developed or used simulation models of opioid misuse. We aimed to provide an overview of the types of questions, simulation models, data sources, and calibration and validation approaches that have been used to address questions related to opioid misuse. We also created a database of model parameters that have been used for model calibration to aid comparative assessment of model findings. Finally, we evaluated study transparency and reproducibility, using a set of previously validated criteria (27, 28). Although a scoping review has been published in which authors mapped the literature that used simulation models to evaluate or propose policies to address the opioid epidemic (29), and authors or 2 systematic reviews synthesized cost-based analyses of interventions (30, 31), no studies have been conducted yet, to our knowledge, that included the broader range of simulation studies of opioid misuse or provided a critical evaluation of the transparency and reproducibility of reviewed studies.
METHODS
Search strategy
We first searched PubMed for articles that fit our criteria for simulation models. Starting on September 25, 2019, we searched for nonanimal research published (in print or electronically) in English before September 1, 2019. The following Medical Subject Heading terms were used in the PubMed search: (analgesics, opioid, heroin, naloxone, methadone, opioid-related disorders, prescription drug misuse, OR fentanyl) AND (computer simulation/(education; economics; methods; statistics and numerical data; supply and distribution), Markov Chains, OR systems analysis). The 5 Medical Subject Heading term categories of “computer simulation/[]” ensured the inclusion of a wide range of simulation modeling approaches (e.g., ABM, SD, compartmental, microsimulation).
Study inclusion criteria included: 1) use of a simulation modeling approach; and 2) a stage on the pathway from opioid use to overdose (i.e., opioid use, misuse, disorder, medication for opioid use disorder (OUD), or overdose) is either a) directly being modeled or b) an integral part of a model describing a nonopioid-related health outcome. No geographic exclusion criteria were applied to the review. Decision tree and regression analyses were excluded because these approaches do not explicitly include recursive events and data simulation, respectively.
To ensure all relevant journal articles were included, these same terms were then used to search for literature in the Embase and EBSCOhost databases. Conference proceedings and reports are not indexed in these databases; therefore, we also included models we found through citations or via supplementary search in Google Scholar, using the same inclusion criteria.
Data extraction
Each study that met the criteria was read in full by 2 of 4 researchers (A.H., C.D., N.K., C.W.). The reviewers extracted study information including model type, target population the model is simulating, research question, data sources used to model the simulated populations and interventions, validation and calibration approaches, and findings. For the purpose of data extraction, we defined calibration as an iterative process that entails adjusting model inputs to ensure model outputs match empirical results or expert opinion for a given setting, and we defined validation to mean that the model is acceptable for its intended use based on specified requirements.
If studies included model parameters, then those values were extracted as well. We included model parameters that referred to opioid use, OUD, opioid use treatment, emergency medical services, fatal and nonfatal opioid overdose, relapse, and death. We recorded the source, value, and unit for each parameter.
Calibrated model parameters
Calibrated model parameters were extracted from each article that reported them in the main text or in the appendix. Model parameters were considered calibrated if they were used as inputs to the main model but were derived either via optimization or hand-calibration techniques using data collected by the authors or expert opinion. After the extraction, the model parameters were aggregated, and similar parameters were grouped to draw comparisons between values from different models with different underlying assumptions. In cases where model parameters measured the same phenomena across 2 separate models but were presented using different units, the parameters were standardized against 1 common unit, and the most interpretable and commonly used unit was chosen where possible.
Assessment of model transparency and reproducibility
Twenty-five criteria were preselected that comprise the minimum elements needed to evaluate the transparency and reproducibility of simulation models (27). To qualify articles on the basis of whether they met these criteria, 2 researchers (C.D. and C.W.) conducted an initial pilot test on a sample of articles, each evaluating each criterion for each report and then resolving differences in criteria evaluation; resolution was mediated by a third researcher (A.D.H.). After the pilot test, 2 researchers (C.D. and C.W.) each evaluated half of the articles independently. Criteria were marked as “met” or “not met” in a data-extraction sheet on the basis of whether the article fulfilled each assessment criterion.
The assessment criteria were divided into 3 categories: development, testing, and analysis. Development criteria included the following: problem clearly defined; modeling method specified; software used reported; modeling objective explicit; modeling scope and boundary clear; conceptualization of the model clear; high-level visualization available; model assumptions disclosed; input parameter values and data sources disclosed; model equations provided; stakeholder engagement described; explicit instructions for replication; and modeling codes provided. Testing criteria included the following: model calibration and parameter estimation performed and described; model evaluation other than calibration and sensitivity analysis performed and described; and quantitative quality-fit calibration to external data reported. Finally, analysis criteria included the following: quantitative results of analysis reported; sensitivity analysis performed and described; policies and intervention strategies discussed; analysis results connected to structural characteristics; research limitations discussed; generalizability of findings discussed; and comparison made with other results. Disclosed sources of funding and conflicts of interest were also assigned point values outside of the predefined categories.
Each article’s cumulative score was determined by summing the binary values for the 25 criteria, for a final score ranging from 0 to 25. Two researchers (C.W. and C.D.) conducted an initial pilot test to ascertain agreement percentage of assigned score values. After conflict resolution, each researcher assessed half of the articles independently.
RESULTS
Study selection
Our search results yielded 1,360 articles, which were imported into the Covidence platform (Covidence.org) along with 38 papers added after supplementary search. After duplicates were removed, 2 reviewers (A.D.H. and J.S.-T.) screened 798 studies. The reviewers discussed any studies that did not reach consensus and made a final decision; 134 studies were included in a full-text assessment. Of the remaining studies, 46 were excluded for irrelevant study design (i.e., did not meet criteria for the simulation model) and outcome (i.e., did not include any information on the pathway of opioid addiction). This left 88 studies for inclusion in the final review. Figure 1 shows the Preferred Reporting Items for Systematic Reviews and Meta-Analyses diagram, which illustrates the inclusion and exclusion process (32).
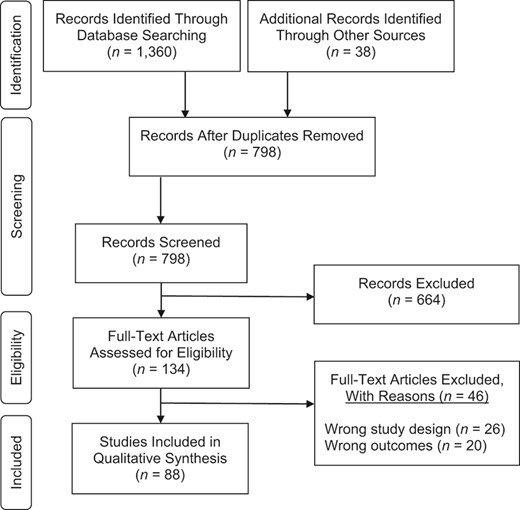
Preferred Reporting Items for Systematic Reviews and Meta-Analyses diagram for study selection.
Descriptive characteristics of studies
Extracted data from the 88 studies, including model details, data sources, calibration and validation approaches, and findings, can be found in Web Table 1 (available at https://doi.org/10.1093/aje/mxab013).
Model type.
Different approaches were used in the included studies to model the opioid epidemic. The most frequently used approach was compartmental modeling (n = 32; 36%) (33–64), which included deterministic compartmental (33, 34, 43, 45, 47, 48, 53, 56, 59, 60) and dynamic compartmental (35–42, 49, 50, 52, 54, 57, 58, 61–64) models. In these models, probabilities were defined by groups on the basis of a specific criterion (i.e., drug use status, sex, age). The second most frequently used approach was Markov models (n = 18; 20%) (65–82), including Markov chain (67, 68, 82, 69, 75–81), semi-Markov cohort (71, 72), Markov process (68, 69), decision-analytical Markov (65, 66), and 2-state Markov (73, 74) models. In these models, health states were modeled with the assumption that future states rely on the current state, and transition probabilities were mainly included at the population level but sometimes also at the individual level. SD and ABM were the third (each n = 14; 16%) most frequently used models. SD models use a series of stocks and flows and feedback loops to model the opioid epidemic at a population level (83–96). ABMs use calculated probabilities at the individual level (97–110). The rest of the 10 models included ordinary differential equations transmission (111–113), Monte Carlo simulation (114, 115), discrete-event simulation (116), and decision-analytic (117–119) and microsimulation (120) models.
Research questions.
The types of research questions used to motivate the simulation modeling studies included evaluating the impact of increases in OUD treatment (n = 31) (34, 35, 58, 60–65, 67, 71, 72, 38, 73–75, 80, 81, 83, 85, 96, 112, 115, 42, 119, 45, 46, 48, 49, 51, 56), harm reduction and prevention (n = 12) (37, 39, 111, 116, 40, 52, 54, 59, 90, 94, 95, 110), including naloxone distribution (n = 9) (66, 68, 77–79, 82, 100, 117, 118), adjusting prescribing patterns (n = 10) (41, 69, 76, 84, 86, 87, 89, 92, 101, 104), or educational prevention programs (n = 2) (35, 93). If studies did not involve simulating a specific intervention, their research question was focused more broadly on understanding specific drug markets (n = 7) (36, 99, 103, 107–109, 114) or a model was created to be used to answer a series of research questions (n = 9) (33, 55, 70, 88, 91, 97, 98, 106, 120) or used as a validation tool (105). These research questions were often answered through a cost-effectiveness analysis (n = 35; 40%) (35, 37, 59, 61–64, 66, 67, 69, 71, 72, 40, 73–78, 80–82, 96, 41, 115, 117–120, 42, 45, 51, 52, 56, 57).
Geographic target population.
Simulation models can be used to examine dynamics at any population size, ranging from a small network of individuals in a neighborhood to an entire country. Regardless of the modeled population size, the goal of simulation models can be to model dynamics within a specific geographic region, which is known as a geographic target population. In a majority of the included studies (n = 41; 47%), researchers modeled aspects of opioid misuse at the national level, including Australia (36, 43, 44, 60, 85), China (114), Canada (83), and the United States (33, 35, 84, 86, 87, 89, 90, 92–94, 115, 118, 63, 119, 64, 69, 73, 76, 78, 80, 81) Opioid misuse was modeled at the local level in many studies (n = 40; 45%), with researchers looking at dynamics within countries, states, and cities. A geographic target population was not specified in the remaining 7 studies (8%).
Data sources
Simulated population data.
Data to characterize the target population came from sources ranging from national surveys, such as the US Census or National Survey on Drug Use and Health (NSDUH), to vital statistics data (the US Centers for Disease Control and Prevention’s CDC WONDER), to published literature or small cohort studies or ethnographic data.
Intervention data.
Data from published literature, often from clinical trials or literature reviews, were used in a majority of the studies that modeled policy changes or MOUD-related interventions (n = 50; 68%) (33–35, 37, 39, 40, 45, 56, 59, 60–65, 68–74, 76–78, 80–84, 88, 90, 95, 96, 101, 110, 116–119, 120), including interventions expanding needle exchange programs, methadone maintenance programs, and street outreach programs. Primary data sources were used to parameterize intervention measures in more than one third of the studies (n = 29; 39%) (33, 38, 41, 42, 66, 68, 69, 75, 79, 82, 84–87, 89, 91, 93, 94, 109, 115, 120), including NSDUH (75, 86, 87, 89, 93, 94, 115), which was often used to parameterize interventions related to reducing opioid initiation and opioid misuse.
Calibration and validation approaches
Calibration.
In a majority of the studies (n = 55; 62%), researchers described calibrating their models to prevalence or incidence of empirical data (34, 35, 37, 38, 44, 48–59, 61–64, 69, 75, 77–79, 83, 84, 86, 87, 89, 90, 92–96, 99, 101, 102, 105, 107–115, 118–120). Of these studies, 5 reported specific calibration methods such as Bayesian inference (68, 79), random search algorithm (35), step-wise approach (114), maximum likelihood estimation, or other search algorithms (e.g., evolutionary, swarm, tunneling, annealing) (101). These calibration approaches used either statistical (e.g., Bayesian inference and maximum likelihood estimation) or computational (e.g., random search algorithm, step-wise approach) techniques to adjust model inputs or to identify 1 or more sets of models out of many possible models. We provide in Web Table 1 additional details of calibration approaches for each study in which specific calibration methods were reported.
Validation.
In almost one third of the articles (n = 28; 31%), authors discussed validation approaches used in their modeling assumptions (33, 36, 38, 41, 42, 51, 57–59, 61, 62, 66, 68, 71, 72, 77, 82, 87, 89, 95, 101, 102, 112, 113, 115, 116, 120). Multiple types of model validation were conducted across these studies, including internal and external validation, face validation using subject matter experts, cross-validation techniques, and comparing behavior and output from the model to either real-world data or data generated from another model. In several studies, calibration, but not model validation, was conducted. Also, the 2 terms tended to be conflated in some studies and, therefore, it may be difficult to ascertain which of these 2 critically important model-building steps had been conducted across the studies we identified in this review.
Model parameters
The studies ranged in what aspect of the opioid epidemic were examined, so we extracted parameters that focused specifically on the pathway of opioid addiction from opioid misuse (i.e., nonmedical prescription opioid, heroin, and injection drug use (IDU)) to OUD to overdose and death, as well as opioid-related treatment (e.g., MOUD, naloxone) and relapse. From the 63 studies in which authors provided parameters in these areas of interest, we extracted 1,303 inputs that resulted in 787 unique parameters. Of the 1,303 inputs, 71% came from literature, 19% came from direct data sources (6% extracted from data reports, 3% from NSDUH, 1% from CDC WONDER), and 10% were calculated, assumed, or calibrated by the authors. Authors of the remaining 28 studies reported results from their models but either did not give information about how their models were parameterized or the parameters they reported were not on the pathway of opioid addiction.
Opioid misuse and OUD had the highest rates of parameterization using primary data sources (e.g., NSDUH or national and local cohort studies) at 32% and 21%, respectively, and treatment variables had the highest rate of being calculated, assumed, or calibrated by the authors (22%). The breakdown of each variable type by data source used to parameterize it can be found in Table 1, and the studies in which each source was used are listed in Table 2. All extracted opioid-related variables, their sources, and values are in an online database hosted by the authors on Github (https://github.com/avahamilton/OpioidSimulation_SR).
Model Parameters and Sources, by Frequency of Source
| No. of Parameters (n = 1,303) | Data | Literature, % | Author Decisions | ||||||
|---|---|---|---|---|---|---|---|---|---|
| Parameter Type | NSDUH, % | CDC WONDER, % | Reportsa,% | Other Primary Data Sourcesb, % | Calibrated, % | Assumed, % | Calculated, % | ||
| MOUD treatment | 212 | 0.90 | 0.00 | 7.10 | 4.70 | 63.20 | 3.30 | 9.40 | 11.30 |
| Naloxone | 49 | 0.00 | 0.00 | 0.00 | 0.00 | 87.80 | 6.10 | 2.00 | 4.10 |
| Heroin use | 17 | 29.40 | 0.00 | 5.90 | 0.00 | 58.80 | 5.90 | 0.00 | 0.00 |
| Injection drug use | 386 | 2.10 | 0.00 | 8.50 | 18.70 | 57.50 | 1.00 | 6.00 | 6.20 |
| Recreational PO use | 26 | 50.00 | 3.80 | 7.70 | 3.80 | 34.60 | 0.00 | 0.00 | 0.00 |
| OUD transition | 163 | 0.00 | 0.00 | 1.80 | 4.30 | 93.30 | 0.00 | 0.00 | 0.60 |
| OUD | 39 | 17.90 | 2.60 | 0.00 | 0.00 | 74.40 | 0.00 | 5.10 | 0.00 |
| Emergency medical services | 31 | 0.00 | 0.00 | 12.90 | 0.00 | 83.90 | 0.00 | 0.00 | 3.20 |
| Fatal or nonfatal overdose | 75 | 0.00 | 0.00 | 1.30 | 1.30 | 81.30 | 0.00 | 1.30 | 14.70 |
| Mortality ratec | 116 | 0.00 | 9.50 | 11.20 | 4.30 | 69.80 | 0.90 | 0.00 | 4.30 |
| Overdose death | 69 | 5.80 | 4.30 | 0.00 | 13.00 | 76.80 | 0.00 | 0.00 | 0.00 |
| Probability of nonfatal vs fatal | 19 | 0.00 | 0.00 | 5.30 | 0.00 | 89.50 | 5.30 | 0.00 | 0.00 |
| Relapse | 51 | 0.00 | 0.00 | 11.80 | 0.00 | 80.40 | 0.00 | 3.90 | 3.90 |
| Drug use cessation | 50 | 8.00 | 0.00 | 0.00 | 0.00 | 92.00 | 0.00 | 0.00 | 0.00 |
| Percentage of total | 1,303 | 3.30 | 1.20 | 6.10 | 8.10 | 70.90 | 1.30 | 3.80 | 5.40 |
Abbreviations: MOUD, medication for opioid use disorder; NSDUH, National Survey on Drug Use and Health; OUD, opioid use disorder; PO, prescription opioid.
a Includes official reports from government agencies and treatment programs, and direct data reports.
b Includes British Columbia Methadone Maintenance Treatment Outcome Study (Canada) (72), Consortium to Study Opioid Risks and Trends (CONSORT; United States) (84, 92, 93); Drug Abuse Treatment Outcome Study (DATOS; United States) (115); Ekaterinburg Global Fund Study (Russia) (54); El Cuete IV Cohort Study (Mexico) (53); Expanding Medication Assisted Therapy in Ukraine (ExMAT Survey; Ukraine) (56); Harm Reduction Database (Wales) (82); Omsk Global Fund study (Russia) (54); Scientific Evaluation of Supervised Injecting Study (SEOSI; Canada) (52, 72); Simple Treatment Monitoring Application (STMA; Ukraine) (56); The Treatment Episode Data Set (TEDS; United States) (94); Vancouver Injection Drug Users Study (VIDUS; Canada) (52, 72).
c Mortality rate is nonspecific to opioid overdose.
Model Parameters and Sources, by References per Source
| Parameter Type | Data | Literature | Author Decisionsc | |||||
|---|---|---|---|---|---|---|---|---|
| NSDUH | CDC WONDER | Reportsa | Other Primary Data Sourcesb | Calibrated | Assumed | Calculated | ||
| MOUD treatment | Barnett, 2001 (63); Zarkin, 2005 (115) | Bayoumi, 2008 (52); Birger, 2017 (34); Chalmers, 2009 (85); Cipriano, 2012 (57); Fraser, 2018 (Europe) (58); Irvine, 2019 (68); Wilson, 2003 (39); Zaric, 2000 (42); Zaric, Brandeau, 2000 (41) | Barbosa, 2019 (51); Bayoumi, 2008 (52); Enns, 2016 (37); Fraser, 2018 (Europe) (58); Zarkin, 2005 (115) | Alistar, 2011 (61); Alistar, 2014 (62); Barnett, 2001 (63); Battista, 2019 (33); Bayoumi, 2008 (52); Bernard, 2016 (64); Bernard, 2017 (35); Birger, 2017 (34); Borquez, 2018 (53); Cepeda, 2018 (54); Cipriano, 2012 (57); Enns, 2016 (37); Fraser, 2018 (Europe) (58); Javanbakht, 2014 (65); King, 2016 (81); McGregor, 2019 (83); Morozova, 2020 (56); Pitt, 2018 (90); Uyei, 2017 (66); Vickerman, 2012 (49); Wakeland, 2011 (92); Wilson, 2003 (39); Zaric, 2000 (42); Zaric, Brandeau, 2000 (41); Zeiler, 2010 (60); Zou, 2018 (95) | Battista, 2019 (33); Cipriano, 2012 (57); Coffin, 2013 (77); Enns, 2016 (37); Fraser, 2018 (Scotland) (112); Irvine, 2018 (79); Irvine, 2019 (68) | Barbosa, 2019 (51); Birger, 2017 (34); Fraser, 2018 (Europe) (58); Irvine, 2019 (68); Nielsen, 2012 (84); Vickerman, 2012 (49); Wisløff, 2018 (40); Zarkin, 2005 (115); Zou, 2018 (95) | Chalmers, 2009 (85); Fraser, 2018 (Europe) (58) | |
| Naloxone | Coffin, 2013 (77); Langham, 2018 (82); Townsend, 2020 (118); Uyei, 2017 (66) | Irvine, 2018 (79); Townsend, 2020 (118) | Irvine, 2018 (79) | Coffin, 2013 (78); (77); Townsend, 2020 (118) | ||||
| Heroin use | Pitt, 2018 (90); Zarkin, 2005 (115) | Pitt, 2018 (90) | Caulkins, 2007 (36); Chalmers, 2009 (85); Chen, 2019 (86); Pitt, 2018 (90) | Chalmers, 2009 (85) | ||||
| Injection drug use | Gicquelais, 2019 (111) | Barnett, 2001 (63); Bayoumi, 2008 (52); Bernard, 2016 (64); Bernard, 2017 (35); Birger, 2017 (34); Cipriano, 2012 (57); Enns, 2016 (37); Fraser, 2018 (Europe) (58); Irvine, 2018 (79); Martin, Vickerman, 2013 (44); Nosyk, 2012 (72); Zaric, 2000 (42); Zaric, Brandeau, 2000 (41) | Bayoumi, 2008 (52); Borquez, 2018 (53); Cepeda, 2018 (54); Enns, 2016 (37); Fraser, 2018 (Europe) (58); Khan, 2018 (102); Mabileau, 2018 (45); Morozova, 2020 (56); Nosyk, 2012 (72); Wisløff, 2018 (40) | Alistar, 2011 (61); Alistar, 2014 (62); Barbosa, 2019 (51); Barnett, 2001 (63); Bayoumi, 2008 (52); Bernard, 2016 (64); Bernard, 2017 (35); Birger, 2017 (34); Borquez, 2018 (53); Cepeda, 2018 (54); Cipriano, 2012 (57); Enns, 2016 (37); Fraser, 2018 (rural) (113); Fraser, 2018 (Europe); Fraser, 2018 (Scotland) (112); Gicquelais, 2019 (111); Goedel, 2020 (110); Javanbakht, 2014 (65); Mabileau, 2018 (45); Martin, 2013 (46); Martin, Vickerman (44); Nosyk, 2012 (72); Nosyk, 2017 (38); Rhodes, 2010 (47); Rhodes, 2015 (48); Vickerman, 2014 (50); Wilson, 2003 (39); Wisløff, 2018 (40); Zaric, 2000 (42); Zaric, Brandeau, 2000 (41); Zeiler et al 2010 (60); Zou, 2018 (95) | Borquez, 2018 (53); Chen, 2019 (86); Cipriano, 2012 (57); Enns, 2016 (37); Gicquelais, 2019 (111); Irvine, 2018 (79); Vickerman, 2014 (50) | Barbosa, 2019 (51); Cepeda, 2018 (54); Fraser, 2018 (Europe) (58); Fraser, 2018 (Scotland) (112); Martin, 2013 (46); Nosyk, 2012 (72); Rhodes, 2010 (47); Wilson, 2003 (39); Zaric, 2000 (42); Zaric, Brandeau, 2000 (41) | Barbosa, 2019 (51); Zaric, 2000 (42); Zaric, Brandeau, 2000 (41) | |
| Recreational prescription opioid use | Chen, 2019 (86); Nielsen, 2012 (84); Wakeland, 2013 (93); Wakeland, 2015 (94); Yenikomshian, 2017 (69) | Chen, 2019 (86) | White, 2007 (55) | Wakeland, 2015 (94) | Chalmers, 2009 (85); Nielsen, 2012 (84); Wakeland, 2015 (94) | |||
| OUD transition | Coffin, 2013 (78); Irvine, 2018 (79) | Nosyk, 2012 (72); Wakeland, 2015 (94) | Barnett, 2001 (63); Carter, 2017 (76); Coffin, 2013 (78); Coffin, 2013) (77); Jackson, 2015 (80); Krebs, 2018 (71); Langham, 2018 (82); Nielsen, 2012 (84); Nosyk, 2012 (72); Uyei, 2017 (66); Wakeland, 2013 (93); Wakeland, 2015 (94); Zaric, 2000 (42); Zaric, Brandeau, 2000 (41) | Irvine, 2018 (79) | ||||
| OUD | Chen, 2019 (86); Gicquelais, 2019 (111); Townsend, 2020 (118) | Pitt, 2018 (90) | Battista, 2019 (33); Carter, 2017 (76); Cipriano, 2018 (117); McGregor, 2019 (83); Nielsen, 2012 (84); Pitt, 2018 (90); Townsend, 2020 (118); Wakeland, 2011 (92); Wakeland, 2013 (93); Yenikomshian, 2017 (69) | Cipriano, 2018 (117); Nielsen, 2012 (84) | ||||
| Emergency medical services | Langham, 2018 (82); Uyei, 2017 (66) | Cipriano, 2018 (117); Coffin, 2013) (78); Coffin, 2013 (77); Langham, 2018 (82); Uyei, 2017 (66) | Irvine, 2019 (68) | |||||
| Fatal or nonfatal overdose | Langham, 2018 (82) | Langham, 2018 (82) | Carter, 2017 (76); Coffin, 2013 (78); Coffin, 2013 (77); Irvine, 2018 (79); Irvine, 2019 (68); Langham, 2018 (82); McGregor, 2019 (83); Townsend, 2020 (118); Uyei, 2017 (66) | Coffin, 2013 (77); Irvine, 2018 (79); Irvine, 2019 (68); Townsend, 2020 | Cipriano, 2018 (117) | |||
| Mortality rated | Nielsen, 2012 (84); Pitt, 2018 (90); Wakeland, 2011 (92); Wakeland, 2013 (93) | Bernard, 2016 (64); Birger, 2017 (34); Cipriano, 2012 (57); Fraser, 2018 (rural) (113); Fraser, 2018 (Europe) (58) Martin, 2013 (44); McGregor, 2019 (83); Pitt, 2018 (90); Zaric, 2000 (42); Zaric, Brandeau, 2000 (41) | Bayoumi, 2008 (52); Borquez, 2018 (53); Fraser, 2018 (Europe) (58); Morozova, 2020 (56) | Barnett, 2001 (63); Barnett, 1999 (73); Battista, 2019 (33); Bayoumi, 2008 (52); Bernard, 2016 (64); Bernard, 2017 (35); Birger, 2017 (34); Cipriano, 2018 (117); Cipriano, 2012; Fraser, 2018 (rural) (113); Fraser, 2018 (Europe) (58); Fraser, 2018 (Scotland) (112); Jackson, 2015 ; Martin, Vickerman, 2013 (44); Nielsen, 2012 (84); Pitt, 2018 (90); Wakeland, 2013 (93); Wisløff, 2018 (40); Zaric, 2000 (42); Zaric, Brandeau, 2000 (41); Zarkin, 2005 (115) | Coffin, 2013 (77); Ritter, 2016 (120) | Cipriano, 2012 (57) | ||
| Overdose death | Chen, 2019 (86) | Chen, 2019 (86); Wakeland, 2015 (94) | Nielsen, 2012 (84); Wakeland, 2011 (92); Wakeland, 2013 (93) | Bayoumi, 2008 (52); Cepeda, 2018 (54); Cipriano, 2018 (117); Gicquelais, 2019 (111); Nielsen, 2012 (84); Nosyk, 2017 (38); Townsend, 2020 (118); Wakeland, 2013 (93) | ||||
| Probability of nonfatal vs. fatal | Cipriano, 2018 (117) | Cipriano, 2018 (117); Coffin, 2013 (77); Langham, 2018 (82) | Coffin, 2013 (77) | |||||
| Relapse | Gicquelais, 2019 (111); Irvine, 2018 (79); Irvine, 2019 (68) | Barnett, 2001 (63); Battista, 2019 (33); Carter, 2017 (76); Coffin, 2013 (78); Coffin, 2013 (77); Gicquelais, 2019 (111); Langham, 2018 (82); Townsend, 2020 (118); Wisløff, 2018 (40); Zaric, 2000 (42); Zaric, Brandeau, 2000 (41) | Zarkin, 2005 (115) | |||||
| Drug use cessation | Wakeland, 2013 (93); Zarkin, 2005 (115) | Bayoumi, 2008 (52); Fraser, 2018 (112); Gicquelais, 2019 (111); Martin, Vickerman, 2013 (46); Townsend, 2020 (118); Vickerman, 2012 (49); Wisløff, 2018 (40); Zaric, 2000 (42); Zaric, Brandeau, 2000 (41); Zou, 2018 (95) | ||||||
Abbreviations: MOUD, medication for opioid use disorder; NSDUH, National Survey on Drug Use and Health; OUD, Opioid use disorder.
a Includes official reports from government agencies and treatment programs, and direct data reports.
b Includes British Columbia Methadone Maintenance Treatment Outcome Study (Canada) (72), Consortium to Study Opioid Risks and Trends (CONSORT; United States) (84, 92, 93); Drug Abuse Treatment Outcome Study (DATOS; United States) (115); Ekaterinburg Global Fund Study (Russia) (54); El Cuete IV Cohort Study (Mexico) (53); Expanding Medication Assisted Therapy in Ukraine (ExMAT Survey; Ukraine) (56); Harm Reduction Database (Wales) (82); Omsk Global Fund study (Russia) (54); Scientific Evaluation of Supervised Injecting Study (SEOSI; Canada) (52, 72); Simple Treatment Monitoring Application (STMA; Ukraine) (56); The Treatment Episode Data Set (TEDS; United States) (94); Vancouver Injection Drug Users Study (VIDUS; Canada) (52, 72).
c Calibrated, assumed, and calculated values for each parameter can be found in Web Tables 2, 3, and 4.
d Mortality rate is nonspecific to opioid overdose.
In many of the studies, authors reported the empirical data used for calibration purposes relied on similar data sources. For example, NSDUH was relied on in 53% of the studies in which parameters were reported and that were conducted in the United States, to quantify opioid misuse and OUD, and CDC WONDER was used in 37% to quantify opioid overdose.
Transparency and reproducibility assessment
The studies were assessed against 25 predetermined criteria, which were divided into 3 categories: development, testing, and analysis (Figure 2). The mean score (number of criteria met out of 25) was 17 (median = 17; 68%). The modeling problem, objective, and method were defined in each article. In all but 1 article the model boundary was specified; the authors of that article instead aimed to model a generalized drug epidemic (91). Of the 88 articles, 38 reported how stakeholders were engaged throughout the development of the model, allowing insight into how they leveraged different areas of expertise to inform their model (34, 36, 40, 44, 48, 51–53, 55, 56, 58, 64, 66, 72, 83–88, 90, 92–98, 100, 101, 102, 106–109, 116, 119, 120). Equations composing the model (e.g., differential equations that describe compartmental models) were reported in 43 articles (33–36, 38, 41, 43, 44, 46–51, 53–56, 58–62, 64, 65, 68, 79, 86, 87, 90, 91, 94, 95, 99, 101, 103, 105, 109, 111, 112, 113, 114, 117). These criteria fell under the development category.
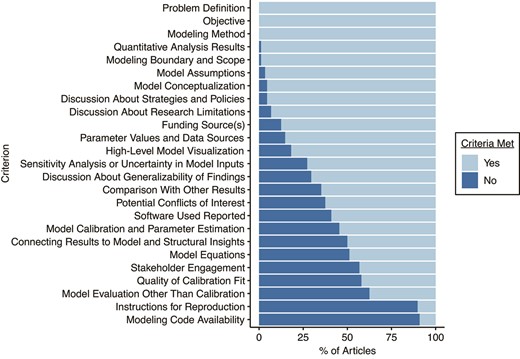
Percentage of articles meeting transparency and reproducibility criteria. Light blue: yes (criterion was met); dark blue: no (criterion was not met).
In 87 of the 88 articles, authors reported their quantitative results, a criterion within the analysis category. In 22 of the articles, authors fulfilled all 3 criteria of placing the study results within the broader context of the literature, including connecting results to model and structural insights (33, 34, 36, 38, 39, 41, 42, 44, 52, 54, 58, 62, 63, 67, 70, 71, 76, 77, 83, 84, 85–89, 92–95, 97, 98, 100, 102–109, 111, 113, 115, 116), comparing with other results (34–43, 44–47, 49–54, 55, 57–59, 62, 63, 65–68, 70–78, 80, 82, 83, 86, 94, 100, 102, 105, 107, 109, 111, 112, 113, 115–119), and discussing generalizability of findings (34, 35, 48–57, 36, 58–64, 68, 71, 72, 37, 73, 76, 83–85, 87–89, 91, 92, 38, 93–102, 40, 103, 105–107, 109, 111, 113–116, 43, 119, 120, 44–46).
More often than not, models failed to fulfill the criteria in the testing category; authors reported model calibration and parameter estimation in 55% (n = 48) (33–38, 44, 48–50, 51–54, 57–59, 61–65, 68, 71, 72, 75, 77–79, 82, 83, 85–87, 90, 94–96, 101, 110, 111–115, 117, 118, 120), and quality of calibration fit to real-world data was reported in 42% (n = 37) (33–38, 44, 48, 50–54, 57–59, 61, 62, 64, 68, 71, 72, 77–79, 84, 86, 87, 92, 93, 94–96, 101, 111, 112, 118). The average score (number of criteria met out of 25) of articles in which parameter values and their sources were reported and in which authors calibrated their model using real data (n = 37) was 19.9 (80%), whereas the average score was 15.9 (64%) for articles in which the quality of calibration fit or parameter values or sources was not reported (n = 51) (Figure 3). Model testing other than calibration to data was reported in 38% of the articles (n = 33) (33, 36, 35, 56, 64, 66, 67, 71, 72, 74, 75, 77, 79–82, 84–87, 92–96, 105, 107, 110, 118, 120). Finally, in 88% of the articles (n = 77), authors reported whether their research was supported by outside funding, and potential conflicts of interest were reported in 63% (n = 55).
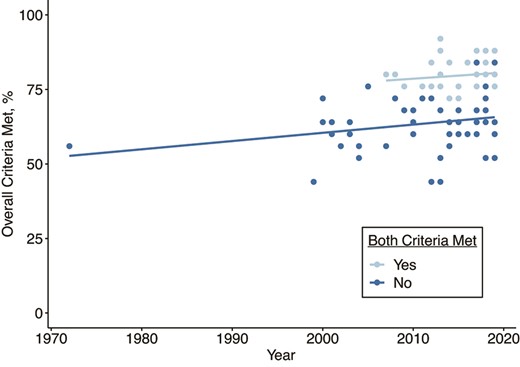
Trends in criteria met over time for articles in which model validation was reported via calibration using real data and parameter values, and sources were reported versus those that did not. Modeling codes and instructions for reproducibility were provided in 9 articles; only 3 provided both (56, 111, 117). Light blue: yes (both criteria were met); dark blue: no (both criteria were not met).
Calibrated model parameters
Web Table 2 shows model parameters that were calibrated by authors of the 14 articles that reported these values (33, 37, 50, 53, 57, 61, 68, 77, 79, 86, 111, 112, 118, 120). Two or more separate models calibrated a comparable value for IDU development, MOUD initiation, MOUD exit, baseline overdose rate, increased risk of overdose after relapse from remission due to decreased tolerance, naloxone effectiveness and relative risk of death, fentanyl overdose rates, overdose mortality rates, and all-cause mortality rates generally and during active use. Each model we assessed had different underlying assumptions and structure, which could account for value differences. Notably, the baseline death rates ranged from 0.057–1.97 per 100 person-years (68, 79, 120). We did not perform meta-analysis on these values; even though the parameters were comparable, there was still considerable heterogeneity among parameters in each category (e.g., IDU initiation (61) vs. heterosexual IDU initiation in Toronto and Ottawa (37)). Researchers should use parameters in Web Table 2 with caution, and information on the parameter target population should be assessed to determine whether the parameters are generalizable to the population, setting, and time period simulated in their own model. It is also important to note that Web Table 2 is not meant to be comprehensive and even wide ranges reported in the table might still fall short in presenting high heterogeneities. Research in this space is growing; thus, additional reviews and expansion of this table are- warranted.
DISCUSSION
Simulation models are particularly helpful in predicting the potential benefits and costs of investing in alternative strategies to address opioid misuse; almost half of the studies we reviewed were focused on evaluating the cost-effectiveness of strategies to address the opioid overdose epidemic, and almost one third focused on simulating the impact of increasing access to treatment and harm reduction services on opioid-related harms. The potential use of simulation modeling to understand the mechanisms and feedback processes that give rise to the population distribution of opioid misuse, or to predict the evolution of the overdose epidemic, remain underexplored. As of March 2020, 88 studies were published in which the authors used simulation models of opioid misuse; with the exception of 1 study published in 1972 (88), all other studies were published starting in 1999.
A range of different simulation models were used to answer questions about opioid misuse. The most frequently used simulation models included ABMs, and compartmental, Markov, and SD models. Substantial heterogeneity was found in the estimates reported for some of the key calibrated model parameters across studies, including those associated with IDU and overdose, such as transition probabilities. Differences in modeling approach, data sources, calibrated model parameters, and model assumptions will likely lead to different conclusions to the same research questions, highlighting the vital importance of transparency in the model development process so that models can be replicated and results can be interpreted appropriately. This represents an area for growth in the application of simulation models to opioid misuse; in our assessment, fewer than half of studies presented model equations or provided access to model code and documentation in order to reproduce the reported findings based on the model. Placing studies in the context of the larger body of work is also critical to be able to adequately interpret findings from new studies; researchers compared their results with another model’s findings in fewer than half of the studies we reviewed.
The data sources used to calibrate the model play an important role in defining simulation model–based outcomes. Our review highlights 2 key issues with the primary and secondary data sources used to parameterize the pathway of the opioid epidemic. First, many of the studies in which empirical data were used for calibration purposes relied on similar data sources. Any limitations of these data sets will be magnified in opioid simulation models, especially in compartmental models with linked differential equations where calibrating multiple outcomes simultaneously can be difficult. NSDUH, for example, has been shown to substantially under-report OUD (121), likely due to issues such as reporting bias for stigmatized drugs, and lack of representation of vulnerable populations such as those incarcerated or homeless. Death certificate data may also underestimate opioid overdose deaths by as much as 24%, due to underidentification of specific drug involvement in overdose deaths (122). Data availability and data quality remain major challenges in simulation models for the opioid epidemic, as is the need to incorporate assumptions about data uncertainty and underestimation into simulation models (123). Second, for most models, researchers relied on published estimates to calibrate input parameters, particularly when calibrating the effect of any kind of intervention such as treatment, emergency medical services, or naloxone. Under ideal circumstances, reported intervention effects obtained from published estimates would be unconfounded; the causal effect of an intervention found in the published population, setting, and time period would be directly transportable to a different site; there would be no selection bias or measurement bias in the evaluation of the intervention effect; and the distributions of unmeasured confounding would be the same in the 2 sites (124, 125). However, several of these assumptions are often unfulfilled. For example, the prevalence of interacting factors that activate the effect of an exposure and the background prevalence of the disease all modify the effect of such an exposure across sites, raising concerns about the transportability of intervention-effect estimates to simulation models that represent different periods, types of target populations, or geographic areas (125, 126) Furthermore, in cases of intervention effects that are affected by time-dependent confounding, treating published estimates of past intervention effects as causal effects raises concerns about collider bias (125). To elaborate: When there is intervention-confounder feedback and (as is often the case) an unmeasured factor affects both the confounder and the outcome, conditioning on the confounder (a “collider,” because it is a common effect of the intervention and the unmeasured confounder) creates an artificial association between the intervention and the unmeasured confounder, and therefore between the intervention and the outcome (because the unmeasured confounder is associated with the outcome) (125).
These issues highlight 5 priorities for future simulation model–based studies of opioid misuse: 1) incorporate data specific to the target population and period whenever possible; 2) incorporate input from stakeholders on the quality and limitations of local and national data and on sources of variation in assumptions about intervention effects; 3) use transparent approaches during model development to test the extent to which different assumptions about data quality (e.g., estimates of outcome underestimation) and transportability might affect model findings; 4) consider using approaches such as g-computation (127–129) that account for time-varying confounding by prior exposure to obtain unbiased intervention-effect estimates in cases where the simulation model represents the population from which the intervention effect was originally examined; and (5) build on prior work developing transportability estimates (129), and incorporate the estimates into simulation models to predict the potential impact of new interventions in new populations and contexts (130, 131).
Model calibration and validation of simulation model–based studies of opioid misuse is another area that needs much more research attention. Fewer than half of the reviewed studies fulfilled the criteria meant to assess model testing, including reporting the quality of calibration fit to data. Indeed, calibration and validation were key drivers of model quality; for example, models that reported the quality of calibration fit to historical data performed 28% better than other models in terms of our assessment criteria. To build confidence in the reliability and validity of simulation models and to encourage independent replication of models that simulate opioid misuse, presentation of the quality of model calibration and attempts to validate model results are critical. This is especially true for simulation models developed specifically to support decision-making. As the plethora of simulation models for COVID-19 pandemic have shown, public confidence in models for decision-making relies heavily on the quality of the model calibration and validation procedures (132). For opioid-epidemic simulation models, this can include approaches such as period-by-period processes of calibration-test-recalibration; predictive validation; splitting data into training and testing sets and testing whether a model developed using training data can predict outcomes in the testing set; and testing sensitivity of results to the choice of input parameters, including multivariate sensitivity analysis (133–135). There are well-established guidelines for model calibration and validation for dynamical simulation models that should be followed in future simulation modeling studies of the opioid epidemic (136, 137).
This systematic review was focused on simulation models related to opioid misuse. No studies identified in our review simulated co-use of opioids with stimulants or contamination of stimulants with fentanyl and other illegally manufactured synthetic opioids. Hence, the parameters presented in the reviewed papers are likely not applicable to questions of emerging drug-product combinations. As polydrug use emerges as an important driver of overdose trends (138) and data on the national drug supply become available (e.g., from the National Forensic Laboratory Information System), incorporating information on fentanyl contamination and stimulant-opioid co-use in models simulating future overdose trends should be a priority.
Simulation models are an important tool to help us understand the dynamics that give rise to population patterns of opioid misuse and identify the types of interventions that can reduce population rates of opioid misuse in ways we cannot do with real data or in experiments. Increasing application of simulation methods to study opioid misuse and, in particular, to predict potential outcomes and costs associated with interventions to reduce opioid misuse, offers real promise to the field. At the same time, studies applying simulation models to questions of opioid misuse should actively address methodological challenges pervading this field, including the potential for bias in the choice of parameter inputs, investment in calibration and validation, and transparency in the assumptions and mechanics of simulation models that would facilitate reproducibility.
ACKNOWLEDGMENTS
Author affiliations: Center for Opioid Epidemiology and Policy, Division of Epidemiology, Department of Population Health, New York University School of Medicine, New York, New York, United States (Magdalena Cerdá, Julian Santaella-Tenorio, Christina Wang); MGH Institute for Technology Assessment, Harvard Medical School, Boston, Massachusetts, United States (Mohammad S. Jalali, Catherine DiGennaro); Department of Epidemiology, Mailman School of Public Health, Columbia University, New York, New York, United States (Ava D. Hamilton, Navdep Kaur, Katherine M. Keyes); and Division of Environmental Health Sciences, College of Public Health, and Translational Data Analytics Institute, The Ohio State University, Columbus, Ohio, United States (Ayaz Hyder).
This work was funded by the National Institutes of Health (grant R01DA046620-01A1) and the NYU Center for Opioid Epidemiology and Policy.
All extracted opioid-related variables, their sources, and values are in an online database hosted by the authors: https://github.com/avahamilton/OpioidSimulation_SR.
K.M.K. has testified as an expert witness in opioid litigation. The other authors report no conflicts.
