


Abstract
Survey interviewers are often tasked with assessing the quality of respondents’ answers after completing a survey interview. These interviewer observations have been used to proxy for measurement error in interviewer-administered surveys. How interviewers formulate these evaluations and how well they proxy for measurement error has received little empirical attention. According to dual-process theories of impression formation, individuals form impressions about others based on the social categories of the observed person (e.g., sex, race) and individual behaviors observed during an interaction. Although initial impressions start with heuristic, rule-of-thumb evaluations, systematic processing is characterized by extensive incorporation of available evidence. In a survey context, if interviewers default to heuristic information processing when evaluating respondent engagement, then we expect their evaluations to be primarily based on respondent characteristics and stereotypes associated with those characteristics. Under systematic processing, on the other hand, interviewers process and evaluate respondents based on observable respondent behaviors occurring during the question-answering process. We use the Work and Leisure Today Survey, including survey data and behavior codes, to examine proxy measures of heuristic and systematic processing by interviewers as predictors of interviewer postsurvey evaluations of respondents’ cooperativeness, interest, friendliness, and talkativeness. Our results indicate that CATI interviewers base their evaluations on actual behaviors during an interview (i.e., systematic processing) rather than perceived characteristics of the respondent or the interviewer (i.e., heuristic processing). These results are reassuring for the many surveys that collect interviewer observations as proxies for data quality.
Introduction
At the end of a survey interview, interviewers often evaluate respondents on dimensions such as cooperativeness, comprehension, or friendliness. These assessments have been used as indicators of data quality (e.g., Barrett, Sloan, and Wright 2006) and interviewer engagement (Olson and Peytchev 2007). Yet the measurement qualities of interviewer assessments and specific threats to validity have not been directly evaluated. For example, interviewers’ assessments may represent a more general impression based on stereotypes associated with respondent characteristics like age, race, and sex (e.g., women are more talkative than men) rather than behaviors during the interview. More generally, little research assesses whether the quality of interviewer assessments justifies the investment of interviewer time to complete.
In this paper, we develop competing hypotheses for how interviewers develop impressions that inform their end-of-survey evaluations of respondents. Those hypotheses are tested using CATI survey data about respondent and interviewer characteristics, respondents’ actual behavior during the survey, and interviewer evaluations of respondents’ cooperativeness, interest, friendliness, and talkativeness. While previous face-to-face and CATI studies have examined how respondent characteristics affect interviewer evaluations of respondent engagement and response quality (e.g., Hurtado 1994; Freedman et al. 2012), to our knowledge this is the first study to examine whether actual respondent behaviors predict postsurvey interviewer evaluations in a telephone survey.
In the next two sections, we provide the theoretical perspective of the dual process model of impression formation applied to interviewer evaluations. Then we describe the data and methods used, followed by analytic results. Finally, we discuss the findings and the implications for survey practice and future research.
Background
Interviewer observations collected in many surveys focus on nonresponse error and measurement error. Most of the research on interviewer observations focuses on understanding nonresponse error, including observable housing unit characteristics, or statements that a householder makes during recruitment (e.g., Olson 2013). Research has shown that these interviewer observations predict and are useful for adjusting for unit nonresponse and panel attrition (e.g., Lepkowski and Couper 2002; West, Kreuter, and Trappmann 2014). Despite this utility, these observations are subject to significant interviewer variance effects and measurement errors (e.g., Sinibaldi, Durant, and Kreuter 2013; West 2013). For instance, interviewers engage in social categorization when evaluating factual characteristics (West and Kreuter 2013).
Second, interviewers record observations about factors related to the measurement process, including respondent cooperativeness with answering questions or engagement in the interview (Olson and Parkhurst 2013). Surveys such as the General Social Survey (GSS) and the European Social Survey (ESS) ask interviewers to assess response quality after an interview, including measures of the levels of respondent cooperation and understanding (e.g., Smith 2009; ESS 2014). Investigators use these postsurvey evaluations to identify potential breakdowns in data quality (Olson and Parkhurst 2013). For example, in an incentive experiment, Medway and Tourangeau (2015) use interviewer assessments of a respondent’s level of effort in answering questions as an indicator of data quality, and find no differences in ratings between the control and the incentive group. Holbrook and colleagues (2014) find a significant positive relationship between interviewer ratings of respondent intelligence and response heaping, but a negative relationship between interest and response heaping. Tarnai and Paxson (2005) show that interviewer ratings of respondent comprehension difficulty are significantly positively related to the number of missing items in a survey. Thus, interviewer observations of the quality of an interview are used by researchers to evaluate data quality.
Although interviewer observations of response quality are often used in analyses (e.g., Barrett, Sloan, and Wright 2006; Kaminska, McCutcheon, and Billiet 2010), few studies have assessed their measurement properties. Olson and Peytchev (2007) find significant interviewer variance effects for interviewer evaluations of respondent interest. Other studies have found significant associations between respondents’ characteristics and interviewer evaluations of friendliness, interest, comprehension, engagement, and uncertainty (Hurtado 1994; Freedman et al. 2012). While it is clear that interviewer evaluations vary across interviewers and respondents, no study has examined whether respondent behaviors during the interview itself influence these observations.
TYPES OF INTERVIEWER OBSERVATIONS
Interviewer evaluations of response quality cover two general groups: task-related assessments of respondent engagement in the measurement process (e.g., Cannell, Miller, and Oksenberg 1981) and assessments of rapport or interpersonal affiliation between the interviewer and respondent (Garbarski, Schaeffer, and Dykema 2016). Many major US and European surveys, including the 2012 pre-election American National Election Studies (ANES 2013), the GSS (Smith 2009), the ESS (ESS 2014), the National Longitudinal Survey of Youth (NLSY 1997), and the Project on Human Development in Chicago Neighborhoods (PHDCN; Earls et al. 2000), ask interviewers to evaluate respondent cooperation and interest toward the interview as measures of engagement and motivation. As in the GSS and PHDCN, interviewers also assess aspects of interactional rapport such as respondents’ friendliness and talkativeness. These latter indicators reflect practices of everyday conversation that deviate from standardized survey interviewing practices and potentially affect data quality (Garbarski, Schaeffer, and Dykema 2016).
Continuum Model of Impression Formation
The social psychological literature on impression formation is useful for understanding which types of information interviewers draw on to make their postsurvey assessments. Dual processing models suggest that impressions about individuals can be formed either through heuristic or systematic processing (e.g., Chaiken 1980; Chaiken and Torpe 1999). In particular, the continuum model of impression formation suggests that perceivers initially classify individuals into preexisting social categories (e.g., male, elderly, African American) and then generate impressions based on these observed social characteristics (e.g., Fiske, Lin, and Neuberg 1999). Additionally, Tversky and Kahneman’s (1974) “availability” heuristic argues that people often rely on available experiences when making judgments about others. For example, a female interviewer who perceives herself as talkative could infer the same for a female respondent when forming an impression. These initial categorization processes are made heuristically, allowing impression formation to happen quickly and without much effortful thought (Chen, Duckworth, and Chaiken 1999; Fiske 2000; Fiske et al. 2002).
With sufficient motivation and available information, the perceiver will move beyond heuristic processing and process actual behaviors, updating the initial heuristic-based impressions through systematic processing or individuation. The process of individuation leads to a “piecemeal integration” of multiple sources of information to form the overall impression (Fiske, Lin, and Neuberg 1999).
INTERVIEWER OBSERVATIONS AND IMPRESSION FORMATION
We anticipate that survey interviewers conform to the continuum model when evaluating respondents. Namely, interviewers will first categorize respondents based on observed characteristics and the interviewers’ own characteristics. Interviewers will then update that initial impression based on the respondent’s behavior during the survey interview.
Whether or not interviewers proceed past the heuristic stage of impression formation is at the crux of how useful postsurvey interviewer evaluations are as indicators of data quality. If interviewers rely on heuristic impression formation, their evaluations will reflect stereotypes about respondents instead of respondents’ actual interview behaviors and data quality. That is, if interviewers rely primarily on heuristic processing to make their postsurvey evaluations, significant associations should exist between respondent and interviewer background characteristics and interviewer postsurvey evaluations. If interviewers proceed to systematic processing, their evaluations should be more indicative of data quality to the extent that respondent behaviors are associated with the quality of responses (Schaeffer and Dykema 2011). That is, if interviewers are engaging in more effortful systematic processing, significant associations should exist between observable respondent behaviors during the interview and postsurvey evaluations.
HEURISTIC PROCESSING DURING INTERVIEWS
For interviewers to use heuristic processing, they have to be able to perceive social group characteristics. In telephone interviews, interviewers rely exclusively on auditory cues and the content of the conversation (Conrad, Schober, and Dijkstra 2008). Research suggests that telephone interviewers can reliably perceive sociodemographic characteristics (e.g., Krauss, Freyberg, and Morsella 2002; Thomas and Reaser 2004). Furthermore, interviewers ask about respondents’ demographic characteristics during the interview, before any postsurvey interviewer evaluations.
We focus on respondent traits of age, sex, race, and socioeconomic status. Commonly held beliefs about older people are that they have reduced working memory capacity (e.g., Yan and Tourangeau 2008), are more verbose (Belli, Weiss, and Lepkowski 1999), have difficulty answering interview questions (Johnson et al. 2015), and are warmer than younger people (Fiske et al. 2002). Therefore, if interviewers rely on heuristic processing, they should evaluate elderly respondents as less cooperative but more friendly and talkative. For gender, men are thought to be more competent and rational whereas women are thought to be more warm, friendly, and expressive (e.g., Fiske et al. 2002). As such, interviewers should evaluate females as more friendly and talkative than their male counterparts. If being perceived as a racial minority triggers more hostile perceptions and other negative traits (Greenwald and Banaji 1995; Fiske et al. 2002), then we expect to see lower ratings of cooperativeness, interest, and friendliness for racial/ethnic minorities. Members of a higher socioeconomic status are typically perceived as more competent, intelligent, warm, or credible compared to lower socioeconomic status individuals (Tiedens, Ellsworth, and Mesquita 2000; Fiske et al. 2002). Thus, if interviewers engage in heuristic processing, respondents with higher socioeconomic status should be rated as more cooperative, interested, and friendly.
Because people rely on their own “available” experiences in attributing traits to others (Tversky and Kahneman 1974), an interviewer’s own characteristics can affect evaluations of respondents. If interviewers engage in heuristic processing based on their own fixed characteristics, significant associations should exist between the interviewers’ characteristics and their postsurvey evaluations of respondents.
SYSTEMATIC PROCESSING DURING INTERVIEWS
Four types of respondent behaviors are likely to influence postsurvey evaluations under systematic processing. First, question-answering behaviors are the most prevalent respondent behavior. For any given question, respondents can provide an adequate answer, qualify their answer (“about 5”), or provide responses that fail to fit into the response categories. Respondents can also elaborate on their answer by providing additional context (“5. I really like reading”).
Under the systematic-processing assumption, respondents who provide adequate answers should be evaluated as more cooperative, interested, and friendly because it represents respondents doing exactly what is expected of them during an interview. Conversely, respondents who provide any kind of inadequate answer (qualified, uncodable, don’t know, and refusal) should be evaluated as less cooperative because interviewers face greater burden in resolving these problems (Japec 2008).
We expect that elaborations on any type of answer will be associated with higher ratings of friendliness and talkativeness because elaborations reflect engagement and a desire to interact with the interviewer. Conversely, elaborations on adequate answers should be associated with lower ratings of cooperativeness if the interviewer perceives these as a violation of the paradigmatic question-response-feedback sequence. Elaborations on any kind of inadequate answer signal that the respondent is trying to help the interviewer. Elaborations on qualified and uncodable responses should be associated with higher ratings of cooperativeness and friendliness and, as with adequate answers, higher ratings of talkativeness. We have no clear expectations regarding other types of answers, such as answering a previous question.
The second type of respondent behaviors includes nonverbal utterances such as disfluencies and laughter. Nonverbal utterances are part of normal conversational behaviors and are not directly related to the task of responding (Jans 2010; Conrad et al. 2013). Speech disfluencies such as fillers (“ums” and “uhs”), stutters, and repairs are related to comprehension problems and difficulties with tasks requiring higher cognitive ability (e.g., Schober and Bloom 2004).
We have competing hypotheses for the association between disfluencies and postsurvey evaluations. Fluent speech styles produce positive ratings of speakers’ credibility, confidence, and social attractiveness (e.g., Oksenberg, Coleman, and Cannell 1986). Thus, respondent disfluencies should be associated with lower ratings of cooperativeness, interest, and friendliness. However, disfluencies have been shown to provide a “disfluency advantage,” as they give the listener more time to process what is being said and thus improve comprehension (Brennan and Schober 2001). If this is the case, then interviewers should have greater understanding of respondents with higher levels of disfluencies, which will lead to higher ratings of cooperativeness, interest, and friendliness. Inasmuch as laughter indicates rapport and affiliation between respondent and interviewer (e.g., Garbarski, Schaeffer, and Dykema 2016), we expect laughter to be positively associated with ratings of respondent cooperativeness, interest, and friendliness.
The third type of behaviors are those related to verbal measures of personal involvement and rapport. Rapport is inconsistently defined in the existing literature, but can include behaviors such as agreeing with the interviewer or providing personal disclosures (Garbarski, Schaeffer, and Dykema 2016). Personal involvement behaviors are expected to be associated with higher ratings of the interpersonal outcomes of friendliness and talkativeness but have no or negative associations with the task-related outcomes of cooperativeness and interest.
The fourth type of behaviors are requests for clarification, such as asking the interviewer to repeat a question or response options. These expressions of cognitive difficulty indicate decreased reliability and less accurate answers. On the other hand, requests for clarification also indicate harder-working respondents who are trying to give the “best” answer possible (Dykema, Lepkowski, and Blixt 1997). We expect requests for clarification to be associated with higher ratings of the task-related assessments of cooperativeness and interest. We do not expect these clarification behaviors to be associated with the interpersonal assessments of friendliness or talkativeness.
In sum, if interviewers evaluate respondents based on their interview behaviors, then interviewers are engaging in systematic processing. Whether these evaluations are related to actual behaviors during an interview has not been assessed. We now empirically address this question.
Data and Methods
DATA
We use data from the Work and Leisure Today survey, a random-digit-dial telephone survey fielded by AbtSRBI in August 2013 targeting adults in landline households (n = 450; AAPOR RR3 = 6.3 percent). In 2013, 38 percent of US adults lived in cell-phone-only households (Blumberg and Luke 2013). The survey took an average of fourteen minutes and contained an average of 46.7 questions. Sampled cases were randomly assigned to twenty-two interviewers. The surveys were audiorecorded with respondent consent and then transcribed. Two interviews were not fully recorded and are excluded from the analyses. Interviewers who had fewer than ten interviews (Olson and Peytchev 2007) were excluded, leaving an analytic sample size of 433 interviews conducted by nineteen interviewers.
DEPENDENT VARIABLES
After completing each interview, interviewers were asked to make an assessment about how cooperative, interested, friendly, and talkative the respondent was. Small cell sizes in some categories were collapsed for analysis. Table 1 presents frequency distributions for each of the interviewer evaluations (see online appendix A for question wording and full distributions). Interviewers generally evaluate respondents as having very good cooperation levels, showing above average and high interest, mostly friendly and eager, and neither talkative nor untalkative. Simple correlation analysis shows that assessments of cooperativeness, interest, and friendliness have a strong positive relationship (0.39 < Cramer’s V < 0.60), while the associations with talkativeness are generally weaker (0.11 < Cramer’s V < 0.25).
Descriptive Statistics of Interviewer Evaluations
| Measure | Percentage |
|---|---|
| Cooperativeness | |
| Fair and below | 7.62 |
| Good | 29.10 |
| Very good | 63.28 |
| Interest | |
| Average and below | 41.34 |
| Above average | 33.49 |
| Very high | 25.17 |
| Friendliness | |
| Cooperative but not particularly eager and below | 40.18 |
| Friendly and eager | 59.82 |
| Talkativeness | |
| Very untalkative | 3.00 |
| Somewhat untalkative | 12.01 |
| Neither talkative nor untalkative | 45.27 |
| Somewhat talkative | 30.95 |
| Very talkative | 8.78 |
Note.—n = 433.
INDEPENDENT VARIABLES: HEURISTIC PROCESSING
Table 2 provides an overview of respondent and interviewer characteristics indicative of heuristic processing. Respondents reported their age, gender, race, education, and income during the interview. Interviewer gender, race, and experience are included in the model as fixed characteristics of the interviewer and come from administrative records. Additionally, we include the interviewer’s cooperation rate, operationalized through the percent of call attempts with a contact made by the interviewer that yielded a successful interview, divided into higher and lower cooperation rate groups based on a median split (6.9 percent cooperation rate).
Percentage Distribution of Respondent and Interviewer Characteristics
| Respondent characteristics and question wording (if applicable) (n = 433) | (Recoded) response categories | Percent | Mean | SD |
|---|---|---|---|---|
| Age: What is your age? | 35 and less | 8.7 | ||
| 36 to 50 | 16.2 | |||
| 51 and above | 70.0 | |||
| Gender: I have to read every question in this survey, even if it seems obvious. What is your sex? | Male | 36.0 | ||
| Female | 64.0 | |||
| Race: [IF NON-HISPANIC ASK:] What is your race? Are you white, black, Asian, or some other? [IF HISPANIC ASK:] Are you white Hispanic, black Hispanic, or some other race? | White | 87.3 | ||
| Nonwhite | 12.7 | |||
| Education: What is the last grade or class that you completed in school? [INTERVIEWER CODE, DO NOT READ] | High school and less | 28.9 | ||
| Vocational | 29.3 | |||
| College and above | 41.8 | |||
| 1 None, or grade 1–8 | ||||
| 2 High school incomplete (grades 9–11) | ||||
| 3 High school graduate (grade 12 or GED certificate) | ||||
| 4 Business, technical, or vocational school AFTER high school | ||||
| 5 Some college, no 4-year degree | ||||
| 6 College graduate (BS, BA, or other 4-year degree) | ||||
| 7 Postgraduate training or professional schooling after college (e.g., toward a master’s degree or PhD; law or medical school) | ||||
| Respondent characteristics and question wording (if applicable) (n = 433) | (Recoded) response categories | Percent | Mean | SD |
| Income: Last year, that is, in 2012, what was your total family income from all sources, before taxes? Just stop me when I get to the right category. [READ] | $49,999 and less | 58.2 | ||
| $50,000 and above | 41.8 | |||
| 1 Less than $10,000 | ||||
| 2 $10,000 to under $20,000 | ||||
| 3 $20,000 to under $30,000 | ||||
| 4 $30,000 to under $40,000 | ||||
| 5 $40,000 to under $50,000 | ||||
| 6 $50,000 to under $75,000 | ||||
| 7 $75,000 to under $100,000 | ||||
| 8 $100,000 or more | ||||
| Respondent controls | ||||
| Married: Are you married, partnered, divorced, separated, widowed, or never been married? | No | 52.2 | ||
| Yes | 47.8 | |||
| Computer user: The next few questions are about leisure activities using a computer. Do you happen to have a desktop, laptop or tablet computer? | No | 22.3 | ||
| Yes | 77.7 | |||
| # of questions asked | 46.7 | 4.50 | ||
| Interviewer characteristics (n = 19) | (Recoded) response categories | Percent | Mean | SD |
| Gender | Male | 52.6 | ||
| Female | 47.4 | |||
| Race | White | 47.4 | ||
| Nonwhite | 52.6 | |||
| Experience | 0 years | 26.3 | ||
| 1+ years | 73.7 | |||
| Cooperation rate | Low | 57.9 | ||
| High | 42.1 |
| Respondent characteristics and question wording (if applicable) (n = 433) | (Recoded) response categories | Percent | Mean | SD |
|---|---|---|---|---|
| Age: What is your age? | 35 and less | 8.7 | ||
| 36 to 50 | 16.2 | |||
| 51 and above | 70.0 | |||
| Gender: I have to read every question in this survey, even if it seems obvious. What is your sex? | Male | 36.0 | ||
| Female | 64.0 | |||
| Race: [IF NON-HISPANIC ASK:] What is your race? Are you white, black, Asian, or some other? [IF HISPANIC ASK:] Are you white Hispanic, black Hispanic, or some other race? | White | 87.3 | ||
| Nonwhite | 12.7 | |||
| Education: What is the last grade or class that you completed in school? [INTERVIEWER CODE, DO NOT READ] | High school and less | 28.9 | ||
| Vocational | 29.3 | |||
| College and above | 41.8 | |||
| 1 None, or grade 1–8 | ||||
| 2 High school incomplete (grades 9–11) | ||||
| 3 High school graduate (grade 12 or GED certificate) | ||||
| 4 Business, technical, or vocational school AFTER high school | ||||
| 5 Some college, no 4-year degree | ||||
| 6 College graduate (BS, BA, or other 4-year degree) | ||||
| 7 Postgraduate training or professional schooling after college (e.g., toward a master’s degree or PhD; law or medical school) | ||||
| Respondent characteristics and question wording (if applicable) (n = 433) | (Recoded) response categories | Percent | Mean | SD |
| Income: Last year, that is, in 2012, what was your total family income from all sources, before taxes? Just stop me when I get to the right category. [READ] | $49,999 and less | 58.2 | ||
| $50,000 and above | 41.8 | |||
| 1 Less than $10,000 | ||||
| 2 $10,000 to under $20,000 | ||||
| 3 $20,000 to under $30,000 | ||||
| 4 $30,000 to under $40,000 | ||||
| 5 $40,000 to under $50,000 | ||||
| 6 $50,000 to under $75,000 | ||||
| 7 $75,000 to under $100,000 | ||||
| 8 $100,000 or more | ||||
| Respondent controls | ||||
| Married: Are you married, partnered, divorced, separated, widowed, or never been married? | No | 52.2 | ||
| Yes | 47.8 | |||
| Computer user: The next few questions are about leisure activities using a computer. Do you happen to have a desktop, laptop or tablet computer? | No | 22.3 | ||
| Yes | 77.7 | |||
| # of questions asked | 46.7 | 4.50 | ||
| Interviewer characteristics (n = 19) | (Recoded) response categories | Percent | Mean | SD |
| Gender | Male | 52.6 | ||
| Female | 47.4 | |||
| Race | White | 47.4 | ||
| Nonwhite | 52.6 | |||
| Experience | 0 years | 26.3 | ||
| 1+ years | 73.7 | |||
| Cooperation rate | Low | 57.9 | ||
| High | 42.1 |
INDEPENDENT VARIABLES: SYSTEMATIC PROCESSING
We derive indicators of systematic processing from behavior codes, typically used to understand the interviewer-respondent interaction in survey interviews (e.g., Schaeffer and Dykema 2011). Each interview was digitally audiorecorded and transcribed. Then, a team of trained coders behavior coded each survey transcript. The behavior codes were assigned at the conversational-turn level, with codes assigned for the actor (respondent or interviewer); the initial action (e.g., answer provided); an assessment of the initial action (e.g., whether the answer provided was adequate, qualified, or uncodable); a more specific assessment of this action (e.g., whether the answer was provided with or without elaborations); laughter (whether the respondent laughed or not); any disfluencies during any part of the turn; and interruptions. Table 3 provides examples of each of these codes.
Kappa Statistics for Behavior Codes and Examples of Respondent Behaviors, Work and Leisure Today Survey
| Behavior code | Kappa | Example 1 | Example 2 |
|---|---|---|---|
| 1) Actor | 0.998 | Respondent | Respondent |
| 2) Initial action | 0.88 | Answers question | Asks for clarification or definition |
| 3) Assessment of initial action | 0.21 to 0.76 | Provides adequate answer | Asks to repeat response options |
| 4) Details of action | 0.56 to 0.68 | Without elaboration | n.a. |
| 5) Laughter | 0.96 | The respondent laughs | No laughter |
| 6) Disfluencies | 0.87 | There are no disfluencies, stutters, or repairs | There are disfluencies, stutters, or repairs |
| 7) Interruptions | 0.94 | There are no interruptions | The respondent interrupts the interviewer |
Expert coders independently double-coded a 10 percent subsample of the survey transcripts to assess intercoder reliability. The reliability of these codes was quite high (table 3)—all but one kappa value exceeded 0.56, meeting a minimum kappa requirement of 0.40 (Bilgen and Belli 2010). The exception was the assessment of type of clarification (kappa = 0.21); thus, we aggregate clarifications into four more general categories.
We differentiate between four types of respondent behaviors with the behavior codes: (1) respondent-answering behavior such as providing an adequate response with or without elaborations (e.g., respondents stating “5” versus elaborating on their answer “5. I really like swimming”), or an uncodable answer that cannot be coded into the response format; (2) nonverbal utterances such as laughter or disfluencies; (3) personal involvement and rapport reflecting more general conversational processes and rapport; and (4) requests for clarifications such as asking for a definition of a term indicative of some form of cognitive difficulty.
We calculate the number of conversational turns on which each respondent behavior occurred throughout the entire interview for each respondent. Table 4 provides a summary of each behavior, its definition, and descriptive statistics.
Mean and Standard Deviation of Total Number of Turns with Respondent Behaviors
| Behavior code | Definition | Mean | SD |
|---|---|---|---|
| Respondent answering behaviors | |||
| Adequate answer | Provides an answer that can be coded according to the response format | 45.83 | 9.06 |
| With elaboration | 3.57 | 3.41 | |
| Without elaboration | 42.18 | 9.51 | |
| Qualified answer | Answers with a qualifier that shows uncertainty | 5.03 | 4.47 |
| With elaboration | 0.91 | 1.61 | |
| Without elaboration | 4.12 | 3.61 | |
| Uncodable answer | Provides an answer that cannot be coded according to the response format | 10.03 | 8.57 |
| With elaboration | 4.86 | 5.77 | |
| Without elaboration | 5.17 | 4.11 | |
| Don’t know | States that they don’t know or don’t remember the answer | 1.00 | 1.34 |
| Refusal | Refuses to answer the question | 0.63 | 1.35 |
| “Other” answer | States that they have an answer to a previous question or disagree with an interviewer | 0.15 | 0.55 |
| Nonverbal utterances | |||
| Laughter | Respondent laughs | 5.13 | 5.68 |
| Disfluency | Whether there are any disfluencies, stutters, or repairs | 19.53 | 12.59 |
| Personal involvement and rapport | |||
| Agrees with interviewer | Agrees with interviewer, either as verification or as showing understanding | 0.97 | 1.79 |
| Affirmative feedback | Provides an affirmative statement | 7.00 | 5.68 |
| Acknowledging feedback | Thanks interviewer or gives indication that they are thinking | 2.85 | 4.18 |
| Task-related feedback | Task-, time-, and telephone quality-related feedback | 0.24 | 0.73 |
| Digression | Engages in off-topic conversation | 1.27 | 2.86 |
| Personal disclosure | Makes statement about self or own attitudes (outside of response) | 4.02 | 6.68 |
| “Other” feedback | States an apology or negation | 1.22 | 1.38 |
| Requests for clarification | |||
| Interrupts interviewer | Respondent interrupts the interviewer | 12.45 | 12.56 |
| Clarification—repeat | Asks for repetition of the question, the response options, or definition | 1.57 | 2.04 |
| Clarification—definition | Asks for a definition of a term | 0.48 | 0.92 |
| Clarification—what | Says “What?” or “What did you say?” | 1.84 | 1.86 |
| Clarification—unit | Asks for unit of measurement for the response | 0.68 | 1.10 |
Note.—n = 433.
Adequate responses occur on an average of 45.83 conversational turns, with respondents providing adequate responses without elaboration on an average of 42.18 conversational turns and with elaboration on 3.57 turns. Providing an uncodable response was the second most frequent response behavior, occurring on 10.03 turns, roughly equally split between uncodable responses without elaborations (mean = 5.17) and with elaborations (mean = 4.86). Disfluencies occur on an average of 19.53 conversational turns, and interruptions occur on 12.45 turns.
CONTROLS
We include household composition (proxied with marital status) and general questionnaire burden, that is, whether a respondent triggered a series of follow-up questions related to computer use and the number of questions (see table 2).
All continuous independent variables are grand-mean-centered (Raudenbush and Byrk 2002).
METHODS
We evaluate the association between indicators of heuristic and systematic processing for each of the interviewer assessments using a two-level ordered logistic regression model with an interviewer random effect with the meologit command in Stata 14 (Stata 2015). Each interviewer j = 1 … M has i = 1 … nj respondents, with K possible outcomes and cutpoints labeled as K1, K2 … KK-1, including covariates for the fixed effects, and random effects . For response , the probability of observing outcome k is (Stata 2015). Friendliness is a binary variable and therefore analyzed with a traditional logistic regression model.
Ordered-logistic models assume proportional odds across each pair of outcomes. Although this assumption is violated in some instances, our conclusions do not change, so we report the more parsimonious ordered-logistic models.1 Several robustness checks, including outlier diagnostics for the independent variables, show that all results generally hold when re-estimating these models censoring cases with high numbers of behaviors at the 95th percentile (results available on request).
Three models were estimated for each of the interviewer assessments. Model 1 is a null model as a baseline; model 2 includes variables associated with heuristic processing and controls; and model 3 adds variables capturing systematic processing. Unless indicated otherwise, none of the results from previously estimated models change using this stepwise approach. As such, we display results for model 3 only (for full results, see online appendix B).
We report the odds ratio and the average marginal effects (AME) for each statistically significant respondent behavior in the text. For each respondent, the AME calculates the difference in the predicted probability between each category of the outcome variable, holding the independent variable at a given value. This difference is then averaged across all respondents. Mathematically, the marginal change in probability is computed as (Long and Freese 2006):
Holding all other variables constant, this is the slope of the curve relating to for each outcome. For categorical variables, the interpretation of the AME is straightforward—the effect of being in the focal category of the independent variable compared to the reference category. For continuous variables, the AME is related to a very small change (approximately the standard deviation of the variable divided by 1,000) in the independent variable. An AME of 5.0 would indicate that a very small unit increase in the independent variable (e.g., number of conversational turns with adequate responses) yields a five-percentage-point increase in the probability of a specific outcome occurring (e.g., the interviewer rating the respondent as very talkative). AMEs yield a straightforward interpretation of effect sizes and can be compared across models (Mood 2010). Because ordinal logistic regression models have multiple outcome categories, we only report the AME in percentage points for the highest category of each interviewer rating.
Results: Which Strategies Do Interviewers Use?
HEURISTIC PROCESSING
In an empty two-level model, interviewer-related variance components account for between 27 and 36 percent of the total variance in evaluations (p < 0.05).2
Table 5 presents the coefficients for the heuristic-processing models and controls based on the full models for each of the four interviewer evaluations. Evidence of heuristic processing for any of the outcomes in this study is limited. Talkativeness is explained by respondent characteristics, with an 18.8 percent reduction in the interviewer variance for talkativeness due to the inclusion of respondent characteristics. The associations between heuristic processing and the other outcomes are more modest, reaching a 4 percent reduction in interviewer-level variance for cooperativeness and modest increases in interviewer-level variance for interest and friendliness evaluations.
Multilevel Ordered Logistic Regression Coefficients and Standard Errors Predicting Interviewer Evaluations of Cooperativeness, Interest, Friendliness, and Talkativeness with Indicators of Heuristic and Systematic Processing
| Cooperativeness | Interest | Friendliness | Talkativeness | |
|---|---|---|---|---|
| Heuristic processing Respondent characteristics | ||||
| Age (cent.) | 0.00 | –0.00 | 0.00 | 0.00 |
| Female (ref. Male) | –0.07 | –0.23 | 0.09 | 0.76*** |
| Nonwhite (ref. White) | 0.03 | 0.25 | –0.15 | –0.53 |
| High school or less | –0.39 | –0.63* | –0.58 | 0.67** |
| Income | –0.04 | –0.07 | –0.04 | 0.01 |
| Interviewer characteristics | ||||
| Female (ref. Male) | 0.35 | –1.08 | 0.19 | 0.59 |
| Nonwhite (ref. White) | –0.47 | –0.09 | 0.23 | –0.74 |
| Interviewer experience 1+ year(s) | –1.18 | –1.02 | 0.85 | –0.25 |
| Cooperation rate | –0.04 | 0.48 | –0.65 | –0.62 |
| Respondent control variables | ||||
| Married (ref. Unmarried) | 0.19 | –0.10 | –0.24 | –0.37 |
| Computer user | 0.88* | 0.68* | 0.12 | 0.03 |
| # of questions asked (cent.) | 0.02 | 0.04 | 0.05 | 0.04 |
| Systematic processing Respondent answering behaviors | ||||
| Adequate answer with elaboration | –0.04 | 0.05 | 0.02 | 0.17*** |
| Adequate answer w/o elaboration | –0.03 | –0.01 | 0.00 | 0.04 |
| Qualified answer with elaboration | –0.12 | 0.07 | 0.40** | 0.10 |
| Qualified answer w/o elaboration | –0.03 | –0.04 | 0.03 | 0.02 |
| Uncodable answer with elaboration | –0.05 | 0.01 | –0.07 | 0.08* |
| Uncodable answer w/o elaboration | –0.09* | –0.08* | –0.03 | –0.03 |
| Don’t know | –0.17 | –0.33*** | –0.38*** | –0.17* |
| Refusal | –0.37*** | –0.26** | –0.30** | –0.07 |
| “Other” answer | 0.24 | 0.07 | 0.00 | –0.03 |
| Nonverbal utterances | ||||
| Laughter | 0.06 | 0.08** | 0.14*** | –0.03 |
| Disfluency | 0.04** | 0.03** | 0.02 | 0.02 |
| Personal involvement and rapport | ||||
| Agrees with interviewer | –0.08 | –0.03 | 0.08 | –0.03 |
| Affirmative feedback | 0.14*** | –0.03 | 0.05 | –0.05 |
| Acknowledging feedback | 0.04 | 0.04 | 0.09 | 0.04 |
| Task-related feedback | –0.04 | –0.03 | –0.27 | –0.07 |
| Digression | 0.11 | 0.03 | 0.08 | 0.07 |
| Personal disclosure | –0.02 | –0.03 | –0.05 | 0.08** |
| “Other” feedback | 0.06 | –0.02 | 0.02 | –0.06 |
| Clarification behaviors | ||||
| Interrupts interviewer | –0.04 | 0.01 | –0.00 | 0.01 |
| Clarification—repeat | –0.02 | 0.02 | 0.08 | –0.00 |
| Clarification—definition | –0.03 | –0.08 | 0.04 | 0.08 |
| Clarification—what | –0.17* | –0.21** | –0.14 | –0.02 |
| Clarification—unit | –0.13 | –0.04 | –0.18 | 0.02 |
| Intercept 1 | –4.77*** | –1.81 | 0.41 | –5.24*** |
| Intercept 2 | –1.50 | 0.55 | –2.99*** | |
| Intercept 3 | 0.45 | |||
| Intercept 4 | 3.66** | |||
| Interviewer-level variance | 2.03* | 2.16** | 1.89* | 2.15** |
| Model fit: | ||||
| AIC | 595.57 | 790.28 | 492.03 | 937.98 |
| Observations | 433 | 433 | 433 | 433 |
Note.—Model 3. See online appendix B for full models. The intercepts refer to the cutpoints or thresholds of the latent underlying variable y*. When the value of y* is above this threshold, the observed category in the outcome variable y changes (Long and Freese 2006, p. 185). For cooperativeness, fair and below ≤ intercept 1 < good ≤ intercept 2 < very good. For interest, average and below ≤ intercept 1 < above average ≤ intercept 2 < very high. “Friendly and eager” takes the value of 1 in the friendliness model. For talkativeness, very untalkative ≤ intercept 1, …≤ intercept 4 < very talkative.
*p < 0.05, **p < 0.01, ***p < 0.00.
With respect to respondent characteristics, even after controlling for actual respondent behaviors, interviewers evaluate women as significantly more talkative (OR = 1.96, p < 0.001; AME = 3.90) than men in all models, as expected. Women are 3.9 percentage points more likely to be rated as “very talkative” than men. Additionally, interviewers rate respondents with a high school degree or less as significantly less interested (OR = 0.53, p < 0.05; AME = –7.56), as expected, and significantly more talkative (OR = 2.14, p < 0.001; AME = 3.46) than their more educated counterparts (here, 7.56 percentage points less likely to be rated as “very interested” and 3.46 percentage points more likely to be rated as “very talkative” than their more educated counterparts). Counter to the heuristic-processing hypotheses, none of the respondent characteristics are significantly related to interviewer assessments of respondents’ cooperativeness or friendliness. None of the interviewer characteristics are statistically significantly associated with any of the evaluations.
The interviewer’s gender and race do not moderate the effect of the respondent’s gender and race on each of the four types of evaluations (results not shown). None of the interaction effects are statistically significant, and their inclusion does not change our substantive conclusions.
Regarding the control variables, interviewers evaluate computer users as significantly more cooperative (OR = 2.42, p < 0.05; AME = 1.2) and more interested (OR = 1.98, p < 0.05; AME = 8.2). Although computer use was included as a measure of questionnaire burden, these results suggest that computer use also proxies for higher socioeconomic status. The initially significant positive effect of number of questions asked (OR = 1.09, p < 0.01) on talkativeness is fully absorbed when actual respondent behaviors are included. No other control variable is statistically significantly related to any of the evaluations in this study.
SYSTEMATIC PROCESSING
Table 5 presents the results for the systematic-processing hypotheses based on the full models for each interviewer evaluation. There is clear evidence for systematic behavior-based processing for each of the interviewer evaluations in this study. As expected, behaviors related to the process of responding and nonverbal mannerisms are significant predictors of respondent cooperativeness, interest, friendliness, and talkativeness. Particularly important and supportive of systematic processing is that different responding behaviors predict each of the assessments. Indicators of other conversational processes, including rapport building and clarification requests, are less consistently associated with interviewer assessments.
We hypothesized that adequate answering behaviors would be associated with higher ratings of cooperativeness, interest, and friendliness, whereas any form of inadequate answer would be associated with lower ratings of cooperativeness. Surprisingly, adequate and qualified answers—the most frequent types of respondent answering behaviors—are each associated with only one of the four interviewer evaluations. Elaborations were expected to be negatively associated with ratings of cooperativeness, but positively associated with friendliness and talkativeness. As hypothesized, adequate answers with elaboration (OR = 1.18, p < 0.001; AME = 0.9) are positively associated with respondents being perceived as more talkative but not associated with friendliness (OR = 1.02, p = 0.751). As the number of adequate answers with elaboration increases slightly from the mean, the probability of being evaluated as very talkative increases by 0.9 percentage points. However, providing adequate answers without elaboration is associated neither with evaluations of talkativeness at traditional levels (OR = 1.04, p = 0.103) nor with any other evaluation. Respondents who provide higher numbers of qualified answers with elaborations are evaluated as friendlier (OR = 1.49, p < 0.01; AME = 5.9). Qualified answers with elaborations are not associated with any other evaluation.
As anticipated, interviewers rate respondents more unfavorably the more often a task is left incomplete by the respondent. Interviewers rate respondents who provide more uncodable answers with elaboration (OR = 1.08, p < 0.05; AME = 0.4) as more talkative; don’t know responses (OR = 0.84, p < 0.05; AME = –0.9) result in ratings of respondents as being less talkative. Interviewers rate respondents as less cooperative when they provide more uncodable answers without elaboration (OR = 0.91, p < 0.05; AME = –1.3) or refuse to answer (OR = 0.69, p < 0.001; AME = –5.1). Similarly, respondents who provide more uncodable responses without elaboration (OR = 0.92, p < 0.05; AME = –1.0), who provide more “don’t know” responses (OR = 0.72, p < 0.001; AME = –4.0), and who refuse to respond to a question (OR = 0.77, p < 0.01; AME = –3.1) are evaluated as less interested. Respondents who provide more don’t know responses (OR = 0.68, p < 0.001; AME = –5.6) or refuse to provide a response (OR = 0.74, p < 0.01; AME = –4.4) are also rated as being less friendly.
We anticipate that nonverbal utterances of respondent laughter are positively associated with evaluations of respondent cooperativeness, interest, and friendliness, whereas the effect of disfluencies is less straightforward. Interviewers generally evaluate respondents more favorably when respondents display more of these normal conversational behaviors. Respondents who laugh more are evaluated as being more interested and friendly (OR = 1.08, p < 0.01; AME = 1.0; OR = 1.15, p < 0.001; AME = 2.0), but not as being more cooperative or talkative (OR = 1.06, p = 0.070; OR = 0.98, p = 0.307). Respondents who speak with more disfluencies are rated as being more cooperative and interested, confirming the “disfluency advantage” (OR = 1.04, p < 0.01; AME = 0.6; OR = 1.03, p < 0.01; AME = 0.4). Disfluencies are not associated with evaluations of being friendly (OR = 1.02, p = 0.246) or talkative (OR = 1.02, p = 0.149).
We expected verbal rapport and personal involvement behaviors to be associated with higher ratings of friendliness and talkativeness. Few behaviors related to personal involvement predict such assessments. Respondents who provide more affirmative feedback are perceived as being more cooperative (OR = 1.15, p < 0.001; AME = 1.9), and respondents who disclose personal information more frequently are perceived as more talkative (OR = 1.08, p < 0.01; AME = 0.4). Contrary to expectations, requests for clarification are not associated with higher ratings of cooperativeness and interest: Respondents who use more “What?” clarification requests (e.g., “What did you say?”) are perceived as being less cooperative and less interested (OR = 0.84, p < 0.05; AME = –2.4; OR = 0.81, p < 0.01; AME = –2.6). None of the other personal involvement behaviors are associated with any of the evaluations.
The AIC goodness-of-fit statistics show that while including indicators of heuristic processing improves model fit slightly, the drop in AIC and hence model improvement is largest when incorporating information on respondent behaviors, particularly related to the quality of the response and other nonverbal mannerisms (online appendix B). Interestingly, interviewer-level variance in these evaluations increases in all models once accounting for respondent behaviors, indicating heterogeneity in respondent behaviors across interviewers (Raudenbush and Bryk 2002).
Figure 1 shows the predicted probability for the two extreme categories of each of the interviewer evaluations. More specifically, we computed the predicted probability of being in the extreme categories for each interviewer evaluation. We set each significant independent variable at one standard deviation below the mean, the mean, and one standard deviation above the mean and hold all other variables at their observed values (online appendix C). The predicted probability of being rated as very cooperative (/fair and below) for someone who provides fewer uncodable answers, that is, one standard deviation below the mean, is 0.69 (/0.05) compared to 0.58 (/0.08) for someone who provides more uncodable answers, that is, one standard deviation above the mean.
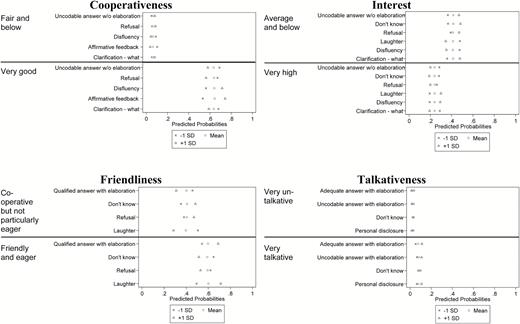
Adjusted Predictions for Significant Systematic Processing Indicators.
Our results suggest that interviewers perceive and use respondent behaviors to make their assessments rather than drawing on respondent attributes based on social categories. These results also suggest that interviewers’ assessments are predominantly influenced by respondents’ question-answering behaviors and nonverbal behaviors. Thus, interviewers differentiate across respondent behaviors in their assessments, incorporating those pieces of information that are most relevant to the judgment they are asked to make.
Conclusion and Discussion
Using the continuum model of impression formation, we investigated whether interviewers base their assessment of respondent engagement on stereotypes, their own characteristics, or interactions with the respondent. Overall, interviewer assessments vary systematically across interviewers. Although this systematic variation across interviewers occurs, for the task-related evaluation of cooperativeness, there is no evidence of any heuristic evaluation or inappropriate stereotyping beyond the respondents’ actual behavior. We find a similar lack of association with the more interpersonal assessment of friendliness. Education and gender are associated with the assessments of interest (education only) and talkativeness. None of the interviewer characteristics explained the statistically significant interviewer variation. One possible explanation for this finding could be that while interviewers rely on their own traits and experiences, we do not adequately measure the interviewer characteristics that lead to these differences. For example, gender may not matter as much as an interviewer’s perceptual ability.
Instead of using heuristic processing, interviewers rely on a more sophisticated strategy of information processing based on the quality of the data provided by the respondent and other behaviors throughout the interview. While using systematic processing, interviewers rely primarily on behaviors associated with the immediate response task and measures of nonverbal communication in the interpersonal interaction. That is, although interviewers vary significantly in their assessments of respondents, the assessments are based on the actual interaction with the respondent even if those occur infrequently (e.g., don’t know responses). This is important because respondent behaviors such as uncodable, don’t know, and refusal answers are associated with lower data quality, and in particular, with lower accuracy (e.g., Mathiowetz 1998). Indicators of rapport or personal involvement and requests for clarification indicating cognitive difficulty are much less likely to be associated with these four ratings of respondents.
Further analyses not presented here (see online appendix D) confirm that the assessments made by interviewers are valid. The variability across respondents is greater than the variability across interviewers, and the proportion of variance uniquely explained by indicators of systematic processing is substantially larger compared to the proportion of variance uniquely attributable to heuristic processing. Further research can be done to explain the unexplained variance at both the interviewer and respondent level—the behaviors themselves explain about one-quarter or less of the total variance in the assessments and less than one-third of the within-interviewer variance. Overall, our findings provide insight into the cognitive processes interviewers use when assessing respondents’ engagement.
The implications of these findings are many. First, these results suggest that the extra effort and money spent by survey organizations to collect evaluations results in assessments that reflect the interviewer-respondent interaction. A simple assessment of how the interviewer thinks the interview went is a less expensive insight than a more elaborate behavior coding study. Of course, the evaluations do not indicate what exactly went wrong during an interaction, and thus are not a full replacement for behavior coding. Additionally, this study does not assess exactly how useful these indicators are for assessing measurement error directly; this will be examined in future research.
Second, the implications for the use of these postsurvey evaluations in measurement error models are mixed. It is clear from these data that refusals or reports of don’t know contribute to how interviewers answer these evaluation questions. Thus, studies that use these evaluations to predict item-nonresponse rates (e.g., Kaminska, McCutcheon, and Billiet 2010) use endogenous measures. That is, a significant association between these evaluations and item nonresponse (e.g., Tarnai and Paxson 2005) will not be surprising because the don’t know responses and refusals themselves were used by the interviewer to make these evaluations. To the extent that the ratings identify potential item nonrespondents and are associated with the survey variables of interest, these ratings are useful as covariates in imputation models (as suggested by Mathiowetz [1998]). That is, the endogeneity of these measures is a problem for causal models, but could be beneficial for imputation models.
Third, these interactional properties of an interview could be important to respondents and their willingness to continue to participate in longitudinal studies (e.g., Lepkowski and Couper 2002). The association of the interviewer ratings with interview behaviors suggests that future research should more thoroughly investigate the potential of these ratings in response propensity models (in longitudinal studies) and their potential utility for responsive designs (Groves and Heeringa 2006).
Fourth, survey organizations that want to reduce the amount of variation over interviewers due to factors other than these behaviors could train interviewers about how to fill out these assessments. This kind of additional training on how to complete these evaluations would likely strengthen the association between behaviors and postsurvey evaluations and reduce inter-interviewer variance. Alternatively, if training is difficult or interviewer-related variance cannot be reduced, survey organizations who have collected interviewer assessments over multiple studies are advised to calculate interviewer-adjusted ratings. This kind of calibration will allow research organizations to adjust the evaluations for the interviewer’s own perspective, separate from the behaviors themselves.3
Finally, although the interview behaviors are associated with the assessments of interest, friendliness, cooperativeness, and talkativeness, the explained variation due to these behaviors—that is, the signal-to-noise ratio—is moderate (see online appendix D). That is, for any given respondent, the quality of the measurement is weak (the confidence interval around a predicted value would be wide given the poor measurement). Thus, using these observations to flag an individual respondent for potential removal from a dataset is unwise. Yet these ratings may successfully identify groups of respondents who should be investigated for potentially providing lower-quality data (e.g., evidence of straightlining, satisficing, or other kinds of inconsistent answers). Additionally, because the measures are valid, but somewhat unreliable, survey organizations could compare across studies, across time, or across groups of respondents as long as there is an approximate interpenetration (random assignment) of cases to interviewers, a design feature common in telephone surveys. If interpenetration is not achieved, then an interviewer-adjusted score may be warranted before such comparisons are made.4
This study has limitations. The telephone setting potentially suppresses some of the stereotyping effects relative to a face-to-face survey where interviewers see the physical characteristics of the respondents. Second, the sample is based on a landline RDD survey, leading to a more homogeneous set of respondents. Third, we looked at one study, but expect our results to generalize to other telephone surveys with different topics or lengths. Although the respondent behaviors may differ in another survey, we anticipate that interviewers will incorporate information about the respondents’ behaviors into their evaluations. Future research should examine interviewer evaluations on questionnaires with different types of items (e.g., more sensitive or complex items). Fourth, perceptions and behaviors of the interviewer likely elicit corresponding behavior by the respondent, but interviewer behaviors were not included here. Fifth, our sample size and number of interviewers is limited. Future research should replicate this study using a larger sample. Finally, our study investigates interviewer evaluations collected by an individual survey organization and should be replicated across different organizations to strengthen our inferences.
Overall, our results show that in postsurvey evaluations interviewers evaluate respondents based on their behaviors and distinguish subtleties in those behaviors, rather than their social categories. Telephone survey interview organizations and researchers can be confident that these evaluations provide a valid summary of the interaction between these two key actors.
Supplementary Data
Supplementary data are freely available at Public Opinion Quarterly online.
Antje Kirchner is a research survey methodologist in the Survey Research Division at RTI International, Research Triangle Park, NC, USA, and an adjunct research assistant professor in the Department of Sociology at the University of Nebraska–Lincoln, Lincoln, NE, USA. Kristen Olson is an associate professor in the Department of Sociology at the University of Nebraska–Lincoln, Lincoln, NE, USA. Jolene D. Smyth is an associate professor in the Department of Sociology, and director of the Bureau of Sociological Research at the University of Nebraska–Lincoln, Lincoln, NE, USA. This material is based upon work supported by the National Science Foundation [SES-1132015 to K.O.]. Any opinions, findings, and conclusions or recommendations expressed in this material are those of the authors and do not necessarily reflect the views of the National Science Foundation. An earlier version of this paper was presented at the Annual Conference of the Midwest Association for Public Opinion Research, November 2015, Chicago, IL, USA. The authors thank the anonymous reviewers and the editors for feedback.
References
Footnotes
We assessed the proportional odds assumption by analyzing mixed-effects multinomial logistic models. We constrained the slopes to be equivalent across the categories of the outcome variables (the proportional odds assumption) and freed the slope parameters in a traditional multinomial model to calculate the appropriate test statistic.
These variance components were estimated based upon a two-level logistic model (melogit). Likelihood-ratio tests show sufficient variability between interviewers to justify mixed-effects models (available from the authors upon request).
We thank the editors for this insight.
We also thank the editors for this insight.
