


Abstract
Out-of-pocket payments for health are considered a major limitation to universal health coverage (UHC). Policymakers across the globe are committed to achieving UHC through the removal of financial barriers to health care. In Ghana, a national health insurance scheme was established for this purpose. A unique feature of the scheme is its premium exemption policies for vulnerable groups. In this article, we access the nature of socioeconomic inequality in these exemption policies. We used data from the Ghana Living Standards Survey rounds six and seven. Socioeconomic inequality was assessed using concentration curves and indices. Real household annual total consumption expenditure adjusted by adult equivalence scale was used as a wealth indicator. Four categories of exemption were used as outcome variables. These were exemptions for indigents, individuals <18 years, the aged and free maternal service. The analysis was also disaggregated by rural and urban locations of individuals. We found that while overall national health insurance scheme (NHIS) coverage was concentrated among the wealthy, all categories of premium exemption were concentrated among the poor. There was also evidence of a general decline in the magnitude of inequality over the survey years. With the specific exemptions, inequalities in exemption for indigents and maternal services were most relevant in rural locations, while inequalities in exemption for individuals <18 years and the aged were significant in urban areas. The findings suggest that the exemption policies under the NHIS are generally progressive and achieve the objective of inclusion for the underprivileged. However, it also provides lessons for better targeting and effective implementation. There may be a need for separate efforts to better target individuals in rural and urban locations to improve enrolment.
Ghana’s NHIS seeks to include the poor and vulnerable through various premium exemption policies. However, very little is known about the effectiveness of the policies in reaching the target population.
We find that while general NHIS coverage is concentrated among the rich, exemption policies mostly favoured the poor.
Pro-poor inequality in premium exemption was not consistent across rural and urban populations. Inequality in exemption policies for indigents and free maternal service (FMS) was relevant for rural dwellers, while inequality in exemption for the aged and individuals <18 years was relevant for urban dwellers.
Periodic review of the exemption policies to ensure effectiveness and encourage enrolment will be a step in the right direction.
Introduction
Many low- and middle-income countries still finance their health care using out-of-pocket (OOP) payments. Specifically, user charges remain a predominant health financing source as a result of insufficient public health spending (Qin et al., 2019). However, OOP payments have the propensity to be catastrophic, driving households into poverty (Xu et al., 2003). Recent evidence shows that almost 100 million people across the globe are pushed into poverty as a result of their health expenses (Wagstaff et al., 2018b; 2018a). Universal health coverage (UHC) was included as part of the SDGs to track and deal with the impoverishing effects of OOP payments1. UHC is therefore considered one of the central themes of the Sustainable Development Goals (SDGs) (WHO, 2015). UHC aims at ensuring that people have access to the health care they need without suffering from financial catastrophe. To achieve this, prepaid means of health financing are widely being encouraged (Spaan et al., 2012; Parmar et al., 2014; Liu et al., 2019).
In response to this, countries have implemented various health financing strategies to support progress towards UHC (Qin et al., 2019). Specifically, the introduction and expansion of health insurance coverage have been an important policy reform for many low-income countries (Spaan et al., 2012). Ghana is considered one of the first countries to establish a national health insurance scheme (NHIS) in sub-Sahara Africa (Dake, 2018; Okoroh et al., 2018). The scheme was established in 2004 and has been in operation for more than a decade. It is widely touted as the single largest financing reform in the health sector of the country.
The Ghana NHIS has generated much interest and attention for several reasons. One of these is the unique design of the scheme to ensure equity and inclusion. The scheme is particularly designed to ensure that vulnerable and under-served populations are not left behind. This is achieved through the various exemption policies implemented under the scheme. Indeed, previous studies have showed that the scheme has achieved some protective impact on various health outcomes including healthcare utilization, OOP, catastrophic health expenditure (CHE), maternal health and child health. Regarding utilization, evidence suggests that NHIS may have led to an increase in the utilization of health care by the insured (Blanchet et al., 2012; Awoke et al., 2017; van der Wielen et al., 2018). On OOP payments as well as CHE, NHIS was found to be associated with a reduction in OOP and that the insured were less likely to face CHE (Okoroh et al., 2018; 2020). To a large extent, studies showed that NHIS is associated with improvements in child and maternal health (Mensah et al., 2010; Brugiavini and Pace, 2016; Wang et al., 2017; Bagnoli, 2019). In a much more recent study, Chirwa et al. (2020) showed that the NHIS improved mental health, but the effect is relatively higher for the rich. A few studies have also assessed equity aspects of the NHIS. For instance, using the 2008 Ghana Demographic Health Survey, Dake (2018), found that the poor lacked coverage of health insurance and that the coverage was the highest among the highly educated, professionals, those from households in the richest wealth quintile and urban residents. Other studies have also assessed the effectiveness of the exemption policies of the NHIS. Available evidence suggest that the NHIS exemption policy for the aged increased insurance coverage of the aged and their utilization of healthcare services (Duku et al., 2015). However, Kanchebe Derbile and van der Geest (2012) were of the view that poorer individuals had very little access to exemptions. This had previously been attributed to the lack of proper public awareness (Kanchebe Derbile and van der Geest, 2012).
While the discussions so far suggest growing evidence in the literature on the effectiveness of the NHIS, there are some equity aspects that still remain nuanced. We therefore seek to explore this further by assessing the nature of socioeconomic inequalities in the scheme’s exemption policies. This provides useful details about the effectiveness of the scheme in achieving its primary objective of improving equity. For instance, while the exemption policies were designed in favour of the poor, there is no evidence that confirms this objective. Our research question seeks to explore these details. The study deviates from previous studies and provides unique contribution to the literature. Indeed, to the best of our knowledge, there are no previous studies that examine socioeconomic inequalities in the NHIS premium exemption policies.
In addition, we also explore heterogeneities that may exist across rural and urban dwellers in Ghana. While the NHIS and its exemption policies were designed to remove financial barriers across the population, incentive to subscribe to the scheme vary between urban and rural dwellers. Access to health care and utilization of the same is largely in favour of urban dwellers (Agbenyo et al., 2017). Therefore, subscription to the scheme may be worth less if there are no facilities to utilize. Moreover, the high levels of poverty and deprivation make payments challenging among rural folks (Ghana Statistical Service, 2018). As mentioned earlier, some premium exemption policies require individuals to pay processing fees before benefiting from the exemption. While these fees are generally considered insignificant, it may be a deterrent for some rural dwellers. To provide a better understanding of the situation, we explore these heterogeneities further in our study.
Ghana NHIS and exemption policies
Ghana’s NHIS was first introduced in 2003 through an Act of parliament (ACT 650, Amended Act 852). Full implementation of the scheme however started in 2004. The scheme was an amalgamation of existing mutual health insurance schemes that were operated in various districts in Ghana in response to the needs of the people within the districts. In the initial structure of the mutual health insurance schemes, people were restricted to use health facilities within the districts they registered. However, the amalgamation of the schemes made it possible for people to enrol and receive treatment when needed, wherever they may be within the country. It is estimated that the scheme covered over 10 million people (approximately 38% of the national population)2.
The NHIS is financed through a central National Health Insurance Fund (NHIF), which is sourced from the National Health Insurance Levy (NHIL). The NHIF is composed largely of 2.5% value-added tax (VAT) on selected goods and services; 2.5% of Social Security and National Insurance Trust (SSNIT) contributions (largely by formal sector workers); and payment of premiums and donor funds. Other sources of funding to the NHIF include money allocated by parliament of Ghana, grants, donations, gifts/voluntary contributions and interests accrued from investments. The case has been made that using VAT revenue makes the scheme progressive and keeps pace with economic growth (Huihui, Otoo, and Dsane-Selby, 2017). Indeed, contributions from VAT account for over 90% of the scheme’s revenues. The scheme covers about 95% of disease conditions in Ghana including both inpatient and outpatient services.
An important feature of the NHIS is its premium exemption policies. These policies are directed at ensuring that the poor and vulnerable are not left behind because they cannot afford to pay premiums. This is a crucial feature with potentially important equity implications, if implemented well. Indeed, user fee exemptions have always been part of the healthcare system in Ghana. As Kanchebe Derbile and van der Geest (2012) shows, exemption policies in Ghana dates back to the 1960s, through the periods of full user fees. Under the NHIS, exemptions are designed in a way that different categories of people have different exemption policies. One group of people are required to pay processing fees but not premiums. These include the following: (i) Contributors to the SSNIT who do not pay premiums—it is assumed that this group of individuals pay their premiums indirectly through their SSNIT contributions, (ii) children aged <18 and (iii) individuals >70 years of age (NHIA, 2012). The second group of people are exempted from paying both premiums and processing fees. These include (i) pregnant women, (ii) beneficiaries of the Livelihood Empowerment Against Poverty (LEAP) programme and (iii) indigents. They are, however, required to register and possess a card to benefit from the scheme. The benefit packages, however, remain the same for all members registered under the scheme whether exempted from paying premiums and/or processing fees. The processing fee, as reported in the 2013 annual report of the NHIA, is GH¢8 for children under the age of 18 years, adults above 70 years and SSNIT contributors. Adults between 18 and 30 years pay a premium of GH¢30 upon registration. However, for renewal, children <18 years, adults >70 years and SSNIT contributors pay GH¢5, while adults between 18 and 69 years pay GH¢27.
Methods
Statistical analysis
To achieve the objectives of the study, we performed our analysis in three stages. First, we undertook a univariate analysis to show the distribution of the sample using descriptive statistics. Second, we constructed concentration curves (CCs) for each of the exemption categories. This was done to explore the existence of inequalities in any of the exemption categories. The CC was used to provide a pictorial view of the pattern of inequality in our variables of interest. The CC plots the cumulative share of a specific exemption category on the |$y$|-axis and wealth status (indicator of economic status) ranked by the cumulative percentage of the population on the |$x$|-axis. If the CC lies above the line of equality (45o straight line from the origin), it means that the particular exemption category was concentrated among the less wealthy. If the CC lies below the equality line, then it means wealthier individuals benefited more from the particular exemption policy. No socioeconomic inequality (or perfect equality) in a specific exemption category exists if the CC coincides with the line of equality (O’Donnell et al., 2008).
Despite its ability to provide a good glimpse of inequality, the CC does not quantify the extent or magnitude of socioeconomic inequality in the variable of interest. Consequently, we proceed to a third stage where concentration indices (CIs) were computed to assess the degree of inequality in the exemption categories. The CI has routinely been used in the literature to measure socioeconomic-related inequality in health or health-related variables (Wagstaff et al., 2009; Erreygers and Van Ourti, 2011; Kjellsson and Gerdtham, 2013). It measures ‘twice the area between the concentration curve and the line of equality’ (O’Donnell et al., 2008).
Data and variables
This study relied on the sixth and seventh rounds of the Ghana Living Standards Survey (GLSS 6 and 7). The GLSS 6 survey was conducted in 2012/2013 while the GLSS 7 was conducted in 2016/2017. The GLSS is part of the World Bank’s repeated cross-section surveys conducted nationwide by the Ghana Statistical Service (GSS). The survey aims to provide information useful for assessing living conditions of Ghanaians. Apart from the socio-demographic variables of households and its members, the survey also collected information on incomes and expenditure of households. It also provides information on health insurance coverage and exemption among members of the household. The two rounds of the survey provided samples of 71 302 and 58 564 individuals for GLSS 6 and GLSS 7, respectively. While this sample was used to assess inequality in general NHIS coverage and OOP payments, the sample for exemption policy analysis was limited to individuals with active NHIS coverage. Consequently, reduced samples of 42 000 and 32 230 were used to assess inequality in NHIS exemption policies for GLSS 6 and GLSS 7, respectively. It is worth mentioning that the GLSS 6 was only used in the computation of CIs. This was to allow for comparison of inequality magnitude over time. All analyses were performed in Stata 15. Survey weights were used to account for the survey design. The data are freely available for download at the website of the GSS: https://statsghana.gov.gh/.
There were two sets of variables required to compute and assess inequality in this study. These were the outcome indicators that measure NHIS premium exemption and the socioeconomic variable that captures wealth status of the individuals. We used four (4) different exemption categories: (i) overall exemption from NHIS premium/processing fee payment, (ii) exemption from NHIS payments as an indigent, (iii) exemption for individuals younger than 18 years, (iv) exemption for the aged and (v) exemption under FMS programme. To measure these exemption variables, we relied on questions that capture how individuals became members of the scheme. The GLSS questionnaire asked whether respondents had NHIS coverage and how coverage was acquired. Respondents were required to choose from alternatives that include each of these exemption policies. From this question we construct dummy variables that capture whether NHIS membership was acquired through each of these exemption policies.
In addition to the exemption and to help place the analysis in context, we also analysed inequality in overall NHIS coverage and OOP payment. To measure wealth status, we used real total household expenditure adjusted by adult equivalence scale. The equivalence scale is preferred for its ability to account for intra-household differences in expenditure needs. For instance, households with more children than adults are treated differently in terms of expenditure needs (Rojas, 2014). Table 1 presents detailed description of all variables used in the study.
Variable definition
| Variable name | Description |
|---|---|
| Has valid NHIS | Measured as a dummy variable with a value of 1 if an individual has a valid NHIS subscription and 0 otherwise. |
| OOP payment | Measured as a dummy variable that takes the value of 1 if the individual made payments for healthcare OOP and 0 otherwise. |
| Exempted from NHIS | Captures overall exemption from NHIS. It takes the value of 1 if the individual has any form of exemption under the NHIS and 0, if NHIS coverage was not by exemption. |
| Exempted from NHIS: Indigent | An individual exempted from NHIS payments as an indigent is coded as 1, otherwise 0. |
| Exempted from NHIS: Under 18 years | This is a dummy variable that captures all individuals younger than 18 exempted from NHIS payments. |
| Exempted from NHIS: Aged | This is a dummy variable that captures all individuals exempted from NHIS payments as aged (above 70 years). |
| Exempted from NHIS: FMS | This variable capture individual exempted under the FMS programme. This covers pre- and post-natal health care services. |
| Real household expenditure | Total household annual expenditure measured in real terms and adjusted using adult equivalence scale. It measured the wealth status of the individual. |
Results
Descriptive statistics
We first present Table 2 where we show the characteristics of the sample. As can be observed from the data, majority of the respondents indicated that they had a valid NHIS (58.9% and 54.2% for 2012 (GLSS 6) and 2016 (GLSS 7), respectively). There is however evidence of marginal decline between the two survey periods. While about 59.9% of respondents in 2012 made some OOP payments for health care, less than half of the respondents in 2016 made some OOP payments. The percentages of those exempted from NHIS payments were around 31.9% and 28% in 2012 and 2016, respectively, with less than 1% being exempted as indigent. Premium exemption for individuals <18 years was the highest (27.5% in 2012 and 21.4% in 2016) among all exemption policies. However, while exemption for the aged and FMS were relatively lower, there was an increasing trend observed over time. Exemption for the aged increased from 2.9% in 2012 to 3.2% in 2016, while exemption for FMS increased from 1.0% to 1.6% over the same period. On average, households spent around GH¢2501 and GH¢3322 Ghanaian Cedis on consumption annually per adult equivalence in 2012 and 2016, respectively (See Table 2). The table also presents additional general characteristics of the sample including age, sex and locality among others.
Descriptive statistics
| Variable | 2012 (GLSS 6) | 2016 (GLSS 7) | ||
|---|---|---|---|---|
| Mean | Std. Dev. | Mean | Std. Dev. | |
| Has valid NHIS | 0.589 | 0.492 | 0.542 | 0.498 |
| OOP | 0.599 | 0.490 | 0.404 | 0.491 |
| Exempted from NHIS | 0.319 | 0.466 | 0.276 | 0.447 |
| Exempted from NHIS: Indigent | 0.002 | 0.040 | 0.007 | 0.081 |
| Exempted from NHIS: Under 18 years | 0.275 | 0.446 | 0.214 | 0.410 |
| Exempted from NHIS: Aged | 0.029 | 0.168 | 0.032 | 0.175 |
| Exempted from NHIS: FMS | 0.010 | 0.101 | 0.016 | 0.126 |
| Age | 24.486 | 19.867 | 25.045 | 20.361 |
| Sex (male) | 0.484 | 0.500 | 0.484 | 0.500 |
| In union | 0.411 | 0.492 | 0.387 | 0.487 |
| Location (urban) | 0.381 | 0.486 | 0.429 | 0.495 |
| Household size | 4.264 | 2.783 | 4.200 | 2.867 |
| Average years of schooling | 5.987 | 4.585 | 6.196 | 4.623 |
| Annual real per capita total expenditure | 2613.550 | 2961.198 | 3595.511 | 4321.688 |
| Annual real household expenditure (Adult Equivalized) | 3273.915 | 3431.574 | 4494.108 | 4937.515 |
Source: Authors’ computation from GLSS data.
Concentration curves
In Figure 1, we show socioeconomic inequality in having a valid NHIS in Panel 1, whereas Panel 2 shows socioeconomic inequality in OOP payments. As can be observed in Panel 1, having a valid NHIS is concentrated among wealthier individuals. Similarly, in Panel 2, the figure suggests that OOP payments are concentrated among richer individuals. Regarding NHIS exemptions, Figures 2 and 3 show that the CCs lie above the line of equality. This indicates that NHIS exemption (of all types) is generally concentrated among the poor (or less wealthy).
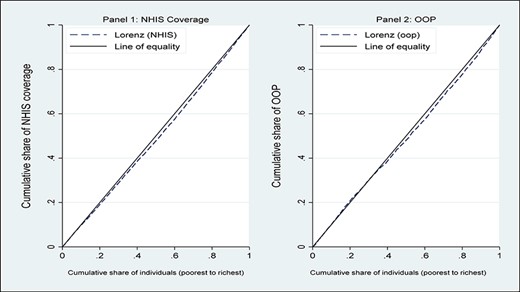
Concentration curve on NHIS coverage and OOP
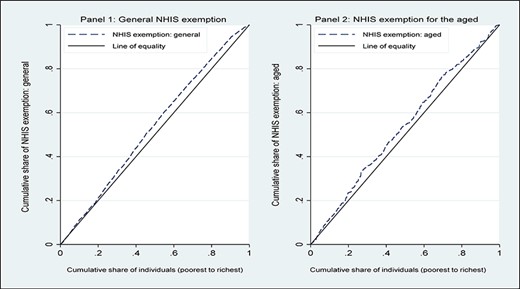
Concentration curve on NHIS Exemptions: general and aged
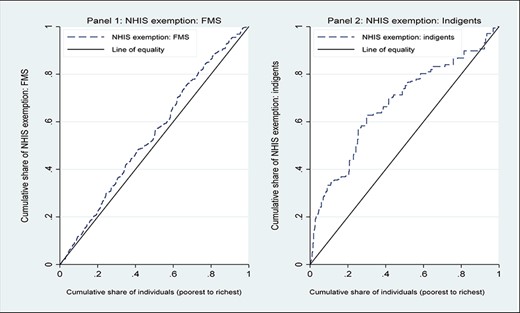
Concentration curve on NHIS Exemptions: FMS and indigents
Concentration indices
Table 3 shows CIs for the variables of interest, disaggregated by rural and urban locations. We also present results for both rounds of the GLSS to show trends in inequality. In 2012, the CIs were positive and significant suggesting that access to valid NHIS was concentrated among the rich (CI: 0.097; P < 0.01). The rural–urban disaggregation showed the same pattern. Similarly, in 2016, valid NHIS coverage was concentrated among the rich (CI: 0.080; P < 0.01). This was consistent across rural and urban locations and statistically significant. However, it can be observed that the magnitude of inequality declined over the two survey years. The results also showed that OOP payments were concentrated among richer individuals. Across both rural and urban samples and across years, similar pattern was observed. The CI for the total sample was higher in 2012 (CI: 0.119; P < 0.01) compared to 2016 (CI: 0.032; P < 0.01). In 2016, we did not find any statistical significance in socioeconomic inequality in OOP payment among the rural sample.
CIs on NHIS coverage and OOP
| 2012 (GLSS 6) | 2016 (GLSS 7) | |||||
|---|---|---|---|---|---|---|
| Total | Rural | Urban | Total | Rural | Urban | |
| NHIS | 0.097*** | 0.085*** | 0.044*** | 0.080*** | 0.037* | 0.024*** |
| (0.004) | (0.005) | (0.006) | (0.005) | (0.006) | (0.007) | |
| OOP | 0.119*** | 0.256*** | 0.104*** | 0.032*** | 0.050 | 0.122*** |
| (0.004) | (0.005) | (0.007) | (0.005) | (0.006) | (0.008) | |
| N | 71 302 | 44 159 | 27 134 | 58 564 | 21 238 | 37 326 |
Source: Authors construction from GLSS data.
Note: Significance levels: * < 10%; ** < 5%; *** < 1%. Standard errors in parentheses.
Table 4 shows results on socioeconomic inequality in the various NHIS exemption categories. These have been disaggregated by rural or urban location of the individuals. For the 2012 panel, we observed that the total CIs for overall exemption (CI: −0.119; P < 0.01), indigent exemption (CI: −0.001; P < 0.01), <18 exemption (CI: −0.116; P < 0.01), the aged (CI: −0.004; P < 0.05) and FMS exemption (CI: −0.002; P < 0.05) were all negative and significantly different from zero. This implies that the various NHIS exemptions were concentrated among the poor. The results also show that for rural (CI: −0.090; P < 0.01) and urban (CI: −0.092; P < 0.01) NHIS exemptions were concentrated among the poor. The figures also show that inequality in overall exemption was marginally higher in urban locations compared to rural locations.
CIs of NHIS exemption
| 2012 (GLSS 6) | 2016(GLSS 7) | |||||
|---|---|---|---|---|---|---|
| Exemption category | Total | Rural | Urban | Total | Rural | Urban |
| Overall | −0.119*** | −0.090*** | −0.092*** | −0.071*** | −0.038*** | −0.118*** |
| (0.005) | (0.007) | (0.008) | (0.006) | (0.007) | (0.009) | |
| Indigents | −0.001 | −0.001** | −0.001 | −0.006*** | −0.012*** | 0.002 |
| (0.001) | (0.001) | (0.001) | (0.001) | (0.002) | (0.001) | |
| Under 18 years | −0.116*** | −0.096*** | −0.088*** | −0.046*** | −0.012 | −0.105*** |
| (0.005) | (0.007) | (0.007) | (0.005) | (0.007) | (0.009) | |
| Aged | −0.004** | −0.005* | −0.004 | −0.008*** | −0.003 | −0.014*** |
| (0.002) | (0.003) | (0.003) | (0.002) | (0.003) | (0.003) | |
| FMS | −0.002* | −0.002 | −0.003 | −0.006** | −0.005** | −0.002 |
| (0.001) | (0.002) | (0.002) | (0.002) | (0.002) | (0.002) | |
| N | 42 000 | 24 942 | 17 058 | 32 230 | 19 457 | 12 773 |
Source: Authors construction from GLSS data.
Note: Significance levels: * < 10%; ** < 5%; *** < 1%. Standard errors in parentheses.
However, there were variations when the specific exemption policies were considered. For instance, while inequality in exemption for indigents was higher and statistically significant in rural locations (CI: −0.01; P < 0.01), exemption for individuals younger than 18 was higher in rural areas (CI: −0.096; P < 0.01) but significant across residential locations. Inequality in FMS appears to be significant only in the full sample. With regard to exemption for the aged, inequality was concentrated among the poor and statistically significant in the full sample (CI: −0.004; P < 0.05). However, statistical significance was only achieved in the rural sample at 10%.
While the results in 2016 generally mimic those of 2012, we also observe a general decline in the magnitude of inequality over the period. Total CIs for overall exemption (CI: −0.071; P < 0.01), indigent exemption (CI: −0.006; P < 0.01), <18 years exemption (CI: −0.046; P < 0.01), exemption for the aged (CI: −0.008; P < 0.01) and maternal service exemption (CI: −0.006; P < 0.05) were all negative and significantly different from zero. This implies that exemptions of all forms are concentrated among the poor.
Again, we noticed some variation across rural and urban locations that deserve some attention. For overall NHIS exemption, socioeconomic inequality for rural (CI: −0.038; P < 0.01) and urban (CI: −0.118; P < 0.01) residents were both concentrated among the poor, even though inequality was higher in urban locations. More interesting variations were observed across the specific exemption policies. For instance, the only exemption category that showed statistically significant inequality in rural areas was exemption for indigents (CI: −0.012; P < 0.01) and FMS (CI: −0.005; P < 0.05). Inequalities in all other exemption categories were only statistically significant in urban areas. This suggests that while there were statistically significant inequalities across all exemption categories, which was either driven by rural dwellers or urban dwellers. Over time, the evidence also suggested a generally declining trend between 2012 and 2016 across majority of the categories.
Discussion
In this article, we provide new evidence on socioeconomic inequalities in Ghana’s health insurance premium exemption policies. Using data from two rounds of the GLSS and the well-known CCs and CIs, we found that a valid NHIS subscription is concentrated among wealthier individuals. This finding resonates with Salari et al. (2019), who found that the wealthier are likely to enrol in health insurance than the poor. But the magnitude of the inequality coefficient varied across rural and urban locations. The variation across rural–urban locations may potentially be explained by the differences in economic status. Variations in health infrastructure across rural and urban locations may also explain the difference in inequality. There were also interesting findings over time in terms of inequality in valid NHIS coverage. While NHIS exemption was concentrated among the rich in both 2012 and 2016, we observed a general decline in the magnitude of inequality between the two periods.
To further provide some context for assessing inequality in NHIS exemption policies, we also examined inequality in OOP payments for health. The results indicate that, just like NHIS, OOP payments was concentrated among the rich. However, unlike NHIS, the results for OOP was consistent across time and rural–urban locations. The results also showed decline in inequalities in OOP between 2012 and 2016. The findings correspond with those of previous studies in India and Taiwan that have showed that richer individuals are likely to pay more for healthcare OOP (Chu et al., 2005; Roy and Howard, 2007). There have also been previous studies that contradict our findings and suggest that OOP is higher among the poor (Corrieri et al., 2010). However, in the case of Ghana, our findings can be justified by the introduction of the NHIS, which reduced the burden of OOP on the population, particularly for the poor. The scheme was a sharp contrast to the previous system that required patients to pay before accessing healthcare services.
On the actual exemption criteria, which is also the primary focus of this article, we found that at the aggregate level, NHIS exemption is concentrated among the poor. The result may seem contrary to previous studies that suggest the poor were excluded from the NHIS (Dake, 2018; Okoroh et al., 2018). However, given that the scheme currently covers only about 40% of the population, there may still be some vulnerable individuals not covered. Furthermore, NHIS exemption was found to be mostly concentrated among the poor. This conforms to the primary objective of the scheme to ensure inclusion. It also emphasizes the fact that, while payment of premiums may limit the participation of less-privileged individuals, the exemption policies have helped reach out to such individuals.
Additionally, we also established that between the two survey years, the magnitude of socioeconomic inequality in the exemption policies had declined. The reduction in the magnitude was, relatively, higher in rural areas. One probable explanation for this result may be the introduction of programmes such as the LEAP programme, which have enabled the vulnerable, and mostly rural dwellers, to have access to valid NHIS in Ghana (Owusu-Addo et al., 2018; Palermo et al., 2019).
The rural–urban disaggregation of the results also reveals interesting details for discussion. For instance, in 2016, while inequalities in exemptions for indigents and maternal services were only significant in rural areas, exemptions for <18 years and the aged were relevant in urban locations. This can be explained by the fact that the relatively low-income levels in rural communities make exemption for indigents significant in these locations. In addition, unlike other categories, these two exemption categories do not require payment of both processing fees and premiums. It is therefore easier for the poor and vulnerable in rural communities to make use of these exemptions. The higher statistical significance in urban locations for the other categories may be attributed to the requirement to pay for processing fees to guarantee enrolment. In rural communities where incomes are low, these processing fees may limit enrolment, relative to those in the urban locations.
Our study has important implications for policy. The finding that the exemption policies are concentrated on the poor and socioeconomic inequality declined over the survey period in Ghana is some good news. Essentially, this may suggest that despite the inherent challenges that exist in the implementation of the scheme, there are some prospects. The findings also provide a good background to improve effectiveness of the scheme and exemption policies, in particular. For instance, with regard to targeting, the results suggest that there may be a need to revise the designs to target rural and urban dwellers separately. Exemption for indigents and maternal services seem to be more important for rural dwellers compared to the other categories. Given the low-income levels in these regions, ensuring effective implementation of these categories for this group of people will be appropriate. Moreover, the lack of significance in the other categories may also be explained by low uptake by the target groups. For very deprived households, paying processing fee for enrolment may be a major limitation. A policy option may therefore be to remove processing fees for such people to have automatic and free enrolment. Implementing a universal exemption policy may be less effective. It is important to note that, healthcare access and utilization in rural areas are already low, compared with that in the urban locations. Therefore, even minimal changes to the constraints to access and utilization could have a significant impact.
Even though interesting and policy-relevant results have emanated from the article, our study is not without limitations. First is an issue to do with the interpretation of the results. It is important to remember that the approaches used in this article do not address an issue of endogeneity. Therefore, the results from the analysis should be considered to be associations as opposed to being causal. Second, our measure of rankings, namely expenditure, may suffer from recall problems, as is the case with most expenditure-related variables, hence the need to try to undertake a similar analysis using other measures of ranking. Lastly, it would be good to further disaggregate our analysis to capture the socioeconomic nuances within urban locations. There may be significant inequality in exemptions within urban locations with growing slum and vulnerable populations.
Conclusion
The study set out to assess the nature of socioeconomic inequality in the exemption policies of Ghana’s NHIS. Using two rounds of the GLSS (GLSS 6 and 7), we constructed CCs and CIs. We also disaggregated the results across rural and urban locations of individuals. Our results show that all categories of the exemption policies were concentrated among the poor and that the magnitude of inequality was heterogenous across the rural and urban divide. Furthermore, there was a decline in the magnitude of inequality over time. The findings suggest that a universal implementation of the policies may limit effectiveness across rural–urban locations. It may require revisions in the design of the policies to make it more attractive to the different individuals living in these locations.
Data availability statement
The data used in this study is available at https://www.statsghana.gov.gh/gssdatadownloadspage.php
Funding
This study did not receive any funding.
Acknowledgements
We are grateful to the GSS for granting free access to the data used for this study.
Ethical approval
Ethical approval for this type of study is not required by our institute.
Conflict of interest statement
The authors declare that they have no conflict of interest.
Endnotes
SDG 3.8: Achieve UHC, including financial risk protection, access to quality essential healthcare services and access to safe, effective, quality and affordable essential medicines and vaccines for all. https://sustainabledevelopment.un.org/sdg3.
