


Abstract
Grandparent–adult grandchild relationships are becoming longer and more common, and therefore potentially more influential in the lives of individuals. This study examined the influence of solidarity (i.e., affinity, contact, and functional exchange) in the grandparent–adult grandchild relationship upon the depressive symptoms of both members of the dyad.
The study used data from the Longitudinal Study of Generations, a survey of 3- and 4-generation U.S. families that included 7 waves of data collection between 1985 and 2004. The sample was comprised of 374 grandparents and 356 adult grandchildren. We analyzed the data using multilevel growth curve models.
For both grandparents and adult grandchildren, greater affinity reduced depressive symptoms and more frequent contact increased symptoms. For grandparents only, receiving functional support without also providing it increased depressive symptoms.
The average grandparent–adult grandchild relationship is a source of both support and strain to both generations. These relationships exhibit great diversity, however, with large amounts of variation between dyads and within a single dyad over time. We suggest how policy makers and practitioners can identify the relational contexts that best promote the well-being of members of both generations.
Lengthening life expectancy means that generations coexist for longer periods of time than in the past, such that intergenerational relationships, including those between grandparents and adult grandchild, have become increasingly important sources of socialization, support, and strain ( Bengtson, 2001 ). Relationships between grandparents and adult grandchildren have been a demographic reality for decades: As early as 1980, 15% of 40-year-olds had at least one living grandparent ( Uhlenberg, 1996 ). Consistent with intergenerational solidarity theory on the importance of family ties, both grandparents and adult grandchildren report their relationships as emotionally close and meaningful ( Bengtson & Roberts, 1991 ; Kemp, 2005 ).
Yet, relatively little research has examined the mutual influences of these relationships, including consequences for health and well-being, across the life course. Hagestad’s (1985 , p. 36) observation remains largely true: Few people “think of 40-year-old grandchildren.” Thus, we investigate the contexts in which grandparent–adult grandchild relationships reduce and increase depressive symptoms on both sides of the dyad across a period of 19 years, following adult grandchildren into midlife.
We use the intergenerational solidarity model ( Bengtson & Roberts, 1991 ) as our theoretical basis, making links between levels of affinity, contact, and exchange in the grandparent–adult grandchild relationship and trajectories of depressive symptoms. We test our hypotheses using growth curve models in longitudinal data drawn between 1985 and 2004 from more than 200 American families with 3 to 4 living generations. We examine within- and between-family variability in the nature of the grandparent–adult grandchild relationship, with the goal of identifying the relational contexts that best promote the well-being of members of both generations.
Intergenerational Relationships and Depressive Symptoms Over the Life Course
Depressive symptoms, such as sad emotions and negative cognitions, are common threats to psychological well-being across the life course. Research suggests that for the average person, depressive symptoms follow a U-shaped trajectory, with the most symptoms in youth and old age, and the fewest symptoms around age 45 ( Mirowsky & Ross, 1992 ). This general trajectory varies both within and between persons, and factors such as the presence and quality of social relationships influence that variation ( Yang, 2007 ).
Little research has examined the specific influence of grandparents and adult grandchildren upon one another’s trajectories of depressive symptoms. However, research on parents and adult children indicates that intergenerational relationships are potent influences upon depressive symptoms longitudinally and for both members of the dyad. For example, parents who provide functional support to their adult children experience fewer depressive symptoms over time than parents who do not provide help to their adult children ( Byers, Levy, Allore, Bruce, & Kasl, 2008 ). Frequent receipt of multiple types of parental support (e.g., emotional, functional) is good for the psychological well-being of adult children, but the parents of adult children who are too “needy” or who have problems (e.g., marital problems) see declines in their well-being ( Fingerman et al., 2012 ). Therefore, we explore whether grandparents and adult grandchildren also influence one another’s depressive symptoms over time.
The Mutual Effects of Solidarity in the Grandparent—Adult Grandchild Relationship
The intergenerational solidarity model leads us to expect similarities between parent–adult child relationships and grandparent–adult grandchild relationships. This model describes the structure and function of intergenerational family relationships. The model has three interdependent conceptual dimensions—affinity, opportunity structure, and functional exchange ( Silverstein, Bengtson, & Lawton, 1997 ). Affinity concerns “emotional closeness and consensus of opinions”; opportunity structure comprises “the necessary conditions for exchange behavior” such as regularity of contact; and functional exchange is “providing and receiving assistance” ( Silverstein et al., 1997 , p. 440). Together, affinity, opportunity structure, and functional exchange represent the potential of the family to support and sustain its members. The model holds that although social forces such as increased geographical mobility and rapid economic change act to separate the intergenerational family, affinity, opportunity structure, and functional exchange represent ways in which most modern families remain cohesive and integrated.
Affinity
Grandparent–adult grandchild affinity changes over the life course, declining on average in grandchildren’s young adulthood and then rebounding later ( Silverstein & Long, 1998 ). Many grandparents and adult grandchildren report that their relationships are friendships based on unconditional love ( Kemp, 2005 ). There is, however, a great deal of diversity both within and between families. Factors including gender of grandparent and grandchild, relations with the middle generation, childhood experiences with the grandparent, and ethnic and cultural influences are all associated with the degree of affinity within a grandparent–adult grandchild dyad (e.g., Geurts, van Tilburg, & Poortman, 2012 ; Monserud, 2008 ).
Much less is known about the consequences of affinity in grandparent–adult grandchild ties, especially for grandparents. Among older adults, feeling successful and competent as a grandparent—of a grandchild of any age—is associated with fewer depressive symptoms ( Reitzes & Mutran, 2004 ). Among adolescents and young adults, affinity with a grandparent is associated with fewer depressive symptoms, especially when the grandchild comes from a single-parent or stepfamily home ( Attar-Schwartz, Tan, Buchanan, Flouri, & Griggs, 2009 ; Ruiz & Silverstein, 2007 ). Additionally, affinity with a grandparent buffers against depressive symptoms in adolescents and young adults whose mothers (i.e., the middle generation) experience depression ( Silverstein & Ruiz, 2006 ).
There has been little investigation of whether a lack of affinity harms the well-being of either generation, although low-affinity relationships may be common: In a sample of grandparents from rural Iowa, 60% of grandparents reported that their relationships with their adolescent grandchildren lacked affinity ( Mueller, Wilhelm, & Elder, 2002 ). Therefore, we anticipate that higher affinity in the grandparent–adult grandchild relationship will reduce depressive symptoms for both generations.
Opportunity Structure (Contact)
In contrast to affinity, contact between grandparents and adult grandchildren is at its highest early in grandchildren’s adulthood and declines thereafter ( Silverstein & Long, 1998 ). At least some of this decrease is due to grandchildren moving out of the parental home because the parental home is a context that facilitates contact with grandparents ( Geurts, Poortman, van Tilburg, & Dykstra, 2009 ). Marital changes within the family also account for some changes in grandparent–adult grandchild contact, although effects are mixed. For minor grandchildren, middle-generation divorce can cutoff grandparent–grandchild contact, but once grandchildren are adults, middle-generation divorce has no effect on grandparent–grandchild contact ( Cooney & Smith, 1996 ). Grandchildren’s own marriages and divorces lead to reduced contact with grandparents in some contexts ( Monserud, 2011 ).
The consequences of contact are unclear from the literature to date. Grandparents and adult grandchildren usually describe their interactions as welcome and meaningful ( Kemp, 2005 ). Nonetheless, decreases in contact typically have no effect upon the quality of the relationship, which suggests that contact may have little influence on well-being ( Taylor, Robila, & Lee, 2005 ). In coresidential contexts, contact can actively lower well-being because it results in conflict, disagreement, and invasion of privacy ( Lowenstein, 2002 ). Therefore, we hypothesize contact will influence depressive symptoms for both generations; however, we do not specify the direction of influence.
Functional Exchange
Functional support, especially financial support, tends to flow primarily downward from grandparents to adult grandchildren ( Hoff, 2007 ). The major exception is when adult grandchildren provide elder care to their grandparents, an experience they may find both rewarding and stressful ( Fruhauf, Jarrott, & Allen, 2006 ). The most common form of support appears to be advice and information ( Kemp, 2005 ).
Research indicates that receiving functional support from younger generations—particularly if the older adult is unable to reciprocate—is associated with increased depressive symptoms ( Ramos & Wilmoth, 2003 ; Zunzunegui, Beland, & Otero, 2001 ). This negative effect is due in part to fears of burdening the younger generation, and in part to the desire for continued autonomy and independence. Similarly, younger adults who receive functional support from family experience more frequent depressive symptoms ( Johnson, 2013 ). On the other side of the equation, providing support generally benefits well-being because it fosters a sense that one is needed ( Fiori & Denckla, 2012 ). Yet in some contexts, the strain—on health, on other roles, etc.—of providing support results in more frequent depressive symptoms ( Bangerter, Kim, Zarit, Birditt, & Fingerman, 2014 ). Therefore, we expect that patterns of functional exchange will influence depressive symptoms for both generations, and we anticipate that those who receive support without also providing it will experience higher levels of depressive symptoms than those with other patterns of exchange.
Additional Considerations
Our statistical models adjust for familism, the extent to which a person is family-oriented, to account for the possibility that a strong relationship between grandparent and adult grandchild is simply reflective of strong family relationships more generally. They also adjust for grandparents’ health status, both because poor or declining health might elicit contact and functional support from grandchildren and because depressive symptoms are strongly related to other health concerns ( Moussavi et al., 2007 ). We further adjust for the gender of both members of the dyad, given that on average, women experience both higher levels of solidarity in grandparent–adult grandchild relationships and more frequent depressive symptoms ( Silverstein & Long, 1998 ). Finally, we adjust for the age of the other member of the dyad, so as to consider the potential for cohort differences in the grandparent–adult grandchild relationship.
Methods
Data
The data were drawn from the Longitudinal Study of Generations (LSOG). The study began with a sample of 328 three-generation families selected by multistage stratified random sampling from the 840,000 persons enrolled in a southern California health maintenance organization. The initial response rate was 65% of persons contacted ( Silverstein, Giarrusso, & Bengtson, 2003 ). The LSOG sample represents white, economically stable middle- and working-class families. In the first wave in 1971, 516 grandparents (G1s), 701 parents (G2s), and 827 grandchildren aged 16 and older (G3s) participated. There have been seven subsequent waves, in 1985, 1988, 1991, 1994, 1997, 2000, and 2004. The response rate in 1985 was 67%, and response rates averaged 85% from 1988 onwards ( Silverstein et al., 2003 ). Additionally, new participants were added as family members reached the age of 16 and as family members married. Waves beginning in 1991 also included the great-grandchildren (G4s) of the original G1s.
Study investigators selected the grandparent–adult grandchild relationship that participants reported upon. G1s and G2s were assigned a single focal “study grandchild” from within the family to report upon across waves. G3s and G4s were assigned a set of “study grandparents” to report upon across waves. These assignments were dyadic; if Grandmother A’s “study grandchild” was Grandchild Z, then Grandchild Z’s “study grandmother” was Grandmother A.
This study uses data from subsamples of grandparents and grandchildren aged 18 and older who reported on the other member of the dyad in at least one of waves 2 through 8 of the LSOG. Our statistical method retains all participants, regardless of the number of waves they completed. Participants who responded to all waves have the greatest influence upon results, but even participants who responded to a single wave contribute meaningful information ( Hox, 2010 ). Table 1 indicates how many participants completed one wave, two waves, and so on. The average grandparent completed 2.86 waves, and the average adult grandchild completed 2.57 waves. Participants who completed fewer than seven waves did so for a variety of reasons. These included refusal, grandparent death, poor health, and institutionalization; additionally, we excluded waves at which grandchildren were minors. We excluded baseline data because the 1971 survey did not include all of our measures of interest. Thus, our grandparent subsample is comprised of 1,071 observations within 374 grandparents within 203 families across the period 1985–2004. Our adult grandchild subsample is comprised of 914 observations within 356 grandchildren within 196 families across the same period.
Number of Waves Completed
| Grandparents | Adult grandchildren | |||
|---|---|---|---|---|
| n | % | n | % | |
| Seven waves | 126 | 11.76 | 77 | 8.42 |
| Six waves | 72 | 6.72 | 96 | 10.50 |
| Five waves | 125 | 11.67 | 100 | 10.94 |
| Four waves | 228 | 21.29 | 116 | 12.69 |
| Three waves | 285 | 26.61 | 222 | 24.29 |
| Two waves | 136 | 12.70 | 194 | 21.23 |
| One wave | 99 | 9.24 | 109 | 11.93 |
Notes : The average grandparent completed 2.86 waves, and the average adult grandchild completed 2.57 waves.
Dependent Measure
Both grandparents’ and adult grandchildren’s depressive symptoms were measured at each wave using the complete 20-item Center for Epidemiological Studies-Depression scale ( Radloff, 1977 ). The response scale included 1 ( rarely or none of the time ), 2 ( a little of the time ), 3 ( a moderate amount of the time ), and 4 ( most or all of the time ). Items were averaged provided that the participant answered at least half the items. Those who answered fewer than half of the items were coded as missing. (Scores based on a small number of responses are unreliable). Our results were robust to alternative strategies of handling missing items within the scale. In 6.4% of grandparent observations and 3.9% of grandchild observations, the participant answered fewer than half of the items.) Scores were skewed, as many people reported no depressive symptoms. Therefore, we took the natural log of scores and then standardized the measure (average α = .84 for grandparents and .91 for adult grandchildren).
Independent Measures: Time Varying
Age
Age was represented by a linear term and a squared term corresponding to each of the seven waves of measurement. The average grandparent was born in 1916, and the average grandchild in 1962, making them 78 and 32 years old, respectively, at the midpoint of the study in 1994. There was variation, however, with grandparents’ birth years ranging from 1886 to 1944, and grandchildren’s birth years ranging from 1945 to 1986.
Affinity
Grandparents and adult grandchildren each reported the degree of affinity in their relationship at each wave. The scale included six items (e.g., “Overall, how well do you get along with your [adult grandchild/grandparent] at this point in your life?”). Response options included 1 ( not at all well ), 2 ( not too well ), 3 ( somewhat well ), 4 ( pretty well ), 5 ( very well ), and 6 ( extremely well ). Items were averaged provided that the participant answered at least half the items (average α = .89 for grandparents and .91 for adult grandchildren). Those who answered fewer than half of the items were coded as missing. (Our results were robust to alternative strategies of handling missing items within the scale. In 6.3% of grandparent observations and 6.9% of grandchild observations, the participant answered fewer than half of the items.)
Contact
In each wave, grandparents and adult grandchildren reported their level of contact with one another in person, by phone, and by mail. Responses were coded from 1 ( not at all ) to 6 ( daily ). For each respondent, we used the largest value from among the three items.
Functional Exchange
In each wave, grandparents and adult grandchildren reported whether they provided and/or received help with: household chores, information and advice, financial assistance, and discussing important life decisions. Participants then reported whom they helped and who gave them help. Grandparents and adult grandchildren reported low rates of functional exchange within their dyads, such that we generated four exhaustive and mutually exclusive dichotomous measures: reported neither giving any of the four types of help to the adult grandchild/grandparent nor receiving any of the four types of help from the adult grandchild/grandparent (reference); reported both giving and receiving help; reported giving but not receiving help; and reported receiving but not giving help.
Familism
Grandparents and adult grandchildren each reported on their familism at each wave. The scale, developed by Heller (1970) , included two items in 1985 and five items in subsequent waves. (e.g., “Family members should give more weight to each other’s opinions than to the opinions of outsiders.”) Response options ranged 1 ( strongly disagree ) to 4 ( strongly agree ). Items were averaged (average α = .54 for grandparents and .53 for adult grandchildren).
Grandparent Health
At each wave, grandparents rated their overall health on a scale from 1 ( excellent ) to 4 ( poor ). For both grandparent and adult grandchild analyses, the grandparents’ self-reports of health were used.
Independent Measures: Time-Invariant
Time-invariant measures for both members of the dyad included gender and birth year.
Analytic Plan
Missing Data
In this longitudinal sample, missing data may be described at the level of the wave and at the level of the observation. If a participant missed a wave, all data remained missing for that wave. That is, we did not impute those data. Turning to observations, we used multiple imputation by chained equations in the statistical software package Stata 12.0 to handle missing data. We generated five imputed data sets. For grandparents, familism was the variable most likely to be missing. It was not reported in 83 of the 1,071 observations (7.75%). For adult grandchildren, grandparent’s health was the variable most likely to be missing. No grandparent self-report of health was available in 139 of the 914 observations (15.21%). Grandparents provided complete data in 81.89% of observations, and adult grandchildren provided complete data in 65.86% of observations.
The dependent variables were included in the imputation phase as well as in the analyses, as recommended by Johnson and Young (2011) . The regression results presented in this study combine the estimates from the five data sets using Rubin’s (1987) rules. Results from analyses that used list-wise analysis are available upon request. The results were substantively similar regardless of the treatment of missing data.
Statistical Modeling
We used multilevel growth curve models to test how the grandparent–adult grandchild relationship affected depressive symptoms over a period of 19 years. First, we modeled a dyad member’s own depressive symptoms as a function of his or her age and age squared. We included random intercepts, as well as random slopes such that the relationship between age and depression could vary across individuals (Model 1). Age squared did not show significant variation across either grandparents or adult grandchildren, and so in subsequent models its slope was fixed.
Second, we added the time-varying reports of one’s own affinity, contact, and functional exchange, as well as familism and grandparent health, fixing their slopes across persons (Model 2). Finally, we added the time-invariant predictors: gender of grandparent, gender of grandchild, and birth year of the other member of the dyad (i.e., grandparent’s birth year when predicting grandchild’s depression and vice versa; Model 3).
We tested a series of sensitivity analyses that do not appear in this paper. First, we examined models that included both partners’ ratings of solidarity. In these models, one’s own solidarity was the factor related to one’s own depressive symptoms. Second, we tested the interactions of age and age squared with all other variables in the model to see whether any of those measures moderated the rate of change in depression scores over time. No interactions were statistically significant. Third, we tested interactions between the measures of solidarity, but no interactions were statistically significant. Fourth, we ran a series of models controlling for measures of solidarity with the middle generation (i.e., the parents of the adult grandchild, the child of the grandparent). These measures were significantly related to depressive symptoms, but did not alter the effects of the grandparent–adult grandchild tie. Finally, we estimated models that included mean-level (i.e., time-invariant) solidarity scores. Those factors were also not statistically significant and are excluded from our final models.
Results
Descriptive Statistics
Descriptive statistics for all variables used in this study are presented in Table 2 . For the average grandparent or adult grandchild at the average wave, depressive symptoms were infrequent, although the standard deviations ( SD s) and ranges indicated substantial variation both within and between respondents. The grand mean was slightly higher for adult grandchildren than for grandparents ( p < .05). As regards solidarity, grand means for affinity and contact were at or above the midpoint of the scales, with grandparents reporting significantly greater affinity and more frequent contact than adult grandchildren. Adult grandchildren reported more functional support than grandparents did: The average grandparent reported neither giving nor receiving functional support at three quarters of time points, whereas the average adult grandchild reported neither giving nor receiving functional support at two thirds of time points. For further detail regarding average change over time, descriptive statistics for the time-varying measures for each wave are provided in Table 3 .
Descriptive Statistics for All Measures Used in the Analysis Across All Waves
| Grandparents | Adult grandchildren | |
|---|---|---|
| M ( SD ) or % | M ( SD ) or % | |
| Time-varying predictors | ||
| Grand means | ||
| Depressive symptoms a | 1.55 (0.41) | 1.59 (0.48)* |
| Affinity b | 3.96 (1.13) | 3.50 (1.11)*** |
| Contact c | 3.36 (1.28) | 3.28 (1.18) |
| Familism d | 2.94 (0.52) | 2.63 (0.54)*** |
| Grandparent health e | 2.04 (0.79) | 2.04 (0.77) |
| Percentage of time points at which the average respondent reported | ||
| No functional support | 75.44 | 67.84*** |
| Giving functional support | 13.17 | 6.78*** |
| Receiving functional support | 3.73 | 10.28*** |
| Both giving and receiving functional support | 7.66 | 15.10*** |
| Time-invariant predictors | ||
| Female | 65.73 | 62.36 |
| Year of birth | 1916 (11.19) | 1962 (12.34)*** |
Notes : t -tests were conducted to assess differences between grandparents and adult grandchildren. Values are reported prior to multiple imputation.
a Depressive symptoms: 1 ( rarely or none of the time ) to 4 ( most or all of the time ). This measure is reported prior to natural logarithmic transformation and standardization.
b Affinity: 1 ( least ) to 6 ( most ).
c Contact: 1 ( not at all ) to 6 ( daily ).
d Familism: 1 ( least ) to 4 ( most ).
e Grandparent health: 1 ( excellent ) to 4 ( poor ).
* p < .05. *** p < .001.
Descriptive Statistics for Time-Varying Measures by Wave of Data Collection
| 1985 | 1988 | 1991 | 1994 | 1997 | 2000 | 2004 | ||||||||
|---|---|---|---|---|---|---|---|---|---|---|---|---|---|---|
| M or % | SD | M or % | SD | M or % | SD | M or % | SD | M or % | SD | M or % | SD | M or % | SD | |
| Grandparents | ||||||||||||||
| Depressive symptoms a | 1.61 | 0.44 | 1.53 | 0.32 | 1.57 | 0.42 | 1.53 | 0.41 | 1.50 | 0.39 | 1.58 | 0.45 | 1.52 | 0.37 |
| Years of age | 78.3 | 6.11 | 80.3 | 5.32 | 81.1 | 7.03 | 78.9 | 10.04 | 74.4 | 9.43 | 75.1 | 8.32 | 77.4 | 7.64 |
| Affinity b | 3.93 | 1.16 | 3.86 | 1.12 | 3.85 | 1.12 | 3.92 | 1.18 | 4.07 | 1.17 | 4.02 | 1.09 | 4.03 | 1.08 |
| Contact c | 3.63 | 1.42 | 3.38 | 1.27 | 3.16 | 1.16 | 3.29 | 1.19 | 3.34 | 1.31 | 3.35 | 1.26 | 3.24 | 1.20 |
| No functional support | 77.1 | 84.6 | 85.2 | 71.8 | 66.1 | 70.8 | 75.2 | |||||||
| Gives functional support | 9.3 | 7.7 | 6.3 | 16.0 | 20.0 | 17.9 | 13.8 | |||||||
| Receives functional support | 8.7 | 2.1 | 3.1 | 3.1 | 3.0 | 3.0 | 2.0 | |||||||
| Both gives and receives functional support | 4.9 | 5.6 | 5.5 | 9.2 | 10.9 | 8.3 | 9.2 | |||||||
| Familism d | 3.09 | 0.68 | 3.10 | 0.58 | 3.01 | 0.57 | 2.95 | 0.51 | 2.88 | 0.39 | 2.81 | 0.37 | 2.81 | 0.42 |
| Grandparent health e | 2.08 | 0.77 | 2.11 | 0.81 | 2.09 | 0.85 | 2.04 | 0.81 | 1.90 | 0.73 | 2.03 | 0.81 | 2.01 | 0.77 |
| N | 183 | 143 | 128 | 131 | 165 | 168 | 153 | |||||||
| Adult grandchildren | ||||||||||||||
| Depressive symptoms a | 1.54 | 0.48 | 1.56 | 0.48 | 1.57 | 0.52 | 1.58 | 0.49 | 1.68 | 0.47 | 1.62 | 0.47 | 1.60 | 0.44 |
| Years of age | 32.9 | 2.16 | 36.0 | 2.05 | 38.0 | 3.55 | 35.6 | 10.06 | 29.9 | 12.10 | 28.2 | 10.94 | 29.2 | 8.99 |
| Affinity b | 3.44 | 1.17 | 3.43 | 1.06 | 3.44 | 1.12 | 3.48 | 1.14 | 3.49 | 1.12 | 3.56 | 1.10 | 3.62 | 1.10 |
| Contact c | 3.15 | 1.25 | 3.14 | 1.26 | 3.25 | 1.05 | 3.37 | 0.96 | 3.41 | 1.17 | 3.34 | 1.28 | 3.34 | 1.14 |
| No functional support | 75.5 | 78.2 | 69.3 | 70.6 | 60.5 | 57.4 | 64.6 | |||||||
| Gives functional support | 5.0 | 4.5 | 13.9 | 7.8 | 6.7 | 5.2 | 6.9 | |||||||
| Receives functional support | 12.0 | 9.8 | 7.9 | 5.9 | 13.4 | 9.0 | 12.3 | |||||||
| Both gives and receives functional support | 7.6 | 7.5 | 8.9 | 15.7 | 19.4 | 28.4 | 16.2 | |||||||
| Familism d | 2.63 | 0.54 | 2.51 | 0.75 | 2.58 | 0.49 | 2.58 | 0.50 | 2.67 | 0.50 | 2.76 | 0.39 | 2.68 | 0.45 |
| Grandparent health e | 2.08 | 0.77 | 2.10 | 0.78 | 2.18 | 0.87 | 2.04 | 0.77 | 1.94 | 0.73 | 1.98 | 0.76 | 1.99 | 0.72 |
| N | 159 | 133 | 101 | 102 | 134 | 155 | 130 | |||||||
Notes : Values are reported prior to multiple imputation.
a Depressive symptoms: 1 ( rarely or none of the time ) to 4 ( most or all of the time ). This measure is reported prior to natural logarithmic transformation and standardization.
b Affinity: 1 ( least ) to 6 ( most ).
c Contact: 1 ( not at all ) to 6 ( daily ).
d Familism: 1 ( least ) to 4 ( most ).
e Grandparent health: 1 ( excellent ) to 4 ( poor ).
Growth Curve Models
The results of the growth curve models are shown in Tables 4 (grandparents) and 5 (adult grandchildren). For both, the column labeled “Model 1” shows the model including age and age squared. For grandparents, the random component of the age slope was statistically significant, indicating that the rate of change in depressive symptoms differed across grandparents. The fixed slope of age, which describes the average grandparent, was statistically significant ( B = 0.25, p < .001). Coefficients in growth curve models have dual interpretations. First, this finding indicates that cross-sectionally, a grandparent who is X + 1 years old has a depressive symptom score that is 0.25 SD s higher than a different grandparent who is X years old. Second, this finding indicates that longitudinally, as a grandparent ages from age X to age X + 1, his or her depressive symptom score will rise by 0.25 SD s.
Three-Level Growth Curve Models Predicting Grandparents’ Depressive Symptoms Across 19 Years as a Function of Solidarity With an Adult Grandchild ( N = 1,071 Observations From 374 Grandparents Within 203 Families)
| Model grandparent 1 | Model grandparent 2 | Model grandparent 3 | |
|---|---|---|---|
| B ( SE ) | B ( SE ) | B ( SE ) | |
| Intercept | 0.03 (0.05) | −0.02 (0.05) | −0.04 (0.08) |
| Grandparent age | |||
| Linear rate of change a | 0.25*** (0.05) | 0.15** (0.04) | 0.16** (0.05) |
| Quadratic rate of change a | 0.08* (0.04) | 0.10** (0.04) | 0.10** (0.04) |
| Time-varying predictors | |||
| Affinity a,b | −0.12*** (0.03) | −0.12*** (0.03) | |
| Contact a,c | 0.07** (0.03) | 0.07** (0.03) | |
| Gives functional support d | −0.08 (0.08) | −0.08 (0.08) | |
| Receives functional support d | 0.51*** (0.14) | 0.51*** (0.14) | |
| Both gives and receives functional support d | −0.13 (0.10) | −0.13 (0.10) | |
| Familism a,e | 0.08 (0.07) | 0.09 (0.08) | |
| Grandparent health a,f | 0.38*** (0.04) | 0.38*** (0.04) | |
| Time-invariant predictors | |||
| Female adult grandchild | −0.04 (0.08) | ||
| Female grandparent | 0.06 (0.07) | ||
| Adult grandchild year of birth a | 0.00 (0.00) | ||
| Random components | |||
| Family level intercept | 0.28*** (0.08) | 0.19*** (0.09) | 0.19*** (0.09) |
| Grandparent level intercept | 0.56*** (0.06) | 0.44*** (0.06) | 0.44*** (0.06) |
| Grandparent level slope (age) | 0.28*** (0.10) | 0.25*** (0.08) | 0.25*** (0.08) |
| Observation level intercept | 0.71*** (0.03) | 0.69*** (0.03) | 0.69*** (0.03) |
| Autocorrelation (rho) | 0.06 (0.08) | 0.03 (0.08) | 0.03 (0.08) |
| F; df | 16.68; 2 | 19.37; 9 | 15.03; 12 |
a Measure is grand-mean centered.
b Affinity: 1 ( least ) to 6 ( most ).
c Contact: 1 ( not at all ) to 6 ( daily ).
d No functional support is the reference category.
e Familism: 1 ( least ) to 4 ( most ).
f Grandparent health: 1 ( excellent ) to 4 ( poor ).
* p < .05. ** p < .01. *** p < .001.
Three-Level Growth Curve Models Predicting Adult Grandchildren’s Depressive Symptoms Across 19 Years as a Function of Solidarity With a Grandparent ( N = 914 Observations From 356 Adult Grandchildren Within 196 Families)
| Model grandchild 1 | Model grandchild 2 | Model grandchild 3 | |
|---|---|---|---|
| B ( SE ) | B ( SE ) | B ( SE ) | |
| Intercept | −0.10 (0.06) | −0.11 † (0.06) | −0.07 (0.10) |
| Adult grandchild age | |||
| Linear rate of change a | −0.14** (0.04) | −0.14** (0.04) | −0.08 (0.06) |
| Quadratic rate of change a | 0.03 (0.04) | 0.04 (0.04) | 0.01 (0.04) |
| Time-varying predictors | |||
| Affinity a,b | −0.16*** (0.04) | −0.16*** (0.04) | |
| Contact a,c | 0.10** (0.04) | 0.10** (0.04) | |
| Gives functional support d | −0.05 (0.11) | −0.06 (0.11) | |
| Receives functional support d | 0.09 (0.10) | 0.09 (0.10) | |
| Both gives and receives functional support d | 0.02 (0.10) | 0.01 (0.10) | |
| Familism a,e | −0.01 (0.08) | −0.01 (0.08) | |
| Grandparent health a,f | 0.01 (0.04) | 0.02 (0.04) | |
| Time-invariant predictors | |||
| Female adult grandchild | −0.02 (0.09) | ||
| Female grandparent | −0.01 (0.07) | ||
| Grandparent year of birth a | 0.01 (0.01) | ||
| Random components | |||
| Family level intercept | 0.57*** (0.05) | 0.57*** (0.05) | 0.57*** (0.05) |
| Adult grandchild level intercept | 0.31*** (0.09) | 0.28*** (0.08) | 0.28*** (0.09) |
| Adult grandchild level slope (age) | 0.10 (0.47) | 0.00 (0.00) | 0.00 (0.00) |
| Observation level intercept | 0.70*** (0.03) | 0.70*** (0.03) | 0.70*** (0.03) |
| Autocorrelation (rho) | 0.08 (0.07) | 0.10 (0.07) | 0.09 (0.07) |
| F; df | 5.68; 2 | 3.39; 9 | 2.80; 12 |
a Measure is grand-mean centered.
b Affinity: 1 ( least solidarity ) to 6 ( most solidarity ).
c Contact: 1 ( not at all ) to 6 ( daily ).
d No functional support is the reference category.
e Familism: 1 ( least ) to 4 ( most ).
f Grandparent health: 1 ( excellent ) to 4 ( poor ).
†p < .10. ** p < .01. *** p < .001.
For adult grandchildren, the fixed slope of age was statistically significant ( B = −0.14, p < .01), indicating that the average adult grandchild’s depressive symptoms decreased with age. The random component of the age slope was not statistically significant for grandchildren, indicating that the average slope described all adult grandchildren well.
Model 2 added the participant’s own time-varying ratings of solidarity, as well as familism and the grandparent’s time-varying health status. For grandparents, the fixed slope of age remained statistically significant ( B = 0.15, p < .001), and the fixed slope of age squared became statistically significant ( B = 0.10, p < .01). The significant random slope of age showed that rate of change in depressive symptoms continued to vary across grandparents. The time-varying factor that decreased depressive symptoms was greater affinity ( B = −0.12, p < .001). Time-varying factors that increased depressive symptoms included more frequent contact ( B = 0.07, p < .01), receiving functional solidarity without returning it ( B = 0.51, p < .001), and poorer health ( B = 0.38, p < .001). Model 2 is graphed in Figure 1 . For all grandparents, depressive symptoms increased over time, and the rate of increase became faster at older ages (i.e., growth was nonlinear). However, grandparents in relationships characterized by high solidarity (i.e., high affinity, frequent contact, and reciprocal functional exchange) experienced fewer depressive symptoms throughout the 19-year period than did grandparents in relationships characterized by low solidarity (i.e., low affinity, infrequent contact, and lack of functional exchange).
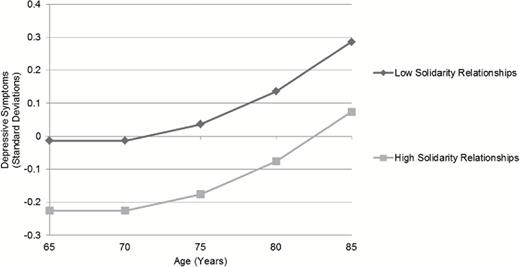
Trajectory of grandparents’ depressive symptoms by level of solidarity in a relationship with an adult grandchild, 1985–2004. Note : High solidarity relationships are defined as those 1 SD above the mean for affinity and contact, with grandparents reporting both giving and receiving functional solidarity. Low solidarity relationships are defined as those 1 SD below the mean for affinity and contact, with grandparents reporting neither giving nor receiving functional solidarity. Familism and grandparent health are set to their grand means.
For adult grandchildren, the fixed slope of age in Model 2 remained stable ( B = −0.14, p < .01). Two time-varying factors influenced depressive symptoms significantly: Greater affinity reduced symptoms ( B = −0.16, p < .001) and greater contact increased symptoms ( B = 0.10, p < .01). Model 2 is graphed in Figure 2 . For all adult grandchildren, depressive symptoms decreased in a linear fashion over time. As with grandparents, adult grandchildren who reported high solidarity in their relationships always experienced fewer depressive symptoms than adult grandchildren who reported low solidarity.
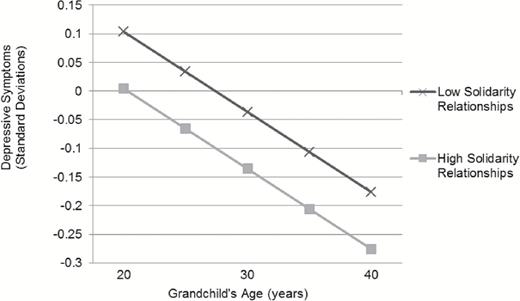
Trajectory of adult grandchildren’s depressive symptoms by level of solidarity in a relationship with a grandparent, 1985–2004. Note : High solidarity relationships are defined as those 1 SD above the mean for affinity and contact, with adult grandchildren reporting both giving and receiving functional solidarity. Low solidarity relationships are defined as those 1 SD below the mean for affinity and contact, with adult grandchildren reporting neither giving nor receiving functional solidarity. All other covariates (i.e., quadratic rate of change, familism, grandparent health) are set to their grand means.
Model 3 added time-invariant measures. For grandparents, the fixed slope of age remained statistically significant ( B = 0.16, p < .01), as did the slope of age squared ( B = 0.10, p < .01) and the random slope of age. The time-varying coefficients maintained their size and statistical significance from Model 2. Adult grandchild gender, grandparent gender, and adult grandchild birth year did not influence depressive symptoms among grandparents.
For adult grandchildren, the fixed slope of age in Model 3 became statistically nonsignificant. This change indicated that adult grandchild gender, grandparent gender, and grandparent year of birth accounted for the average rate of change in depressive symptoms over time, although none of these three factors had a significant direct effect on depressive symptoms. Coefficients for affinity and contact maintained their size and statistical significance from Model 2.
Discussion
This paper examined the influences of affinity, contact, and functional exchange in the grandparent–adult grandchild relationship upon the depressive symptoms of both members of the dyad. The study followed 374 grandparents and 356 adult grandchildren across the period 1985–2004. Their U-shaped life course trajectories of depressive symptoms mirrored those found in prior research (e.g., Mirowsky & Ross, 1992 ). The key findings were that (a) for both grandparents and adult grandchildren, affinity reduced depressive symptoms; (b) for both grandparents and adult grandchildren, frequent contact increased depressive symptoms; and (c) for grandparents only, receiving functional support without also providing it increased depressive symptoms. In the remaining sections, we situate these findings in the context of prior literature, describe the limitations of the study, and provide suggestions for policies and practices that concern grandparents and adult grandchildren.
Affinity
Affinity, or “emotional closeness and consensus of opinions,” ( Silverstein et al., 1997 ), had mutual benefits for grandparents and adult grandchildren. We found that members of dyads reporting high affinity reported fewer depressive symptoms than members of dyads reporting low affinity, and that dyads whose affinity increased over time experienced decreases in depressive symptoms. These results are consistent with those of other studies showing the benefits of affinity with a grandparent for the depressive symptoms of adolescent and young adult grandchildren ( Attar-Schwartz et al., 2009 ; Ruiz & Silverstein, 2007 ; Silverstein & Ruiz, 2006 ). Our study demonstrates that these benefits extend to grandparents as well, at the opposite end of the adult life course. Our results support Bengtson’s (2001) assertion that intergenerational relationships are “a valuable new resource for families in the 21st century.”
Contact
Contact—an aspect of the grandparent–adult grandchild relationship that generates opportunities for support and exchange—made depressive symptoms more frequent for adult grandchildren and grandparents. Prior research indicates that grandparent–adult grandchild contact declines in frequency as adult grandchildren complete normative life events, such as moving out of the parental home and getting married ( Geurts et al., 2009 ; Monserud, 2011 ). Elevated levels of contact may reflect adult grandchildren’s failure to achieve these milestones. Just as adult children’s problems harm the well-being of parents ( Fingerman et al., 2012 ), adult grandchildren’s problems may trouble grandparents. Included in the models, grandparents’ declining health was not a problem that produced depressive symptoms in adult grandchildren, but grandparents might experience other problems—such as widowhood and relocation—that increase both contact and depressive symptoms for adult grandchildren.
Functional Exchange
We found low rates of functional support, or assistance with household chores, money, information, advice, and life decisions. Functional support affected depressive symptoms only on the grandparent side of the dyad. Specifically, the small proportion of grandparents who received such support from an adult grandchild but did not give support in return reported more frequent depressive symptoms than grandparents who reported that there was no support at all in their relationship. Our results are consistent with research indicating that being dependent on someone for assistance is associated with depressive symptoms ( Ramos & Wilmoth, 2003 ; Zunzunegui, Beland, & Otero, 2001 ) and even mortality in later life ( Brown, Nesse, Vinokur, & Smith, 2003 ).
Adult grandchildren were unaffected by support from a grandparent. Our finding that relationship quality, but not exchange of instrumental support, influenced the well-being of the younger generation is consistent with a prior study of parents and adult children in the Netherlands ( Merz, Schuengel, & Schulze, 2009 ). Those authors hypothesize that support from older generations is often unwanted or unneeded, and thus undermines younger adults’ autonomy.
Limitations
This study is limited in several ways. First, these data are growing old, and as they age, they become less representative of modern grandparent–adult grandchild relationships. The most recent wave of data collection occurred in 2004. We rely on the LSOG because, as a data set that covers 19 years and includes multiple reporters per family, it is a unique resource. However, other research on trajectories of depressive symptoms has found substantial cohort effects ( Yang, 2007 ), such that our findings may not hold for more recent cohorts. Moreover, the sample is comprised almost entirely of white persons, such that we were unable to examine the influence of race or ethnicity.
Second, the LSOG lacks direct measures of the extent to which grandparents and adult grandchildren perceive that middle generation members influence their relationship. Multiple studies indicate that the solidarity of the grandparent–grandchild relationship is influenced by both parties’ relationships with the middle generation ( Monserud, 2008 ; Silverstein & Ruiz, 2006 ). Parents serve as “gatekeepers” between grandparents and grandchildren. Nonetheless, our sensitivity analyses indicated that although relations with the middle generation affect depressive symptoms, they do not mediate the effects of the grandparent–adult grandchild relationship on depressive symptoms.
Implications for Policy and Practice
Despite its limitations, this study contributes ideas for policy makers and practitioners whose work concerns grandparents and adult grandchildren. We forward a suggestion and a caveat. First, our findings lend further support to the idea that grandparents and adult grandchildren should be recognized as potential resources for one another ( Bengtson, 2001 ). Policy makers and practitioners are becoming accustomed to thinking about grandparents as “safety nets” for minor grandchildren, as increasing numbers of grandparents raise their grandchildren. We find that in high-affinity relationships, grandparents continue to play a positive role long into grandchildren’s adulthood and adult grandchildren benefit their grandparents similarly.
However, our results also suggest caution. Like other scholars, we find that some aspects of relationships that one might expect to be resources—frequent contact and receipt of support—are not always beneficial for psychological well-being. Practitioners cannot assume that active grandparent–adult grandchild relationships are necessarily resources against depressive symptoms, but instead will need to investigate more qualitative aspects of relationship functioning. There is plenty of reason to be enthusiastic about a future that contains more meaningful relationships between grandparents and their adult grandchildren—and also plenty of reason to continue to study the relationship in all its diversity.
Funding
This work was supported by the Data Training and Users Workshop for the Longitudinal Study of Generations and the Boston College Institute on Aging (ARIG #1851620100000 to S.M.M.).
References
Author notes
Decision Editor: Rachel Pruchno, PhD

