


Abstract
Clinical registry participation is a measure of healthcare quality. Limited knowledge exists on Australian hospitals’ participation in clinical registries and whether this registry data informs quality improvement initiatives.
To identify participation in clinical registries, determine if registry data inform quality improvement initiatives, and identify registry participation enablers and clinicians’ educational needs to improve use of registry data to drive practice change.
A self-administered survey was distributed to staff coordinating registries in seven hospitals in New South Wales, Australia. Eligible registries were international-, national- and state-based clinical, condition-/disease-specific and device/product registries.
Response rate was 70% (97/139). Sixty-two (64%) respondents contributed data to 46 eligible registries. Registry reports were most often received by nurses (61%) and infrequently by hospital executives (8.4%). Less than half used registry data ‘always’ or ‘often’ to influence practice improvement (48%) and care pathways (49%). Protected time for data collection (87%) and benchmarking (79%) were ‘very likely’ or ‘likely’ to promote continued participation. Over half ‘strongly agreed’ or ‘agreed’ that clinical practice improvement training (79%) and evidence–practice gap identification (77%) would optimize use of registry data.
Registry data are generally only visible to local speciality units and not routinely used to inform quality improvement. Centralized on-going registry funding, accessible and transparent integrated information systems combined with data informed improvement science education could be first steps to promote quality data-driven clinical improvement initiatives.
Introduction
Clinical registries are organized systems used across multiple health organizations that collect specific data about patients’ diagnoses and/or care processes using standardized definitions and approaches [1–3]. Registries enable clinicians and managers to assess the extent to which healthcare aligns with evidence-based practice or gaps in practice that need improvement [4]. Capturing reliable data on real-world patient populations means clinical registries have become important platforms for performance measurement and improvement [5].
The benefits of clinical registries are well documented in research. For example, they provide data about variations in quality of care, whether benchmarks are being met and facilitate feedback to clinicians, managers, funders, policymakers and researchers [6]. Using clinical registries to inform data-driven quality improvement initiatives has resulted in increased clinician engagement, promotion of best practice [7] and use of registry data for quality improvement [8]. Clinicians value benchmarked reports and comparisons of local data with other participating hospitals [9]. Patients have acknowledged the benefits of clinical registries where transparent measures ensure data are secure and confidential [10].
Clinical registries are recognized as an important source of high-quality data, with the potential to change clinician behaviour and improve patient outcomes [11]. Evidence for this from the Australian Stroke Clinical Registry data has demonstrated that patients who received stroke unit care and were discharged on antihypertensive agents with a care plan had a 70% reduced risk of death at 180 days [12]. Clinical registries have also been shown to be cost-effective. The Canadian National Surgical Quality Improvement Program have shown an estimated net cost-saving of $8.8 million, and the return on investment was US$3.43 per US$1.00 invested in the program [13]. These economic benefits also coincided with improvements in processes of care and patient outcomes [13].
Despite the recognized benefits of clinical registries, a number of barriers exist. Lack of funding, reluctance of healthcare providers to supply data, poor integration between electronic medical record systems, and limited availability of skills and resources to run registries have all been identified as barriers [4]. Feedback to participating organizations often lags well behind clinical care, making data obsolete and less useful [14]. Many clinical registries have outdated data collection systems and continue to rely on manual data entry that is tedious, expensive and prone to error [14]. Results from a Danish qualitative study evaluating data use from its cardiac rehabilitation registry showed a limited number of staff were using registry data in quality improvement activities [15]. Similarly, a Swedish study also identified significant differences among clinical registries in the use of their data in local quality improvement activities [16]. Registries with higher-quality data and adequate resources for registry-based quality improvement had their data used routinely and more often in local quality improvement [16].
To foster national awareness of registry activity, the Australian Commission on Safety and Quality in Healthcare recently developed the Australian Register of Clinical Registries, currently listing 31 registries [17]. However, there remains limited knowledge of hospital and clinician participation in Australian clinical registries [1, 18]. There is no systematic approach to inform health services on the use and interpretation of registry data [18], and there is evidence of limited capacity to benchmark outcomes and assess the degree to which healthcare aligns with evidence-based practice [4]. Furthermore, reporting of registry data into quality improvement committees beyond the speciality unit level is unsystematic, and use of the data for quality improvement appears limited [19].
The aim of this study was to identify hospital staff participation in clinical registries in four New South Wales Local Health Districts in Australia; to determine if, and how, registry data are used to inform quality improvement initiatives; to identify enablers to promote continued registry participation; and identify educational needs of clinicians to improve use of registry data to drive practice change.
Methods
Study design and setting
A cross-sectional survey using a self-administered questionnaire was undertaken in seven hospitals across four local health districts in Sydney New South Wales, Australia, who collectively in 2021 had a catchment population of ∼2 million [20].
Participant identification and recruitment
As no hospitals reported centralized lists of registries or staff responsible for registry data, hospital registry leads (those responsible for data contribution) were identified using the following strategies: medical department heads, clinical managers, clinical nurse consultants, and senior medical and nursing staff from speciality units were contacted by email, phone or face-to-face to identify the registry lead who was subsequently sent the questionnaire. A list of known clinical registries was compiled. If a clinical registry existed for a speciality area, and no registry lead was identified, the department at each hospital was recontacted by the study investigator to check participation.
Inclusion and exclusion criteria for registries
International-, national- and state-based clinical registries, condition/disease registries and device/product registries were included if they met two of the following three criteria: (i) systematic ongoing data collection, (ii) data collected from more than one hospital and (iii) reports/feedback mechanisms to those who contribute data to registries. Drug registries, clinical trials, research projects, time-limited clinical audits and point prevalence data collections were excluded.
Instrument
A survey was developed in paper-based and electronic forms. The authors reviewed published literature on clinical registries and their impact on quality improvement to inform the survey. The paper-based survey was pre-tested by a panel of clinical registry experts for content, structure and response options. A second pre-test was completed by three hospital registry leads, and minor revisions were made.
A supplementary survey was developed for participants who stated that they contributed data to more than one clinical registry.
Survey distribution and data collection
The survey was administered between November 2019 and March 2020 in paper-based format or electronic format. Paper-based surveys were hand delivered to registry leads, and an electronic version was emailed when requested. Where respondents participated in multiple registries, they were asked to complete a separate survey for each of the registries. Non-responders were followed up by reminder emails 2, 3 and 4 weeks after the initial survey distribution. Data were entered into REDCap™.
Verification of clinical registries post-data collection
Post-data collection, registries named by participants were cross-referenced with the list of clinical registries reported by the Australian Commission on Safety and Quality in Healthcare to ensure they met the study eligibility criteria [17]. Next, an internet search was conducted to see if the registry met the study eligibility criteria according to its website. Where there was no registry website or where we were unable to ascertain eligibility, an email and/or telephone call was made to registry managers to verify their inclusion. Clinical registries that could not be verified using any of these three methods were excluded.
Data analysis
Continuous variables were reported as mean and standard deviation and categorical variables as frequencies and proportions. Survey responses for ‘always’ and ‘often’; ‘very satisfied’ and ‘satisfied’; ‘very likely’ and ‘likely’; ‘very good’ or ‘good’; and ‘strongly agree’ or ‘agree’ were combined. Analyses were performed in IBM SPSS statistics software version 25 [21]. Reporting of this study adhered to the Strengthening the Reporting of Observational Studies in Epidemiology guidelines [22].
Results
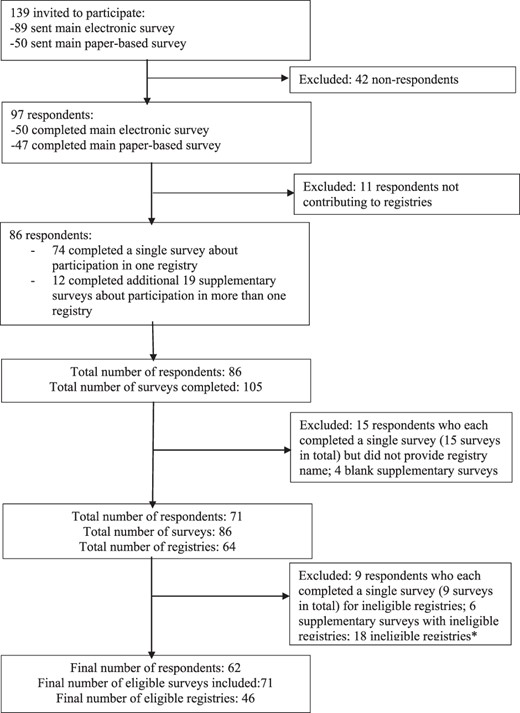
The survey was sent to 139 individuals (50 paper-based and 89 electronic surveys) of whom 97 (70%) responded: paper-based response was 94% (47/50) and electronic response was 56% (50/89). Of the 97 respondents, 86 (89%) contributed data to clinical registries. Overall, 86 respondents completed 105 surveys. Of the 64 registries named, 18 did not meet the criteria for a clinical registry based on our registry validation process and were excluded. Hence, data from 62 respondents who participated in the 46 eligible clinical registries and completed 71 surveys were included in the analysis. Of note, 4 of the 46 eligible registries did not have reports/feedback mechanisms to registry participants. The median number of registries from the four local health districts was 13 (interquartile range 9.5–21.5). Figure 1 describes the flow of survey distribution and completion.
Participant responses.
Respondent’s characteristics
The characteristics of respondents are presented in Table 1. Most respondents were nurses (n = 36, 58%). The clinical specialty of respondents varied widely across both medical and surgical specialties.
Characteristics of respondents
| Characteristic | N = 62 n (%) |
|---|---|
| Job title | |
| Nurse | 36 (58) |
| Medical practitioner | 8 (13) |
| Project/data manager | 7 (11) |
| Researcher | 2 (3) |
| Other (eRIC application specialist; trauma service manager; clinical care coordinator) | 3 (5) |
| Administrative staff | 1 (2) |
| Missing | 5 (8) |
| Hospital setting | |
| Tertiary referral or university teaching hospital | 54 (87) |
| Missing | 8 (13) |
Participation in clinical registries
Just over half the respondents (n = 36, 58%) contributed to one registry, 18 (29%) to two registries, five (8.1%) to three registries and three (4.8%) contributed to four or more registries. The most common registries listed were the Australia and New Zealand Dialysis and Transplant Registry (n = 6, 9.7%) and Australian and New Zealand Intensive Care Society Registry (n = 6, 9.7%) (Supplementary Table S1).
Registry characteristics and data entry processes
The majority of respondents contributed data to national registries (n = 33, 47%) and had done so for over 10 years (Table 2). Registry data were mostly collected by nurses (n = 78, 97%), via retrospective medical record audit. Only 34% (n = 24) entered the data directly into an electronic registry database, while 6% (n = 4) collected the data on a paper-based form before entering into an electronic registry database, and 44% (n = 31) used a combination of electronic and manual data entry methods. The most commonly reported funding sources for registry participation were hospitals (n = 16, 23%) and self-funding by local departments (n = 14, 19.7%).
Registry characteristics and data entry processes
| Characteristics | N = 71 n (%) |
|---|---|
| Type of registry | |
| International | 20 (28) |
| National | 33 (47) |
| State | 16 (23) |
| Do not know | 2 (3) |
| Number of years contributing to registry | |
| Less than 1 year | 6 (9) |
| 1–3 years | 12 (17) |
| 4–6 years | 10 (14) |
| 7–10 years | 5 (7) |
| Greater than 10 years | 31 (44) |
| Do not know | 7 (10) |
| Received formal training on how to use the registry | |
| Yes | 32 (45) |
| No | 39 (55) |
| Person responsible for entering dataa | |
| Clinical staff | |
| Nursing | 78 (97) |
| Medical | 23 (32) |
| Allied Health Professional | 4 (6) |
| Non-clinical staff | 29 (41) |
| Other | 5 (7) |
| How registry data are collecteda | |
| Retrospective medical record audit | 41 (58) |
| Automatically collected from electronic database | 25 (35) |
| Bedside (concurrent/prospective) | 24 (34) |
| Other | 14 (20) |
| Format of registry data collection | |
| Combination of electronic and manual data entry | 31 (44) |
| Electronic only | 24 (34) |
| Manual only | 4 (6) |
| Other | 12 (13) |
| Time spent collecting and entering registry data (per week) | |
| Less than 1 h | 14 (20) |
| 1–2 h | 16 (23) |
| 3–4 h | 8 (11) |
| 5–6 h | 2 (3) |
| 7–8 h | 2 (3) |
| 9–10 h | 2 (3) |
| >12 h | 17 (24) |
| Missing | 10 (14) |
| Funding source for registry participation | |
| Local hospital | 16 (23) |
| Self-funded by local department | 14 (20) |
| Participation is free | 14 (20) |
| Local health district | 6 (9) |
| State government | 4 (6) |
| Federal government | 2 (3) |
| Do not know | 15 (21) |
| Clinical information collected by registrya | |
| Morbidity and mortality rates | 44 (62) |
| Patient-reported outcome measures | 22 (31) |
| Hospital-acquired complications | 19 (27) |
| Readmission rates | 15 (21) |
| None of these are collected | 14 (20) |
| Patient-reported experience measures | 7 (10) |
| Do not know | 3 (4) |
| Other | 8 (11) |
| Data collected from patient’s post-hospital discharge | |
| Yes | 33 (47) |
| No | 38 (54) |
| Person collecting post-hospital discharge dataa | |
| Hospital staff | 19 (27) |
| Registry staff | 8 (11) |
| Do not know | 2 (3) |
| Other | 6 (9) |
| How post-hospital discharge data are collecteda | |
| At a clinic/follow-up appointment | 15 (21) |
| Telephone interview | 14 (20) |
| Face-to-face interview | 5 (7) |
| Survey | 5 (7) |
| Data linkage by external organization | 2 (3) |
| Do not know | 1 (1) |
| Other | 7 (10) |
Percentages may not add up to 100 as respondents could provide multiple responses.
Morbidity and mortality rates were the most frequently collected clinical information (n = 44, 62%), followed by patient-reported outcome measures (n = 22, 31%) and hospital-acquired complications (n = 19, 27%). Only 10% (n = 7) collected patient-reported experience measures.
Production, access and dissemination of registry reports
Overall, 62 (87%) respondents stated reports were produced using registry data (Table 3). Registry reports were most often generated annually (n = 26, 37%), with 55% (n = 39) of respondents satisfied with registry generated reports. Fewer than half stated their registry had the ability to generate live reports available at any time (n = 35, 49%) or provided benchmarked data of their hospital’s results against best practice standards such as clinical guidelines (n = 31, 44%).
Production, access and dissemination of registry reports
| N = 71 n (%) | |
|---|---|
| A report is produced using registry data | |
| Yes | 62 (87) |
| Organization/person responsible for producing the reporta N = 62 | |
| The registry | 36 (51) |
| Person responsible for entering the data locally | 21 (30) |
| Government organization | 8 (11) |
| Another person in local department who is not responsible for entering data | 6 (9) |
| Professional body | 4 (6) |
| Clinical governance or quality unit | 2 (3) |
| Do not know | 3 (4) |
| Other | 4 (6) |
| Frequency of reports generated by hospital department/servicea | |
| More than once a year | 30 (42) |
| Ad-hoc | 22 (31) |
| Annually | 14 (20) |
| Do not know | 8 (11) |
| Frequency of reports generated by registry | |
| More than once a year | 20 (28) |
| Annually | 26 (37) |
| Ad-hoc | 6 (9) |
| Do not know | 16 (23) |
| Satisfaction with registry reportsb | |
| Reports generated by the registry | 39 (55) |
| Reports generated by yourself | 25 (35) |
| Registry has the ability toa | |
| Generate report that summarizes hospital data | 58 (82) |
| Generate report with local data specific to your hospital | 57 (80) |
| Generate report that compares your hospital to others | 46 (65) |
| Generate live reports that can be accessed any time | 35 (49) |
| Generate report that benchmarks your results against best practice standards | 31 (44) |
| Provide access to interactive dashboard | 24 (34) |
| Provide patient-reported outcomes after hospital discharge | 20 (28) |
| Provide risk-adjusted patient outcome data | 19 (27) |
| Who receives registry reports and how oftenc | |
| Clinical | |
| Nursing staff | 43 (61) |
| Medical | 23 (32) |
| Allied Health Staff | 8 (11) |
| Non-clinical | |
| Head of department | 27 (38) |
| Stream/program manager | 14 (20) |
| Local units | |
| Executive | 6 (8) |
| Quality and governance unit | 5 (7) |
| Director clinical governance | 3 (4) |
| Local health districts | |
| Peer group outside organization | 9 (13) |
| Public organization | 6 (8) |
| Executive | 3 (4) |
| Quality unit | 3 (4) |
| How local department/service feedback results from registry data to staffa | |
| 31 (44) | |
| Summarized report of key results | 29 (41) |
| Face-to-face meeting | 25 (35) |
| In-service | 17 (24) |
| Ad-hoc access to online reports/dashboards | 9 (13) |
| Posters displayed in department/hospital | 9 (13) |
| Results not fed back | 9 (13) |
| Newsletter | 2 (3) |
| Do not know | 8 (11) |
| More involvement in registry data use required from these departmentsa | |
| Hospital quality unit | 30 (42) |
| Hospital program/stream manager | 26 (37) |
| Hospital executive | 23 (32) |
| Hospital director clinical governance | 22 (31) |
| Factors promoting continuation or improvement in registry participationd | |
| Resources | |
| Protected time to complete data collection and entry | 62 (87) |
| Funded staff to manage local data entry | 56 (79) |
| Protected time to interpret and act on results | 51 (72) |
| Automated and integrated data capture from different electronic databases | 49 (69) |
| Support from hospital quality managers | 39 (55) |
| Hospital/local health district/state funding to participate in the registry | 38 (54) |
| Support with governance and ethics approval | 35 (49) |
| Governance | |
| Transparency on who has access to the data and its use for a range of purposes | 40 (56) |
| Privacy and confidentiality of data assured | 37 (52) |
| Data analysis and reports | |
| Ability to generate a report useful to clinicians | 56 (79) |
Percentages may not add up to 100 as respondents could provide multiple responses
Respondents who stated ‘very satisfied’ or ‘satisfied’
respondents who stated ‘always’ or ‘often’
respondents who stated ‘very likely’ or ‘likely’.
Registry reports were ‘always’ or ‘often’ received by nurses (n = 43, 61%), department heads (n = 27, 38%) and doctors (n = 23, 32%). Only 8.4% (n = 8) of hospital executive units and 4.2% (n = 3) of local health district executive units received registry reports. Less than a third (n = 20, 28%) reported registry participation as part of their hospital accreditation processes.
Use of registry data to improve clinical practice
Less than half of respondents reported using registry data ‘always’ or ‘often’ to influence/develop the following: local practice (n = 34, 48%), quality improvement initiatives (n = 35, 49%), policies and protocols (n = 35, 49%), guidelines/care pathways (n = 35, 49%) and new models of care (n = 31, 44%). Just over half used registry data to benchmark against evidence-based practice or to identify gaps in clinical practice when compared to recommended guidelines (n = 39, 55%) (Table 4). Registry data were most often used by nurses (n = 57, 80%) for quality improvement projects.
Use of registry data for practice change and research
| N = 71 n (%) | |
|---|---|
| Use of registry data for clinical practiceb | |
| Data are used to track and compare progress over time | 46 (65) |
| Data are used to benchmark against evidence-based policies, procedures and/or guidelines to identify clinical practice gaps | 39 (55) |
| Data are compared to peer hospitals or state national benchmarks | 36 (51) |
| Data are used to develop quality improvement initiatives | 35 (49) |
| Data directly influence clinical practice change in unit | 34 (48) |
| Data collected at the bedside inform clinical care for that patient | 25 (35) |
| How registry data influences clinical practiceb | |
| Used to inform the development of various quality improvement initiatives | 36 (51) |
| Policies, protocols and/or procedures updated or developed | 35 (49) |
| Clinical guidelines or care pathways updated or developed | 35 (49) |
| Changes to or introduction of new models of care | 31 (44) |
| Data from the registry are used for research projects | |
| Yes | 46 (65) |
| No | 9 (13) |
| Do not know | 12 (17) |
| Not applicable | 3 (4) |
| Staff who have used registry data for research projectsa | |
| Medical | 31 (44) |
| Nursing | 24 (34) |
| Allied health | 18 (25) |
| Research fellow | 17 (24) |
| PhD students | 13 (18) |
| Medical students | 13 (18) |
| Statistician/epidemiologist | 11 (16) |
| Research nurse | 10 (14) |
| External researchers | 10 (14) |
| Data manager | 7 (10) |
| Research assistant | 4 (6) |
| Staff who have used registry data for a quality improvement projecta | |
| Nursing | 57 (80) |
| Medical | 44 (62) |
| Allied health | 29 (41) |
| Statistician/epidemiologist/external researchers | 22 (31) |
| Research fellow | 16 (23) |
| Data manager | 15 (21) |
| Research assistant | 9 (13) |
| PhD students | 6 (8) |
| Do not know | 7 (10) |
| Other 4 (5.6) | 4 (6) |
Percentages may not add up to 100 as respondents could provide multiple responses
respondents who stated ‘always’ or ‘often’
Enablers to continued registry participation
Protected time to complete data collection and entry (n = 62, 87%), ability to generate a timely report useful to clinicians (n = 56, 79%), funding for staff to manage data entry (n = 56, 79%) and generate reports useful to clinicians (n = 56, 79%) were ‘very likely’ or ‘likely’ to promote continued registry participation. More involvement in registry data use by hospital executives was requested by almost a third of participants (n = 23, 32%).
Educational needs
Respondents’ ratings of their knowledge and understanding (most often scored at ‘very good’ or ‘good’) were highest for ‘An understanding of what your data is telling you’ (n = 40, 65%) and ‘Audit and feedback’ (n = 40, 65%) and lowest for ‘Implementation Science/Knowledge Translation methods’ (n = 21, 34%) and ‘Performing gap analysis’ (n = 16, 26%). Less than half had attended training in clinical leadership (n = 30, 48%) and clinical practice improvement (n = 27, 44%), with only a few receiving training in implementation science/knowledge translation (n = 5, 8.1%). Over half ‘strongly agreed’ or ‘agreed’ that education on the following topics would be helpful to support clinical practice change on their unit/ward: clinical practice improvement methods (n = 49, 79%), evidence–practice gap identification and gap analysis (n = 48, 77%), data interpretation (n = 47, 76%), and quality improvement science and methods (n = 45, 73%) (Supplementary Table S2).
Discussion
Statement of principal findings
This study is the most recent evaluation of clinical registry participation in Australian hospitals. We found that clinical data are being collected by hospital staff across various clinical specialities in our sample of hospitals. However, much of these data remain unseen and unused beyond local speciality units. The data are underutilized to help improve clinical practice and drive quality improvement initiatives.
Interpretation within contexts of wider literature
We identified high participation in registries across a variety of clinical specialities; however, visibility of registry data was poor with <10% of hospital executives and quality units receiving registry reports. Similarly, a previous study of clinical registries in Australia conducted in 2016 found a lack of systemic reporting of registry data into quality committees beyond speciality unit level [19], with similarly little evidence clinical registry information is regularly available to health boards or executives [9]. This limited visibility means clinical registries are rarely incorporated within clinical governance frameworks and often poorly understood by healthcare policymakers [9, 23].
Despite the large amounts of registry data available, we found only half of respondents reported using registry data for quality improvement. Authors of recent studies from England and Denmark have also found limited use of registry data for continuous quality improvement [15, 24]. There is currently no systematic approach to the way registry data are used and interpreted in hospitals [18]. We suggest if clinical registries are to be meaningful tools for continuous quality improvement, they must be integrated into clinical practice through engagement with local quality and governance units. Hospitals should consider establishing registry interest groups comprising of clinicians, health managers and policymakers to oversee optimal use of registry data for quality improvement and for deployment of resources to ensure continued registry participation.
Registry data were primarily collected via retrospective medical audits by nurses and entered into an electronic registry database; few collected data through existing hospital integrated electronic medical record systems. This lack of integrated electronic systems for data collection is widely reported as a limitation of clinical registries [25]. The inability to directly feed routinely collected hospital data into data registries can make data collection challenging and time-consuming for clinicians. Paper-based data collection is described as tedious, expensive [23] and prone to error compared to data extracted from patient management systems [26]. Despite the initial cost, money spent on establishing information technology systems is recouped through savings in data entry time [27]. Importantly, integrated electronic data collection systems within and across state and national health organizations are needed. They also provide an opportunity to shift resources from obtaining data to data-led quality improvement. Demonstrating to executives the value of sharing routinely collected electronic non-identifiable patient data with registries may help promote cross-institutional data sharing.
The most frequently collected clinical information was morbidity and mortality rates, while <10% collected data on patient-reported experience measures, despite their potential to improve patient perception of registries [14]. Many registries have limited patient involvement in their design, oversight and operations [28]. In contrast, some international healthcare organizations require patient experience measures as part of their reporting, and funding is contingent on achieving improvements in these patient-reported experiences [29]. The Australian Commission on Safety and Quality in Healthcare Clinical Standards now requires organizations to partner with consumers in planning, design, delivery, measurement and evaluation services [30]. We are optimistic that this might be the catalyst for registries to include patient-reported experience measures in future registry design.
Registries were mostly funded by local hospitals or self-funded by departments. Only a minority were funded by state or federal governments. Adequate funding is a problem registries share with many other healthcare initiatives [4]. In the European Union, unstable funding has been identified as the most important issue limiting the sustainability of clinical registries [31]. Despite this, an economic evaluation of five Australian clinical quality registries estimated a minimum expected cost to benefit ratio of 4:1 would be realized if national coverage was achieved by these registries [32]. A mix of public and private funding of clinical registries may be a solution with federal governments supporting this through a legislative and regulatory framework [33].
Our findings provide new evidence on the educational needs of clinicians to improve use of registry data to drive practice change. Less than half of respondents rated their own, or their teams’, knowledge and understanding of clinical practice quality improvement ‘very good’ or ‘good’. Hence, it was not surprising that a majority stated education on clinical practice improvement methods, evidence–practice gap identification and analysis, data interpretation and audit and feedback would be helpful in changing clinical practice at a local level. Our results suggest that focusing on enhancing clinician knowledge in quality improvement science may potentially progress use of registry data for quality improvement initiatives and clinical practice change. This may be achieved through hospital quality units organizing in-service education or training sessions for all clinicians as part of professional development activities. To create a culture of quality improvement, access to quality improvement training, coaching, mentoring, interprofessional learning, networking and protected time is critical [34]. Hospital managers and executives also have a role to play by modelling best practice quality improvement approaches and creating an open culture that focuses on learning, ownership and accountability [34].
Limitations and strengths
Our study had some limitations. Given the lack of a centralized list of clinical registries from hospitals, there were challenges identifying registry leads, and therefore, some registries may have been missed. Self-reporting created the potential for bias. There was also the potential for selection bias as non-responders (30%) may have differed from responders (70%). A broad definition of clinical registries was used. We included four registries that did not provide reports or feedback to registry participants, and the study was not limited to clinical quality registries. Therefore, we were unable to determine if the results differed between clinical registries (databases that systematically collect health-related information) [35] and clinical quality registries that specifically monitor the quality (appropriateness and effectiveness) of healthcare [2]. This is a potential area for future research. Support for registries and integration of registry data into hospital systems varies across jurisdictions, and our results may not be generalizable.
The strengths of our study include participation of clinicians from seven hospitals across four local health districts who contribute data to a wide range of clinical registries, thereby supporting the generalizability of our findings. Our relatively high response rate of 70% indicates the validity of our study [36]. We anticipated there could be uncertainty among clinicians around what constitutes a clinical registry, so included an a priori validation process to verify the data. Verification of the registries proved more difficult than anticipated, given the lack of a national list of clinical registries in Australia. The recently developed national register of clinical registries is very encouraging. This serves as a critical step in raising the profile and impact of clinical registries by providing clinicians and patients with a detailed list of Australian clinical registries that satisfy minimum security, technical and operating standards [2].
Implications for policy, practice and research
The National Safety and Quality Health Service Standard 1.28 requires hospitals to have systems to monitor clinical variation and support clinicians to undertake clinical practice review, with the aim of informing improvements in safety and quality [30]. However, adherence to generic national standards requires effective implementation; reporting of specialty-specific processes and outcomes also should be required. Based on our study findings, a list of recommendations for improving the use of clinical registries to support quality improvement activities is provided in Table 5. Registry data are built on variables driven from best evidence within each specialty and are usually based on minimum data sets. This is an invaluable and currently under-utilized asset immediately available to hospital executives and clinical governance teams to drive evidence translation into clinical care and to support accreditation. Supporting hospital participation in clinical quality registries is an important step on this path.
Recommendations for improving the use of clinical registries to support quality improvement activities
| S/N | Findings | Recommendations |
|---|---|---|
| 1 | Underutilization of registry data to help improve clinical practice and drive quality improvement initiatives. | Incorporate systemic reporting of registry data into clinical practice through engagement with hospital quality improvement committees and clinical governance units. |
| 2 | Lack of integrated electronic medical record (ieMR) systems for data collection. | Demonstrate to hospital executives the value of ieMR systems within and across state and national health organizations to shift resources from obtaining data to data-led quality improvement. |
| 3 | Limited collection of data on patient-reported experience measures, despite their potential to improve patient perception of registries [23]. | Adherence to the Australian Commission on Safety and Quality in Healthcare Clinical Standards, which requires organizations to partner with consumers in planning, design, delivery, measurement and evaluation services [26]. This might be the catalyst for registries to include patient-reported experience measures in future registry design. |
| 4 | Inadequate funding of registries by state or federal governments. | A mix of ongoing public and private funding of clinical registries may be a solution with federal governments supporting this through a legislative and regulatory framework [29]. |
| 5 | Lack of clinician education in data-informed quality improvement science | Access to quality improvement training, coaching, mentoring, interprofessional learning, networking and protected time through hospital quality units is critical in maximizing the value of registry participation [30]. Hospital managers and executives should model best practice quality improvement approaches and create an open culture that focuses on learning, ownership and accountability [30]. |
| 6 | Addressing barriers to continued registry participation | Hospitals should consider establishing registry interest groups comprising of clinicians, health managers and policy makers to oversee optimal use of registry data for quality improvement and for deployment of resources to ensure continued registry participation. |
Conclusion
Clinicians from multiple specialties are contributing data to clinical registries. However, most registry data remain invisible and unused outside of clinical specialties. A lack of centralized on-going registry funding coupled with often poorly integrated information systems limits the ability of healthcare providers to implement practice change using registry data and represents wasted effort and wasted data. The use of registry data needs to be embedded, accessible and transparent within hospital systems. Education in data-informed quality improvement science is urgently needed to maximize the value of registry participation. Participation in clinical registries is beneficial as registry data can be used to drive, support and evaluate practice improvement.
Supplementary material
Supplementary material is available at International Journal for Quality in Health Care online.
Acknowledgements
The authors would like to thank the research assistants across the local health districts for survey distribution: Dr Helen Goldsmith, Kathryne Hobon, Heidi Lord and Victoria Ramsden. The authors would also like to acknowledge the clinicians from the participating hospitals for their time in completing the survey and contributing data for the study. McNeil JJ is recipient of a National Health and Medical Research Council (NHMRC) Leadership Fellowship - IG 1173690.
Funding
This work was supported by a Maridulu Budyari Gumal, Sydney Partnership for Health, Education, Research and Enterprise nursing internship placement at the Nursing Research Institute, St Vincent’s Hospital, Sydney.
Conflict of interest.
The authors declare no conflict of interests.
Contributorship
S.M. and J.G. designed the study. O.F. analysed the data. J.G. and O.F. drafted the manuscript. S.M., J.G., O.F., C.L., E.Mc., C.F., J.Mc., D.C., B.E., R.F., M.F., H.G., L.H., D.J., J.M., E.M. and L.P. made substantial contributions to the manuscript. All authors critically revised the intellectual content of the manuscript. All authors read and approved the final manuscript.
Ethics
Ethical approval was obtained from the St Vincent’s Hospital Human Research Ethics Committee (ethics approval number 2019/ETH11873).
Data availability statement
The data underlying this article will be shared on reasonable request to the corresponding author.
References
Author notes
JULIE GAWTHORNE,OYEBOLA FASUGBA Co lead authors.
