


Abstract
globally, falls and fall-related injuries are the leading cause of injury-related morbidity and mortality in older people. In our ageing society healthcare costs are increasing, therefore programmes that reduce falls and are considered value for money are needed.
to complete an economic evaluation of an e-Health balance exercise programme that reduced falls and injurious falls in community-dwelling older people compared to usual care from a health and community-care funder perspective.
a within-trial economic evaluation of an assessor-blinded randomised controlled trial with 2 years of follow-up.
StandingTall was delivered via tablet-computer at home to older community-dwelling people in Sydney, Australia.
five hundred and three individuals aged 70+ years who were independent in activities of daily living, without cognitive impairment, progressive neurological disease or any other unstable or acute medical condition precluding exercise.
cost-effectiveness was measured as the incremental cost per fall and per injurious fall prevented. Cost-utility was measured as the incremental cost per quality-adjusted life year (QALY) gained.
the total average cost per patient for programme delivery and care resource cost was $8,321 (standard deviation [SD] 18,958) for intervention participants and $6,829 (SD 15,019) for control participants. The incremental cost per fall prevented was $4,785 and per injurious fall prevented was $6,585. The incremental cost per QALY gained was $58,039 (EQ5D-5L) and $110,698 (AQoL-6D).
this evaluation found that StandingTall has the potential to be cost-effective in specific subpopulations of older people, but not necessarily the whole older population.
ACTRN12615000138583.
Key Points
This is the first economic evaluation of a technology-driven home-based balance exercise programme designed to reduce falls in older people living in the community.
e-Health programmes provide an alternative way for people to access healthcare services, overcome barriers to uptake and regular participation in a fall prevention programme, as well as offer health professionals the means to facilitate strength and balance exercises in the home.
This evaluation found that StandingTall has the potential to be cost-effective in specific subpopulations of older people, but not necessarily the whole older population.
Introduction
Falls can adversely affect health, functioning and independence [1, 2]. Globally, falls and fall-related injuries are the leading cause of injury-related morbidity and mortality in older people [3]. In Australia, more than one in three community-dwelling people aged ≥65 years fall each year, with ~125,021 of these falls requiring hospitalisation [4]. In 2016–17, the average length of hospital stay to treat a fall-related injury was 10 days, equating to over one million patient days and over $498 million in healthcare costs [4, 5]. As the population ages, it is estimated that the direct healthcare cost of fall-related injuries in Australia will triple to $1,375 million per year by 2051 [5].
Strong, high-quality evidence has found falls in community-dwelling older people can be reduced by well-designed exercise programmes aimed at challenging balance [6]. Systematic review evidence suggests exercise-based fall prevention programmes offer the best value for money compared to other fall prevention strategies [7–9]. However, only eight studies have evaluated the cost-effectiveness of exercise-based fall prevention programmes, with evidence for dosage suggesting the recommended exercise dose of twice per week for 90-min per session is not cost-effective in the current delivery format [7–9]. To the best of our knowledge, there are no published economic evaluations of trials using e-Health technology to deliver a fall prevention programme. Considering the increasing number of older people who experience falls and finite health resources, it is imperative to identify cost-effective programmes that improve adherence to exercise and can be scaled to reach large populations [4].
This study reports a within-trial economic evaluation of StandingTall, an unsupervised, home-based balance exercise e-Health programme delivered via a tablet-computer, that incorporates physical and behavioural elements designed to promote adherence compared with a health promotion education control programme, using a health and community-care funder perspective.
Methods
Participants and setting
StandingTall was a prospective, assessor-blinded, RCT with a 2-year follow up, conducted between February 2015 and November 2019 [10, 11]. The trial was approved by the University of New South Wales Human Research Ethics Committee (HC14266) and registered prospectively with the Australian New Zealand Clinical Trials Registry (ACTRN 12608000250336). Five hundred and three participants were recruited from metropolitan Sydney, Australia. Eligible participants were aged ≥70 years, English speaking, living independently, able to walk in their home without a walking aid, willing to give informed consent and comply with the study protocol.
e-Health programme
All participants received a health promotion education programme delivered via a tablet-computer, including information on general health and falls risk [11]. The intervention participants (n = 254) additionally received the StandingTall programme, consisting of tailored balance exercises delivered via a tablet-computer and incorporating a foam cushion, stepping box and exercise mat as exercise equipment. Intervention participants were asked to complete the balance exercise programme for at least 2-h per week for 2 years. They received a 60-min home visit at trial commencement to set up a safe space for the exercises plus a 30-min follow-up home visit at 1 month, to ensure they were progressing, using the programme safely and provide help if needed. The control group participants (n = 249) were encouraged to continue with usual activities and were followed up by two 15-min phone calls, at 1 week and at 1 month from trial commencement, to resolve any issues with using the tablet-computer or accessing the health promotion education programme. StandingTall is described in full elsewhere [10, 11].
Health outcome measures
The health outcomes of cost-effectiveness analysis (CEA) were the number of falls and injurious falls at 24 months. A fall was defined as ‘an unexpected event in which the participant comes to rest on the ground, floor or lower level’ [12]. Injurious falls were defined as falls that resulted in an injury (e.g. bruises, pain, cuts/grazes, sprains/strains, joint dislocations and fractures), or falls that required medical care (e.g. visit to a medical doctor and emergency department) [11]. Falls were monitored prospectively over 24 months after baseline assessment using weekly fall diaries through the tablet-computer and automatically uploaded to a database. Research staff contacted participants with missing falls and/or health resource diaries by telephone at the end of each month to obtain missing data [11].
Costs associated with delivering the programme
| Resource | Total use (average) | Unit cost, $AUD | Total cost, $AUD | Basis of estimate |
|---|---|---|---|---|
| Implementation costs—salary components | ||||
| Installation visit | 248 | 53.07–56.31 | 22,956 | Research assistant hourly rate between 2015 and 2018. Total cost is based on a 60-min visit + average travel time (return trip) |
| Home visit at 1 month | 220 | 53.07–56.31 | 14,561 | Research assistant hourly rate between 2015 and 2018. Total cost is based on 30-min visit + average travel time (return trip) |
| Adherence call | 478 | 53.07–56.31 | 6,252 | Research assistant hourly rate between 2015 and 2018. Adherence calls made by RA during the first 6 months of the intervention. Total cost is based on 15 min per phone call. |
| Adherence voice message | 16 | 53.07–56.31 | 41 | Research assistant hourly rate between 2015 and 2018. Adherence calls made by RA during the first 6 months of the intervention. Estimated 2 min per voice message. |
| Tablet-computer (iPad) related issues | 53 | 53.07–56.31 | 6,978 | Research assistant hourly rate between 2015 and 2018. Total cost is based on 30-min visit + travel time |
| Implementation costs—non-salary components | ||||
| Travel costs to and from participant’s home | 33* | 0.72 per kilometre | 15,560 | Kilometres + ATO car expenses. Google Maps was used to estimate distance (kilometres). ATO Car expenses: https://www.ato.gov.au |
| Tablet-computers (iPad) | 470 | 421.30 | 198,011 | Financial trial records |
| Exercise equipment: | ||||
| Mat | 255 | 139.00 | 35,445 | Financial trial records |
| Box | 255 | 35.00 | 8,925 | Financial trial records |
| Foam cushion | 255 | 39.00 | 9,945 | Financial trial records |
Note: ATO, Australian Taxation Office; RA, research assistant; *average kilometres.
The health outcome for the cost-utility analysis (CUA) was quality-adjusted life years (QALYs) gained. Utility-based quality of life was measured using the 5-level EQ-5D version (EQ-5D-5L) questionnaire and the 20-item Assessment of Quality of Life, 6 Dimensions (AQoL-6D) at baseline, 6, 12, 18 and 24 months [11]. The value set and crosswalk score was based on the EQ-5D-5L, the range is −0.285 or −0.594 to 1, respectively [13].
Resource utilisation
The approach to costing is reported in Tables 1 and 2. Table 1 provides costs associated with programme delivery. Table 2 provides the costs associated with healthcare and community service use. Dollar amounts are presented in 2020 Australian dollars. A discount rate of 5% was applied in year 2 [14, 15]. Community service costs were sourced from a systematic review of unit costs of allied health and community services used by older Australians [16]. The 2015 per unit exchange rate of 0.52 Great British Pounds (GBP) was searched on 7 December 2021 to convert GBP to Australian dollars using the Xe.com historical rate tables website (https://www.xe.com).
Unit costs and estimated cost of the programme and health and community-care resource use for the intervention and control groups over 2 years
| Unit cost | Intervention group, n = 254 | Control group, n = 249 | P value | |||||
|---|---|---|---|---|---|---|---|---|
| Total service use(average per patient) | Total cost | Average cost per patient (SD) | Total service use (average per patient) | Total cost | Average cost per patient (SD) | |||
| Programme costs | – | $227,460 | $896 (0) | – | $107,970 | $434 (0) | – | |
| Hospital admissions | $5366.00 | 183 (0.55) | $958,419 | $3,773 (17,578) | 141 (0.73) | $740,815 | $2,975 (13,558) | 0.57 |
| General practitioner | $73.95 | 4,755 (19.45) | $343,998 | $1,354 (1,184) | 4,940 (19.10) | $357,083 | $1,434 (1,178) | 0.45 |
| Occupational therapy | $64.20 | 370 (1.24) | $23,182 | $91 (387) | 315 (1.49) | $19,673 | $79 (243) | 0.67 |
| Physiotherapy | $64.20 | 1,911 (9.06) | $119,641 | $471 (932) | 2,301 (7.67) | $144,560 | $581 (1,136) | 0.24 |
| Community nursing | $51.15 | 1,796 (4.77) | $89,616 | $353 (978) | 1,211 (7.21) | $60,370 | $242 (533) | 0.12 |
| Home care (cleaning) | $57.43 | 4,893 (14.74) | $274,828 | $1,082 (1,345) | 3,743 (19.65) | $210,328 | $845 (1,828) | 0.10 |
| Transport and shopping | $12.39 | 2,254 (5.56) | $27,192 | $107 (270) | 1,411 (9.05) | $17,086 | $69 (176) | 0.06 |
| Meal delivery | $11.10 | 1,485 (3.17) | $16,129 | $63 (283) | 804 (5.96) | $8,676 | $35 (200) | 0.19 |
| Showering | $36.40 | 935 (3.74) | $33,010 | $130 (647) | 951 (3.75) | $33,869 | $136 (604) | 0.92 |
| Total costs Average cost per patient | – | $2,113,475 | $8,321 (18,958) | – | $1,700,431 | $6,829 (15,019) | 0.33 | |
| Unit cost | Intervention group, n = 254 | Control group, n = 249 | P value | |||||
| Number of users (average per user) | Average cost per resource-user (SD) | Number of users (average per user) | Average cost per resource-user (SD) | |||||
| Hospital admissions | $5366.00 | Average length of stay 2.5 days | 45 (2.2) | $21,298 (37,349) | 39 (1.9) | $18,995 (29,789) | 0.76 | |
| General practitioner | $73.95 | Medicare Benefits Schedule Category 1 Level C | 231 (12.6) | $1,489 (1,157) | 233 (13.5) | $1,533 (1,154) | 0.69 | |
| Occupational therapy | $64.20 | Medicare Benefits Schedule Item 10958 Group M3 Allied Health Services | 46 (2.5) | $504 (792) | 44 (2.0) | $447 (415) | 0.67 | |
| Physiotherapy | $64.20 | Medicare Benefits Schedule Item 10960 Group M3 Allied Health Services | 125 (5.2) | $957 (1,141) | 128 (5.8) | $1,129 (1,377) | 0.28 | |
| Community nursing | $51.15 | 30-min consultation* | 132 (3.7) | $679 (1,274) | 119 (3.4) | $507 (679) | 0.19 | |
| Home care (cleaning) | $57.43 | 1-h duration, assuming 100% domestic assistance* | 178 (12.1) | $1,544 (1,367) | 106 (13.5) | $1,984 (2,368) | 0.05 | |
| Transport and shopping | $12.39 | Return trip (mean cost Australia)* | 76 (6.3) | $358 (394) | 81 (5.0) | $211 (256) | 0.01 | |
| Meal delivery | $11.10 | One meal delivered* | 45 (5.2) | $358 (594) | 37 (2.9) | $234 (477) | 0.31 | |
| Showering | $36.40 | Personal care* | 36 (1.8) | $917 (1,511) | 41 (2.2) | $826 (1,295) | 0.78 | |
| Unit cost | Intervention group, n = 254 | Control group, n = 249 | P value | |||||
|---|---|---|---|---|---|---|---|---|
| Total service use(average per patient) | Total cost | Average cost per patient (SD) | Total service use (average per patient) | Total cost | Average cost per patient (SD) | |||
| Programme costs | – | $227,460 | $896 (0) | – | $107,970 | $434 (0) | – | |
| Hospital admissions | $5366.00 | 183 (0.55) | $958,419 | $3,773 (17,578) | 141 (0.73) | $740,815 | $2,975 (13,558) | 0.57 |
| General practitioner | $73.95 | 4,755 (19.45) | $343,998 | $1,354 (1,184) | 4,940 (19.10) | $357,083 | $1,434 (1,178) | 0.45 |
| Occupational therapy | $64.20 | 370 (1.24) | $23,182 | $91 (387) | 315 (1.49) | $19,673 | $79 (243) | 0.67 |
| Physiotherapy | $64.20 | 1,911 (9.06) | $119,641 | $471 (932) | 2,301 (7.67) | $144,560 | $581 (1,136) | 0.24 |
| Community nursing | $51.15 | 1,796 (4.77) | $89,616 | $353 (978) | 1,211 (7.21) | $60,370 | $242 (533) | 0.12 |
| Home care (cleaning) | $57.43 | 4,893 (14.74) | $274,828 | $1,082 (1,345) | 3,743 (19.65) | $210,328 | $845 (1,828) | 0.10 |
| Transport and shopping | $12.39 | 2,254 (5.56) | $27,192 | $107 (270) | 1,411 (9.05) | $17,086 | $69 (176) | 0.06 |
| Meal delivery | $11.10 | 1,485 (3.17) | $16,129 | $63 (283) | 804 (5.96) | $8,676 | $35 (200) | 0.19 |
| Showering | $36.40 | 935 (3.74) | $33,010 | $130 (647) | 951 (3.75) | $33,869 | $136 (604) | 0.92 |
| Total costs Average cost per patient | – | $2,113,475 | $8,321 (18,958) | – | $1,700,431 | $6,829 (15,019) | 0.33 | |
| Unit cost | Intervention group, n = 254 | Control group, n = 249 | P value | |||||
| Number of users (average per user) | Average cost per resource-user (SD) | Number of users (average per user) | Average cost per resource-user (SD) | |||||
| Hospital admissions | $5366.00 | Average length of stay 2.5 days | 45 (2.2) | $21,298 (37,349) | 39 (1.9) | $18,995 (29,789) | 0.76 | |
| General practitioner | $73.95 | Medicare Benefits Schedule Category 1 Level C | 231 (12.6) | $1,489 (1,157) | 233 (13.5) | $1,533 (1,154) | 0.69 | |
| Occupational therapy | $64.20 | Medicare Benefits Schedule Item 10958 Group M3 Allied Health Services | 46 (2.5) | $504 (792) | 44 (2.0) | $447 (415) | 0.67 | |
| Physiotherapy | $64.20 | Medicare Benefits Schedule Item 10960 Group M3 Allied Health Services | 125 (5.2) | $957 (1,141) | 128 (5.8) | $1,129 (1,377) | 0.28 | |
| Community nursing | $51.15 | 30-min consultation* | 132 (3.7) | $679 (1,274) | 119 (3.4) | $507 (679) | 0.19 | |
| Home care (cleaning) | $57.43 | 1-h duration, assuming 100% domestic assistance* | 178 (12.1) | $1,544 (1,367) | 106 (13.5) | $1,984 (2,368) | 0.05 | |
| Transport and shopping | $12.39 | Return trip (mean cost Australia)* | 76 (6.3) | $358 (394) | 81 (5.0) | $211 (256) | 0.01 | |
| Meal delivery | $11.10 | One meal delivered* | 45 (5.2) | $358 (594) | 37 (2.9) | $234 (477) | 0.31 | |
| Showering | $36.40 | Personal care* | 36 (1.8) | $917 (1,511) | 41 (2.2) | $826 (1,295) | 0.78 | |
Note:* Basis of estimate derived from Farag et al. (2013); **Costs discounted at 5%; SD, standard deviation.
Statistical analysis
ICERs were expressed as cost per fall prevented, cost per injurious fall prevented and cost per QALY gained. We used bootstrapping with replacement, generating 5,000 cost and effect pairs to estimate the non-parametric uncertainty around both the incremental costs and outcomes, and presented this using a cost-effectiveness plane. Appendix 1 (Supplementary data are available in Age and Ageing online) presents the bias-corrected and accelerated confidence intervals (CIs) for incremental costs and health outcomes. A cost-effectiveness acceptability curve was derived to capture uncertainty around the probability that the intervention is below the cost-effectiveness threshold given a decision maker’s willingness to pay [18]. Edney et al. [19] has been used for reporting probability of, and judging, cost-effectiveness.
Subgroup analysis was conducted using a pre-specified interaction term based on stratification. All analyses were conducted in Stata IC version 16.1.
Sensitivity analysis
We performed one-way sensitivity analyses to assess the robustness of our results. To account for the costs of implementing the programme in a more geographically dispersed community, we varied travel costs and salaried time of the research assistant by halving, doubling and quadrupling the average distance travelled. We adjusted for a fully online telehealth-based delivery, omitting the costs associated with travel to participant homes. We varied the cost of delivering the intervention by omitting the costs of tablet-computers and exercise-related equipment. We conducted a number of variations to account for the costs of ongoing maintenance of the programme when implemented in a community setting; adjusting the costs of implementing the intervention via a subscription-based model of $10 per month and assuming a cost of $5,000 per month for maintenance of the app and web-based services. Finally, we varied the discounting rate to 0 and 3.5% to allow broader interpretation of the results.
Subgroup analysis
To account for known risk factors for falls on the costs of the programme, we completed pre-specified subgroup analyses for gender (male and female), age (<80 years of age and ≥80 years of age) and fall history (none and ≥1 falls in the year prior to starting participation).
Results
Participant characteristics are shown in Appendix 2 (Supplementary data are available in Age and Ageing online). All participants were included in the economic evaluation. Over 2 years, there were 286 (average 1.13) falls and 173 (average 0.68) injurious falls in the intervention group compared to 358 (average 1.44) falls and 226 (average 0.91) injurious falls in the control group. The RCTs primary outcomes were rate of falls and proportion of people who had a fall over 12 months. Secondary outcomes were the number of people who had a fall and number of injurious falls over 24 months. Fall rates were not statistically significant in the two groups at 12 months. There was a statistically significant reduction in fall rate, with an incidence rate ratio (IRR) of 0.84 (95% CI 0.72–0.98, P = 0.027) in the intervention group compared to the control group over 24 months. Rate of injurious falls also significantly reduced: IRR 0.80 (95% CI 0.66–0.98, P = 0.031) in the intervention group compared to the control group. There was a small improvement of 0.03 (95% CI 0.01–0.06, P < 0.05) in the EQ5D-5L at 6-months in the invention group compared to the control group. All other health-related quality of life (HRQoL) measures showed no difference between groups at follow-up.
The cost of programme delivery was $896 per person for the intervention group and $434 per person for the control group (Table 1). Table 2 provides unit costs and estimated cost of the programme and health and community-care resource use for the intervention and control groups based on per resource user over the 2 years. The average per person costs was $8,321 per person (standard deviation [SD] 18,958) in the intervention group and $6,829 per person (SD 15,019) in the control group.
Table 3 provides the incremental costs, effects and ICERs. The base-case incremental cost per fall prevented was $4,785. The incremental cost per injurious fall prevented was $6,585. The incremental cost per QALY gained was $58,039 for EQ-5D-5L (base QALY analysis) and $110,698 for AQoL-6D. Figure 1 provides the cost-effectiveness planes for falls and injurious falls prevented. The flattening of the cost-effectiveness acceptability curve at $10,000 (Figure 2) indicates the intervention has a high probability of being cost-effective at a decision maker’s willingness to pay at $10,000 per fall prevented (74%) and per injurious fall (76%) prevented. A decision maker’s willingness to pay of $60,000 has a further probability of being cost effective; 93% per fall prevented and 92% per injurious fall prevented.
Incremental costs, effects and ICERs for the base-case, sensitivity and subgroup analyses
| Incremental cost, AUD$ | Incremental effect on falls prevented | ICER, AUD$ | Incremental effect on injurious falls prevented | ICER AUD$ | Incremental effect on QALY gained (EQ5D-5 L) | ICER, AUD$ | Incremental effect on QALY gained (AQoL-6D) | ICER, AUD$ | |
|---|---|---|---|---|---|---|---|---|---|
| Base-case | 1,492 | 0.31 | 4,785 | 0.23 | 6,585 | 0.0257 | 58,039 | 0.01 | 110,698 |
| Sensitivity analyses | |||||||||
| Half travel cost (implementation, home visit & iPad issues) | 1,418 | 0.31 | 4,547 | 0.23 | 6,258 | 0.0257 | 55,158 | 0.0135 | 105,204 |
| Double travel cost (implementation, home visit & iPad issues) | 1,640 | 0.31 | 5,260 | 0.23 | 7,239 | 0.0257 | 63,801 | 0.0135 | 121,689 |
| Quadruple travel cost (implementation, home visit & iPad issues) | 1,936 | 0.31 | 6,210 | 0.23 | 8,547 | 0.0257 | 75,326 | 0.0135 | 143,669 |
| Telehealth intervention delivery (no costs associated with intervention delivery, travel costs, home visits or iPad issues, or iPad/equipment) | 1,055 | 0.31 | 3,383 | 0.23 | 4,656 | 0.0257 | 41,032 | 0.0135 | 78,261 |
| Omitted exercise related equipment costs | 1,279 | 0.31 | 4,102 | 0.23 | 5,645 | 0.0257 | 49,752 | 0.0135 | 94,893 |
| Subscription model ($10/month, $5,000 IT fees per month, over 2 years) | 1,290 | 0.31 | 4,136 | 0.23 | 5,693 | 0.0257 | 50,173 | 0.0135 | 95,695 |
| Discount rate 0% | 1,528 | 0.31 | 4,902 | 0.23 | 6,747 | 0.0263 | 58,091 | 0.0137 | 111,242 |
| Discount rate 3.5% | 1,502 | 0.31 | 4,819 | 0.23 | 6,632 | 0.0259 | 58,054 | 0.0136 | 110,858 |
| Subgroup analyses | |||||||||
| Male | 420 | 0.11 | 3,843 | 0.15 | 2,811 | 0.0332 | 12,653 | 0.0254 | 15,466 |
| Female | 1,898 | 0.40 | 4,772 | 0.27 | 7,135 | 0.0250 | 75,898 | 0.0088 | 215,981 |
| Aged <80 years | 428 | 0.40 | 1,081 | 0.38 | 1,122 | 0.0237 | 18,059 | 0.0284 | 15,051 |
| Aged ≥80 years | 5,215 | 0.03 | 163,830 | −0.20 | CG dominated | 0.0184 | 284,049 | −0.0230 | CG dominated |
| Individuals with a history of falls | −885 | 0.89 | Dominated | 0.47 | Dominated | 0.0350 | Dominated | 0.0052 | Dominated |
| Individuals with no history of falls | 2,881 | 0.14 | 21,043 | 0.18 | 16,064 | 0.0236 | 122,260 | 0.0254 | 113,524 |
Note: Base-case is not part of sensitivity analysis, included here for comparison CG, control group; IT, information technology.
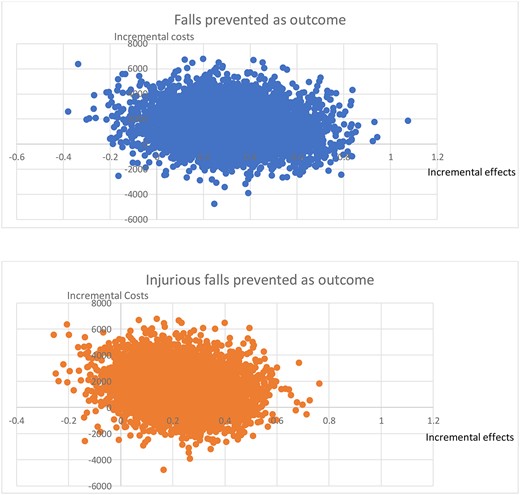
Cost-effectiveness planes. Note: cost-effectiveness planes for falls prevented and injurious falls prevented.
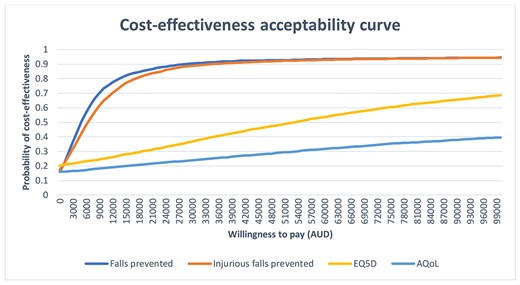
Cost-effectiveness acceptability curve. Note: cost-effectiveness acceptability curve for falls prevented and injurious falls prevented.
The sensitivity analysis (Table 3) reported the ICER ranges from $3,383 to $6,210 per fall prevented and $4,656 to $8,547 per injurious fall prevented depending on how the programme was implemented. The reported ICER per QALY gained, as measured by the AQOL-6D, ranged from $78,261 to $143,669. Travel costs were a significant factor associated with programme implementation identified by both the CEA and CUA.
The subgroup analyses of cost-effectiveness (Table 3) revealed that it was more expensive to deliver the programme to women and those aged ≥80 years. The ICER for women was $4,772 compared to $3,843 for males per fall prevented and $7,135 compared to $2,811 per injurious fall prevented. The ICER for participants aged ≥80 years was $163,830 compared to an ICER of $1,081 for those <80 years per fall prevented. For injurious falls prevented the ICER for individuals <80 years per injurious fall prevented was $1,122, compared to individuals aged ≥80 years, where the control group dominated. For falls prevented and injurious falls prevented in individuals with a history of falls, the intervention group dominated; the ICERs for individuals with no history of falls was $21,043 per fall prevented and $16,064 per injurious fall prevented.
The subgroup analyses of cost-utility (Table 3) revealed the best cost-utility in men with an ICER of $15,466 per QALY gained and in those with a history of falls, where the intervention dominated. Whereas the control group dominated in those ≥80 years of age. The ICER per QALY gained for females was $215,981 and individuals <80 years was $15,051.
Discussion
This is the first known economic evaluation of a technology-driven home-based balance exercise programme designed to reduce falls in community-dwelling people aged ≥ 70 years. The average cost of delivering the programme was $896 per person. The incremental cost-effectiveness of the programme was $4,785 per fall prevented, $6,585 per injurious fall prevented and $58,039 per QALY gained. Furthermore, the cost-effectiveness acceptability curve revealed that StandingTall is cost-effective per fall prevented, with a 74 and 76% probability of being cost-effective at a decision maker’s willingness to pay at $10,000 per fall prevented and per injurious fall prevented respectively and at 93 and 92% cost-effective per fall prevention and per injurious fall prevented respectively at $60,000.
Few studies have evaluated the cost-effectiveness of exercise-based fall prevention interventions in older community-dwelling individuals. We are not aware of any studies that included an exercise-based intervention with a duration comparable to 24 months. Coupled with the heterogeneity in the sampled population and other variations in methodology, comparisons are therefore difficult. A scoping review of the literature i.e. Australian-based, RCT, home-based exercise programme aimed at reducing falls in community-dwelling older people was undertaken to find studies most like StandingTall (Appendix 3 provides search terms, Supplementary data are available in Age and Ageing online). An Australian-based study described by McLean et al. [20] reports on the economic evaluation of a group-based programme delivered to people aged 70+ years who attended an exercise class once per week for 60-min for 15 weeks. The findings report an ICER per fall prevented of $1,236 (GBP£652) and per injurious fall prevented of $2,229 (GBP£1,176), lower than that achieved by StandingTall [20]. However, in contextualising these ICERs, it is important to consider intervention duration (24 months for StandingTall versus 4 months by McLean et al. [20]) and the inclusion of home visits, as the main differences. Combined, these may account for the greater costs seen with StandingTall. Contrastingly, the CUA reported by McLean et al. [20] was more costly at $97,586 (£51,483) per QALY (measured using the EQ-5D) gained than StandingTall, at $58,039 per QALY gained; value set and crosswalk score range: −0.285 or −0.594 to 1, respectively [13]. McLean applied a value of 1 as the baseline utility [20], which may add further complexity to the potential comparison [21].
A lack of established threshold values for a decision makers’ willingness to pay per QALY gained in Australia adds further complexity to contextualising the findings from our CUA. Within Australia there is no explicitly defined cost-effectiveness threshold, however, analyses have suggested that values between $40,000 and $60,000 are what a decision-maker is willing to pay per QALY gained [19, 22]. Therefore, at $58,039 per QALY gained (as measured by the EQ-5D-5L), the base-case delivery of StandingTall is within this range of acceptability for a decision maker. Also acceptable would be StandingTall’s delivery via telehealth, to males and individuals <80 years. Finally, for individuals with a history of falls StandingTall dominated, meaning it is less costly and more effective than usual care.
Our finding that StandingTall was more cost-effective in younger participants (<80 years) and men contrasts with previous research. Although a systematic review confirmed effective single factor interventions, such as StandingTall, provide the best value for money, it reported a cost saving in people aged 80+ years [9] and McLean et al. [20] reported cost-effectiveness in women only. An economic evaluation on gender disparity in health and healthcare found that older women had substantially greater healthcare needs compared with older men [23]. Although this may explain our finding in part, Cameron et al. [23] found that compared with men, older women were less likely to stay in hospital and had fewer GP visits. Given our subgroup analysis found that GP and hospital utilisation were proportionately the main drivers of the higher healthcare costs in women (Appendix 4, Supplementary data are available in Age and Ageing online) further sex-stratified research is needed. Further research is also needed to determine in which subgroups of older people fall prevention programmes might be most cost-effective.
Our sensitivity analysis highlighted that travel costs contributed to a large proportion of the total costs associated with the implementation of StandingTall. Therefore, to understand this effect on total costs we replaced face-to-face (i.e. removed all travel, staff and equipment costs) components with telehealth, reducing the cost of the programme to $3,383 per fall prevented. Effective fall prevention programmes must be accessible to a larger group of people, including those that live outside of metropolitan areas [24] or who prefer to exercise at home [25], at a lower cost in terms of staff and expenses [7] in order to reduce the burden falls place on the healthcare system. In addition, cost-effectiveness is influenced by scalability [26]. Technology-delivered programmes can not only reduce barriers to successful engagement [27], they can also be implemented at scale and at reduced cost compared to face-to-face programmes [24]. Furthermore, e-Health programmes provide an alternative way for individuals to access healthcare services, overcome barriers to uptake and regular participation in a fall prevention programme, they also offer health professionals the means to facilitate strength and balance exercises in the home [28, 29]. Future studies are required to evaluate the potential impact a technology-based delivery, such as telehealth, would have on effectiveness as well as any benefits of implementation at a population level.
The study has several strengths and limitations. The trial design, conduct, analysis and reporting followed the Consolidated Health Economic Evaluation Reporting Standards (CHEERS checklist; Appendix 5, Supplementary data are available in Age and Ageing online) of best-practice methods for reporting economic evaluations. The 2-year intervention duration provides long-term estimates for costs and health outcomes of StandingTall. Second, the approach to costing included costing for primary and allied healthcare provision, plus costs associated with the implementation of the programme and community care. However, health and community-care utilisation was collected via monthly questionnaires, creating potential recall bias we could not account for. Also we did not use linked electronic medical record and administrative data, therefore pharmaceutical costs were not collected. Home care admission (intervention group, N = 1; and control group, N = 3) resulted in study withdrawal, prohibiting ongoing data collection. Third, there were five falls while using the StandingTall programme in intervention group participants, which resulted in a minor injury (i.e. graze, bruising and cut). It seems unlikely that these falls would impact on HRQoL. A 20% reduction in injurious falls over 24 months is significant and greater than other studies have reported [30], however we are unable to determine if this reduction had a meaningful impact on HRQoL. Future studies should consider the timing of when a fall occurs and when measures of HRQoL are collected. Fourth, the large sample size, randomisation process, minimal dropouts and a high rate of data completeness is a strength, adding confidence to the findings. Finally, the control group also received a tablet-computer, making it more expensive and potentially increased the ICERs. Future implementation likely involves telehealth delivery to people’s own devices, which would remove these costs.
This evaluation highlights that a technology-driven home-based balance exercise programme presents a real alternative to traditionally-delivered programmes. StandingTall has been shown to reduce falls and injurious falls over the long-term. StandingTall is less costly and more effective than usual care in people with a history of falls. The CUA shows it is acceptable when delivered as a base-case, via telehealth, to men and individuals <80 years. This suggests technology-driven programmes have the potential to reduce the impact of falls in specific subpopulations of older people, but not necessarily the whole older population. This is significant given the COVID-19 pandemic, which has highlighted the importance of digital technologies in the continued delivery of healthcare.
Acknowledgements
Transparency declaration: K.D. affirms that the manuscript is an honest, accurate and transparent account of the study being reported. No aspects of the study have been omitted. Any discrepancies from the study as originally planned and registered have been explained. Data sharing: De-identified participant data may be accessed by researchers who provide a methodologically sound proposal. Proposals should be directed to k.delbaere@neura.edu.au and data are available from the date of publication of this manuscript. The study protocol is available as a free-access publication [11]. Dissemination to participants and related patient and public communities: Outcomes will be disseminated through study newsletters, community events, social media and media releases.
Declaration of Conflicts of Interest
None.
Declaration of Sources of Funding
This work was funded by Australian National Health and Medical Research Council (grant no. APP1084739), Gandel Philanthropy and NeuRA Foundation. MA is supported by a university awarded PhD scholarship. KSvS was supported by a Human Frontier Science Program Fellowship (LT001080/2017). TL was supported by a NHMRC Early Career Fellowship (APP1141392) and National Heart Foundation Postdoctoral Fellowship (award ID 101956). AT is supported by a University of Sydney Robinson Fellowship. KD was supported by the Australian National Health and Medical Research Council (grant no. APP1105106). The funders did not have a role in study design; in the collection, analysis or interpretation of data; in the writing of the report; and in the decision to submit the paper for publication.

Comments