


Abstract
Widowhood is a stressful life event with one of the most profound negative effects on health and longevity. Immigrant populations are growing and aging throughout Western nations, and marginalization and cultural differences may make some immigrants especially vulnerable to the stressors of widowhood. However, studies have yet to systematically explore whether the widowhood effect differs between immigrant and native-born individuals.
Using Danish population register data from 1980 to 2014, this study assesses whether the relationship between widowhood and mortality differs between immigrants from 10 countries and native-born Danes aged 50 and older at 0–2, 3–5, and 6 and more years post-widowhood.
We find that immigrant men are at higher risk of dying in the first 2 years after experiencing widowhood than Danish-born men, but these mortality differences dissipate over longer periods. Immigrant women have a higher risk of having died 3 and more years after a spouse’s death than Danish women. Patterns vary further by country of origin.
The results suggest that some immigrants may suffer more from widowhood than native-born individuals, giving insight into how immigration background may influence the health effects of negative life events. They also underscore the potential vulnerabilities of aging immigrant populations to stressors encountered in older age.
Spousal bereavement is one of the most stressful events that individuals can encounter over the life course, helping to explain why widowed individuals have poorer health and are at greater risk of their own subsequent death than nonwidowed persons—a phenomenon known as “the widowhood effect” (Holm et al., 2019; Moon et al., 2011; Shor et al., 2012). At the same time, widowhood is a complex, multifaceted experience that varies across individual characteristics (Carr & Bodnar-Deren, 2009; Elwert & Christakis, 1995; Shor et al., 2012; Sullivan & Fenelon, 2014). Scholars have made recent calls to deepen knowledge about what aging in a non-native land means for the health of growing populations of older immigrants (Ciobanu et al., 2017; Kristiansen, Razum et al., 2016; Solé-Auró & Crimmins, 2008). One question centers on the health effects of widowhood. Immigrants may face social, economic, and health disadvantages relative to native-born persons (Ciobanu et al., 2017; Kristiansen, Razum et al., 2016), which could make the stress of losing a spouse especially potent. Furthermore, coping with widowhood in an unfamiliar cultural context may worsen the experience of grief (Kokou-Kpolou et al., 2017; Kristiansen, Younis et al., 2016; Saito, 2014). However, prior studies have yet to investigate whether the health consequences of widowhood differ between foreign- and native-born persons.
Addressing this research gap, we use Danish population register data from 1980 to 2014 to assess whether the risk of mortality after a spouse’s death varies between immigrants from 10 national origins and native-born Danes. Our study offers insight into how immigration background may shape the health effects of widowhood and other stressful life events in older age.
Background
Research consistently shows that widowhood negatively affects adults’ health and longevity (for reviews, see Holm et al., 2019; Moon et al., 2011; Onrust & Cuijpers, 2006; Shor et al., 2012). The negative health effects of widowhood appear strongest immediately following the loss of a spouse, but also persist long term (Moon et al., 2011; Onrust & Cuijpers, 2006; Shor et al., 2012). While less healthy individuals are more likely to experience widowhood, studies showing increased mortality following all types of spousal deaths support the conclusion that there is a causal link (Boyle et al., 2011; Elwert & Christakis, 1995).
Explanations for how widowhood affects health and reduces life spans are multilevel. Spousal deaths are a profound and disruptive life stressor (Carr & Bodnar-Deren, 2009; Elwert & Christakis, 1995; Onrust & Cuijpers, 2006). Besides the immediate need to cope with practical issues surrounding their partner’s death, widows are frequently faced with the task of dramatically restructuring their day-to-day lives (Carr & Bodnar-Deren, 2009; Holm et al., 2019; Lillard & Waite, 2008). The emotional experience of grief can be long-lasting, complex, and debilitating (Holm et al., 2019; Onrust & Cuijpers, 2006). Widowhood also removes the health benefits of marriage, which include social, emotional, and material support and the promotion of healthy behaviors (Kiecolt-Glaser & Newton, 2001; Umberson, 1987). Studies indicate that widowhood may be followed by feelings of isolation, the loss of material resources, and poorer health behaviors (Carr & Bodnar-Deren, 2009; Holm et al., 2019; Iwashyna & Christakis, 2003; Lillard & Waite, 2008; Williams, 2004).
Research also suggests that these impacts vary across social groups. For example, widowhood appears to take a greater toll on men’s than women’s health, partly because women have wider social networks (Carr & Bodnar-Deren, 2009; Martikainen & Valkonen, 1996; Moon et al., 2011; Schaefer et al., 1995; Sullivan & Fenelon, 2014). Research also shows that widowhood is more detrimental at younger than older ages (Martikainen & Valkonen, 1996; Schaefer et al., 1995; Shor et al., 2012), and that higher socioeconomic status is protective against the widowhood effect (Sullivan & Fenelon, 2014).
However, relatively few studies have assessed racial, ethnic, and cross-cultural differences in the health effects of widowhood. A key U.S.-based analysis found that the relationship between widowhood and mortality was stronger for White than Black Americans (Elwert & Christakis, 1995). The authors suggest that because Black families tend to have broader social networks and less gendered divisions of labor than White families, less adjustment is required after a spouse’s death. Research has also examined differences in the widowhood–health relationship within Europe. In one study, widowhood predicted a smaller increase in depressive symptoms in northern than southern European countries, which have more gendered divisions of labor (Schaan, 2013). Another analysis found that well-being following widowhood was poorer in nations with high marriage rates, which may indicate that widowhood effects are stronger in contexts that highly value the institution of marriage (Ory & Huijts, 2015).
Although quantitative analyses are nearly absent, there are reasons to expect that widowhood may be especially detrimental for some immigrants. Drawing on cross-national findings, immigrants from backgrounds that are more traditionally gendered or highly value marriage may find widowhood particularly disruptive. Additionally, cultural beliefs about death and bereavement (Rosenblatt, 2001) can mean that grief is felt more profoundly among persons from certain backgrounds than others. Discontinuities between personal and local mourning rituals may further complicate immigrants’ widowhood experiences, as suggested by qualitative studies (Kokou-Kpolou et al., 2017; Kristiansen, Razum et al., 2016; Saito, 2014; Schreiber, 1995). For example, alienation from their native bereavement practices worsened grief surrounding family members’ deaths among West African women living in France and Belgium (Kokou-Kpolou et al., 2017). Another study found that widowed Greek-born women in Australia were more depressed and had poorer self-rated health than British-born widows, suggesting that stronger cultural and language differences with a host country may exacerbate the stresses of widowhood (Panagiotopoulos et al., 2013).
Immigrants’ potential heightened vulnerability to the effects of widowhood is underscored by the literature documenting their marginalization and challenges to their health. A “healthy migrant” effect whereby immigrants in higher-income countries appear to live longer than native-born persons is well-documented and partly explainable by the selection of healthier individuals into immigration (Abraído-Lanza et al., 1999; Razum, 2006). However, people immigrate for many reasons, and those fleeing persecution, war, and economic hardship may bring long-term health disadvantages to them (Ciobanu et al., 2017; Pavli & Maltezou, 2017; World Health Organization [WHO], 2011). Additionally, the experience of immigrating is often difficult, accompanied by financial burdens or hazardous journeys (Bhugra, 2004; Pavli & Maltezou, 2017; WHO, 2011). Once in the host country, immigrants may face stress adapting to a new culture and language, encounter discrimination, and have fewer rights and privileges than native-born persons (Bhugra, 2004; Ciobanu et al., 2017; Pavli & Maltezou, 2017). They may also have diminished nonfamilial social networks, making spouses especially important sources of support (Ciobanu et al., 2017; Kristiansen, Razum et al., 2016).
Enabling us to uncover whether the widowhood effect varies across immigrants from diverse backgrounds, our study includes older persons who moved to Denmark from 10 countries: Germany, Norway, Sweden, Poland, (former) Soviet Union, (former) Yugoslavia, the United Kingdom, the United States, Turkey, and Vietnam. Denmark provides a unique context for studying relationships between immigration background and widowhood because the first of its immigrant cohorts are now reaching older age. Although there was a small consistent flow of immigrants from neighboring countries after World War II, Denmark was largely ethnically homogenous until the late 1960s (Matthiessen, 2009; Pedersen & Smith, 2002; Tegunimataka, 2017). During a period of growth from 1960 to 1973, the government invited guest workers, predominantly from Turkey and Yugoslavia, to immigrate (Mouritsen & Olsen, 2013; Pedersen & Smith, 2002; Tegunimataka, 2017). Immigration was mainly limited to family reunifications when this policy ended (Pedersen & Smith, 2002). Further policy changes in the late 1980s saw influxes of immigrants from Poland, Vietnam, Iran, Iraq, Pakistan, and Lebanon. Modest numbers of refugees and asylum seekers have immigrated to Denmark during times of instability in the years since, including from Yugoslavia in the 1990s (Pedersen & Smith, 2002). On average, guest workers and refugee immigrants exhibit lower levels of employment and educational attainment than native Danes, have lower Danish language proficiency, and are more likely to marry within their ethnic group than other immigrants (Liebig, 2007; Matthiessen, 2009; Tegunimataka, 2017). Immigration from neighboring Nordic and other Western countries has remained relatively stable since the 1980s. Immigrants from these countries typically arrive for specific work and education opportunities, are considered well integrated into the Danish economy, and often intermarry with Danes (Liebig, 2007; Tegunimataka, 2017). To receive a full old-age pension in Denmark, individuals need to have lived there for 40 years by retirement (Matthiessen, 2009; Organisation for Economic Co-operation and Development, 2019). However, a reduced pension is available to persons in residence for at least three working years, and residence requirements are relaxed for some foreign nationals. On average, fewer immigrants receive pensions than native Danes and at lower payouts (Danmarks Statistik, 2017; Matthiessen, 2009).
Research Aims
This study assesses immigration background differences in the widowhood effect using registries of the entire population of Denmark. We are guided by the question: Does the relationship between widowhood and mortality differ between native- and foreign-born persons residing in Denmark? Because marginalization and disadvantaged backgrounds may increase their vulnerability to stress and experiencing widowhood in a nonnative context may be especially difficult, we expect that immigrants will have a greater increase in mortality after widowhood than native Danes. We also expect country-of-origin differences in these patterns. Specifically, we predict that immigrants who arrived from more traditionally gendered or culturally distinct countries as well as those who may have been pushed by economic or social crises (e.g., Turkey, former Yugoslavia, Poland, former Soviet Union, and Vietnam) will have a greater increase in post-bereavement mortality relative to native Danes than those who likely moved for specific economic and schooling opportunities (e.g., from Germany, Norway, Sweden, the United Kingdom, and the United States). In other words, we expect that the stress of losing a spouse may be especially potent for immigrants with fewer resources or with cultural origins that are more distant from Denmark. The findings will be instructive about whether cultural and immigrant backgrounds condition the health consequences of stressful losses encountered in older age.
Method
Sample
Denmark maintains systematic registers of the entire population, which contain information on a wide variety of population characteristics. This study uses linked data from the Central Person Register, the Integrated Database for Labor Market Research, and the Population Education Register (Petersson et al., 2011; Schmidt et al., 2014). To construct our sample, we first selected all individuals who were ever married between January 1980 and December 2014 (N = 4,367,944). We then limited immigrants to those who lived in Denmark over the entire observation period and arrived from one of the 10 countries with large enough populations to support meaningful country-specific analyses: Germany, Norway, Sweden, Poland, (former) Soviet Union, (former) Yugoslavia, the United Kingdom, the United States, Turkey, and Vietnam (N = 4,026,769). To isolate the mortality effects of experiencing widowhood outside of additional marital transitions, we dropped individuals who divorced or remarried (N = 3,173,619). We focus on persons aged 50 and older (N = 2,411,568), as widowhood is relatively rare among younger people. After excluding subjects for whom we could not identify the spousal link and who were missing information on employment (N = 213,525), our sample included 2,198,043 persons with 37,841,825 person-years.
Individuals enter the study: (a) the month they turned 50 if married, (b) at the time of marriage if 50 or older, or (c) at the time of immigration for married persons who moved to Denmark when they were 50 and older. All individuals were followed until death, censoring due to emigration, or December 31, 2014, whichever came first. The data were interval-censored, so individuals could reenter the study at reimmigration.
Measures
The main variables of interest are immigration background, which identifies whether the person is a native Dane or foreign-born, and widowhood status. Continuously married individuals are the reference category for widowhood status, and other categories are widowed 0–2 years (0–24 months), 3–5 years (25–60 months), and 6 and more years (61+ months). We measure widowhood over different periods because studies suggest that excess mortality is highest shortly after widowhood (Moon et al., 2011; Shor et al., 2012) and combine years with limited numbers of events to approximate short-, mid-, and long-term follow-up periods. Country of origin is also a key covariate. To account for immigration background differences in these characteristics, analyses include time-constant education, income, and parental status, measured at entry into the study, as well as time-varying employment status. Education was categorized as high (International Standard Classification of Education Levels 4–8), medium (Level 3), or low (Levels 0–2). Average household gross income was split into tertiles according to the yearly income distribution of the Danish population. Parental status identifies parents and childless persons, and employment was divided into employed and not working.
Statistical Analysis
The analysis employed Cox proportional hazard models (Cox, 1972), with death due to any cause as the failure event. The baseline hazard is a function of age. The proportional hazards assumption for covariates was tested using scaled Schoenfeld residuals after fitting each model. All analyses were conducted separately by gender. Our modeling strategy began with widowhood status and immigration background (Model 1) and then added a term interacting widowhood and immigrant background to assess whether the relationship between widowhood and mortality differed for foreign- and native-born persons (Model 2). Model 3 added income and employment status. To capture whether the widowhood effect differed among immigrants with different origins, Model 4 included country of origin and Model 5 added interactions between country and widowhood.
Supplementary Analyses
Denmark did not institute compulsory data collection for education until 1970, and the registers only contain information about education completed in Denmark. This resulted in substantial missing data on education, especially for immigrants, and we were unable to include it in the main analyses. We were also unable to include parental status as parent–child linkages were incomplete for individuals born before 1940 (40.8% of our sample). Sensitivity analyses including these characteristics among individuals with complete information on each are discussed in the results, as are analyses that include divorced and remarried widowed persons.
Results
The study population included 2,140,014 native Danes and 58,029 immigrants. Table 1 presents descriptive statistics by immigration background and gender. About 18% of native-born men and 42% of native-born women experienced widowhood from 1980 to 2014. The corresponding percentages were lower among immigrant men and women, at 11% and 35%, respectively. Immigrants were somewhat younger than native Danes at the study exit. More immigrants than native Danes were in the low-income group and not working on entry into the study. The largest groups of immigrants were from Germany, followed by former Yugoslavia, Sweden, and Norway. Although there is significant missing information on education among immigrants, they appear more likely to have low or high education relative to native Danes. Somewhat fewer immigrants than native Danes were parents when they entered the study.
Background Characteristics of the Study Population by Gender and Immigration Background in Percentages or Mean (SD) for Continuous Variables
| Native-born persons | Immigrants | |||
|---|---|---|---|---|
| Characteristic | Men | Women | Men | Women |
| Widowed, 1980–2014 | 18.1 | 41.8 | 10.9 | 35.0 |
| Age at entry into the studya | 56.3 (8.7) | 55.2 (7.6) | 55.5 (8.2) | 55.4 (8.0) |
| Age at exit from the studyb | 71.0 (10.9) | 70.0 (10.6) | 66.7 (11.2) | 68.3 (11.2) |
| Income at study entry (tertiles) | ||||
| Low | 29.7 | 32.1 | 48.6 | 48.2 |
| Medium | 34.7 | 34.5 | 26.5 | 25.4 |
| High | 35.6 | 33.4 | 24.9 | 26.4 |
| Employment status at study entry | ||||
| Employed | 69.2 | 57.5 | 50.8 | 40.3 |
| Not working | 30.8 | 42.5 | 49.2 | 59.7 |
| Country of origin | ||||
| Denmark | 100 | 100 | ||
| Germany | 25.0 | 26.2 | ||
| Norway | 8.2 | 13.5 | ||
| Poland | 6.4 | 7.7 | ||
| Former Soviet Union | 1.6 | 1.7 | ||
| Sweden | 8.6 | 13.7 | ||
| Turkey | 10.6 | 8.0 | ||
| UK | 9.1 | 6.3 | ||
| USA | 5.6 | 4.2 | ||
| Vietnam | 6.1 | 4.6 | ||
| Former Yugoslavia | 18.7 | 14.0 | ||
| Education at study entry for cohorts born in 1922 and after | ||||
| Low | 32.7 | 46.2 | 20.1 | 30.0 |
| Medium | 45.2 | 33.7 | 34.1 | 30.4 |
| High | 21.3 | 19.6 | 26.2 | 22.3 |
| Missing | 0.8 | 0.5 | 19.6 | 17.3 |
| Parental status at study entry for cohorts born in 1940 and after | ||||
| Childless | 6.1 | 5.6 | 18.7 | 18.2 |
| Parents | 93.9 | 94.4 | 81.3 | 40.3 |
| Total N | 1,090,976 | 1,049,038 | 27,099 | 30,930 |
| Number of deaths 1980–2014 (%) | 570,768 (52.3) | 461,970 (44) | 9,121 (33.7) | 11,023 (35.6) |
| Number of deaths 0–2 years post-widowhood | 29,701 (2.7) | 30,742 (2.9) | 494 (1.8) | 764 (2.5) |
| Number of deaths 3–5 years post-widowhood | 35,006 (3.2) | 43,817 (4.2) | 494 (1.8) | 1,083 (3.5) |
| Number of deaths 6+ years post-widowhood | 80,791 (7.4) | 203,733 (19.4) | 973 (3.6) | 4,551 (14.7) |
aAge 50 if married, age at marriage if 50 and older when entering marriage, and age at immigration if married and 50 and older on arrival to Denmark.
bAge at death or end of the study period (December 31, 2014).
Supplementary Table 1 provides descriptive characteristics among immigrants by country of origin. Immigrants from Turkey, Vietnam, and former Yugoslavia were especially likely to be low income and parents at the beginning of the study. Turkish immigrants were the most likely to have low education. Time since immigration at the study start averaged about 10 years across groups, while the average age at immigration ranged from 26.2 (Turkish men) to 47.2 (men from the former Soviet Union). Paid work in the year after immigrating was highest among German, Norwegian, Swedish, Turkish, British, and American men, implying possible work-related moves to Denmark. Additionally, most immigrants from Germany, Norway, Sweden, the United States, and the United Kingdom were married to a native Dane, while a majority of those from Turkey, Vietnam, and former Yugoslavia were married to another immigrant from their country.
The Widowhood Effect on Mortality Among Men
Model 1 of Table 2 shows that immigrant and Danish-born men had similar mortality hazard from 1980 to 2014. Relative to married men, widowed men had nearly 33% elevated hazard of death in the first 2 years after losing their spouse (hazard ratio [HR] = 1.329), 28% greater hazard in the next 3–5 years (HR = 1.279), and 23% greater hazard 6 and more years post-widowhood (HR = 1.234). After adding interactions between widowhood status and immigration in Model 2, immigrant men had a slight survival advantage over Danish men. The interaction terms indicate that excess mortality within the first 2 years after a spousal loss was 15% greater among immigrant than Danish men (HR = 1.148), but there were no immigration background differences in mortality 3 or more years post-widowhood. Similar patterns are shown in Model 3, which also indicates that being higher income or employed was protective of men’s survival.
Mortality Hazard Ratios by Widowhood Status and Immigration Background Among Men in Denmark
| Model 1 | Model 2 | Model 3 | Model 4 | Model 5 | |||||||||||
|---|---|---|---|---|---|---|---|---|---|---|---|---|---|---|---|
| HR | 95% CI | HR | 95% CI | HR | 95% CI | HR | 95% CI | HR | 95% CI | ||||||
| Lower | Upper | Lower | Upper | Lower | Upper | Lower | Upper | Lower | Upper | ||||||
| Immigrant (ref.: Native-born) | 0.982 | 0.962 | 1.003 | 0.974 | 0.951 | 0.997 | 0.932 | 0.911 | 0.954 | ||||||
| Widowhood status (ref.: Married) | |||||||||||||||
| Widowed 0–2 years | 1.329 | 1.313 | 1.345 | 1.326 | 1.310 | 1.342 | 1.300 | 1.285 | 1.316 | 1.303 | 1.288 | 1.319 | 1.300 | 1.285 | 1.316 |
| Widowed 3–5 years | 1.279 | 1.265 | 1.293 | 1.278 | 1.264 | 1.293 | 1.259 | 1.245 | 1.273 | 1.260 | 1.246 | 1.274 | 1.259 | 1.245 | 1.273 |
| Widowed 6+ years | 1.234 | 1.224 | 1.244 | 1.234 | 1.224 | 1.244 | 1.267 | 1.257 | 1.277 | 1.267 | 1.257 | 1.278 | 1.267 | 1.257 | 1.277 |
| Immigrant × Widowhood status | |||||||||||||||
| Immigrant × 0–2 years | 1.148 | 1.047 | 1.258 | 1.190 | 1.085 | 1.304 | |||||||||
| Immigrant × 3–5 years | 1.040 | 0.949 | 1.140 | 1.079 | 0.985 | 1.183 | |||||||||
| Immigrant × 6+ years | 0.994 | 0.093 | 1.064 | 1.031 | 0.964 | 1.103 | |||||||||
| Income (ref.: Low) | |||||||||||||||
| Medium | 0.842 | 0.836 | 0.847 | 0.841 | 0.836 | 0.846 | 0.841 | 0.836 | 0.846 | ||||||
| High | 0.711 | 0.706 | 0.716 | 0.710 | 0.705 | 0.715 | 0.710 | 0.705 | 0.715 | ||||||
| Employment status (ref.: Not working) | |||||||||||||||
| Employed | 0.787 | 0.781 | 0.794 | 0.787 | 0.781 | 0.793 | 0.787 | 0.781 | 0.793 | ||||||
| Country of origin (ref.: Denmark) | |||||||||||||||
| Germany | 0.999 | 0.964 | 1.036 | 0.984 | 0.945 | 1.025 | |||||||||
| Norway | 1.066 | 1.004 | 1.132 | 1.060 | 0.990 | 1.134 | |||||||||
| Poland | 0.894 | 0.827 | 0.967 | 0.892 | 0.816 | 0.976 | |||||||||
| Former Soviet Union | 0.870 | 0.774 | 0.977 | 0.859 | 0.751 | 0.983 | |||||||||
| Sweden | 1.052 | 0.993 | 1.114 | 1.055 | 0.987 | 1.129 | |||||||||
| Turkey | 0.897 | 0.826 | 0.975 | 0.869 | 0.796 | 0.948 | |||||||||
| UK | 0.941 | 0.864 | 1.025 | 0.921 | 0.838 | 1.013 | |||||||||
| USA | 0.971 | 0.894 | 1.054 | 0.958 | 0.871 | 1.054 | |||||||||
| Vietnam | 0.619 | 0.557 | 0.688 | 0.590 | 0.525 | 0.662 | |||||||||
| Former Yugoslavia | 0.834 | 0.782 | 0.890 | 0.846 | 0.790 | 0.906 | |||||||||
| Country of origin × Widowhood status | |||||||||||||||
| Germany × 0–2 years | 1.179 | 1.016 | 1.369 | ||||||||||||
| Germany × 3–5 years | 1.124 | 0.973 | 1.299 | ||||||||||||
| Germany × 6+ years | 0.989 | 0.883 | 1.108 | ||||||||||||
| Norway × 0–2 years | 1.244 | 0.959 | 1.614 | ||||||||||||
| Norway × 3–5 years | 1.121 | 0.861 | 1.461 | ||||||||||||
| Norway × 6+ years | 0.907 | 0.748 | 1.100 | ||||||||||||
| Poland × 0–2 years | 1.170 | 0.840 | 1.628 | ||||||||||||
| Poland × 3–5 years | 0.911 | 0.646 | 1.284 | ||||||||||||
| Poland × 6+ years | 0.990 | 0.782 | 1.253 | ||||||||||||
| Former Soviet Union × 0–2 years | 1.276 | 0.823 | 1.980 | ||||||||||||
| Former Soviet Union × 3–5 years | 1.581 | 1.036 | 2.411 | ||||||||||||
| Former Soviet Union × 6+ years | 0.707 | 0.467 | 1.071 | ||||||||||||
| Sweden × 0–2 years | 1.049 | 0.831 | 1.325 | ||||||||||||
| Sweden × 3–5 years | 0.990 | 0.783 | 1.252 | ||||||||||||
| Sweden × 6+ years | 0.959 | 0.808 | 1.139 | ||||||||||||
| Turkey × 0–2 years | 1.404 | 0.888 | 2.220 | ||||||||||||
| Turkey × 3–5 years | 1.314 | 0.799 | 2.162 | ||||||||||||
| Turkey × 6+ years | 1.535 | 1.027 | 2.294 | ||||||||||||
| UK × 0–2 years | 1.049 | 0.637 | 1.729 | ||||||||||||
| UK × 3–5 years | 0.777 | 0.464 | 1.300 | ||||||||||||
| UK × 6+ years | 1.301 | 0.999 | 1.695 | ||||||||||||
| USA × 0–2 years | 1.091 | 0.758 | 1.572 | ||||||||||||
| USA × 3–5 years | 0.829 | 0.569 | 1.209 | ||||||||||||
| USA × 6+ years | 1.151 | 0.911 | 1.455 | ||||||||||||
| Vietnam × 0–2 years | 0.999 | 0.532 | 1.877 | ||||||||||||
| Vietnam × 3–5 years | 1.556 | 0.954 | 2.538 | ||||||||||||
| Vietnam × 6+ years | 1.484 | 1.030 | 2.139 | ||||||||||||
| Former Yugoslavia × 0–2 years | 1.172 | 0.823 | 1.669 | ||||||||||||
| Former Yugoslavia × 3–5 years | 0.721 | 0.472 | 1.102 | ||||||||||||
| Former Yugoslavia × 6+ years | 0.832 | 0.620 | 1.116 | ||||||||||||
| Number of persons | 1,118,075 | ||||||||||||||
| Number of person-years | 18,017,688 | ||||||||||||||
| N deaths | 579,900 | ||||||||||||||
Note: HR = hazard ratio; CI = confidence interval.
The top panel of Figure 1 provides a visual representation of widowhood status and immigration background differences in age-specific mortality among men. The hazard functions of each group are estimated with generalized linear mixed models and a kernel-based smoothing approach. The figure shows a survival advantage among stably married men over widowers and among immigrants compared to Danish men. However, immigrant men’s survival advantage is smaller among widowers.
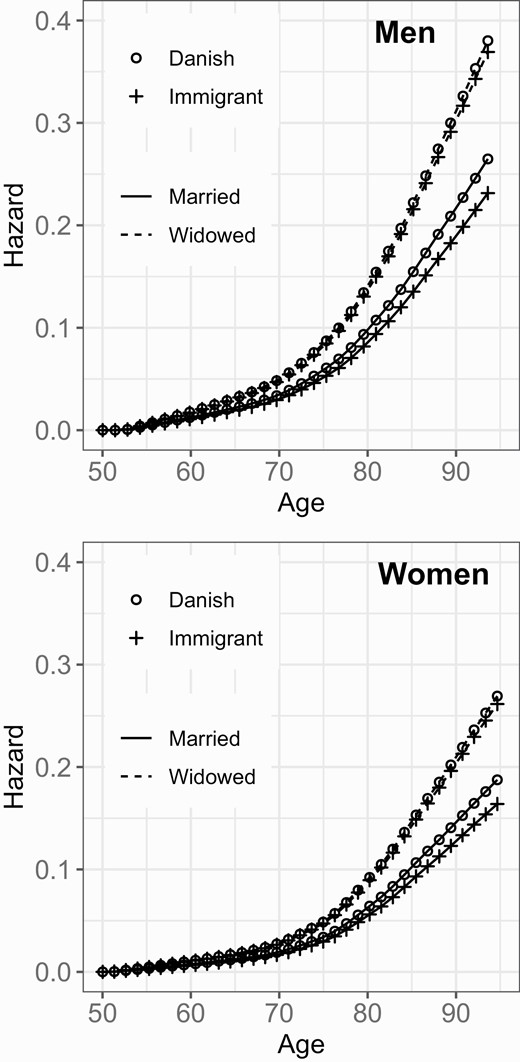
Age-specific mortality hazard by widowhood status and immigration background among men and women in Denmark.
Model 4 added country of origin (with Denmark as the reference). Immigrant men from Poland, former Soviet Union, Turkey, the United Kingdom, Vietnam, and former Yugoslavia had a survival advantage while those from Norway had a slight survival disadvantage relative to native-born men. Model 5, which includes interactions between country and widowhood status, reveals that excess mortality following a spousal death was greater among men from Germany than Danish-born men within 2 years (HR = 1.179) after widowhood. Men from the former Soviet Union had an elevated hazard of death 3–5 years post-widowhood (HR = 1.581) while Turkish (HR = 1.535) and Vietnamese men (HR = 1.484) had greater mortality hazard in association with being widowed 6 and more years than Danish-born men.
The Widowhood Effect on Mortality Among Women
Model 1 of Table 3 indicates that immigrant women had a similar hazard of dying from 1980 to 2014 as native-born women. Compared to being stably married, the hazard of death was almost 30% higher in the first 2 years of being widowed (HR = 1.295), 24% higher after 3–5 years of widowhood (HR = 1.240), and almost 26% higher 6 and more years post-widowhood (HR = 1.259). The interaction terms in Model 2 reveal that the effect of spousal death on mortality was 6.8% greater for immigrant than native Danish women 6 and more years post-widowhood (HR = 1.068). Immigrant women’s slight survival advantage over the study period reached statistical significance in Model 2 (HR = 0.957). After adding income and employment status (Model 3), immigrant women also had an 8% greater hazard of death in association with being widowed 3–5 years than Danish women (HR = 1.077). As for men, women with medium or high incomes and who were working had a lower hazard of dying than those with low incomes or who did not work.
Mortality Hazard Ratios by Widowhood Status and Immigration Background Among Women in Denmark
| Model 1 | Model 2 | Model 3 | Model 4 | Model 5 | |||||||||||
|---|---|---|---|---|---|---|---|---|---|---|---|---|---|---|---|
| HR | 95% CI | HR | 95% CI | HR | 95% CI | HR | 95% CI | HR | 95% CI | ||||||
| Lower | Upper | Lower | Upper | Lower | Upper | Lower | Upper | Lower | Upper | ||||||
| Immigrant (ref.: Native-born) | 0.990 | 0.972 | 1.009 | 0.957 | 0.929 | 0.985 | 0.942 | 0.915 | 0.970 | ||||||
| Widowhood status (ref.: Married) | |||||||||||||||
| Widowed 0–2 years | 1.295 | 1.280 | 1.311 | 1.294 | 1.278 | 1.310 | 1.275 | 1.26 | 1.291 | 1.277 | 1.261 | 1.292 | 1.276 | 1.260 | 1.292 |
| Widowed 3–5 years | 1.240 | 1.227 | 1.254 | 1.239 | 1.225 | 1.252 | 1.226 | 1.213 | 1.240 | 1.228 | 1.215 | 1.242 | 1.227 | 1.213 | 1.240 |
| Widowed 6+ years | 1.259 | 1.250 | 1.269 | 1.257 | 1.248 | 1.267 | 1.286 | 1.276 | 1.296 | 1.288 | 1.279 | 1.298 | 1.286 | 1.277 | 1.297 |
| Immigrant × Widowhood status | |||||||||||||||
| Immigrant × 0–2 years | 1.032 | 0.955 | 1.115 | 1.052 | 0.974 | 1.137 | |||||||||
| Immigrant × 3–5 years | 1.055 | 0.986 | 1.128 | 1.077 | 1.007 | 1.151 | |||||||||
| Immigrant × 6+ years | 1.068 | 1.025 | 1.113 | 1.093 | 1.049 | 1.140 | |||||||||
| Income (ref.: Low) | |||||||||||||||
| Medium | 0.876 | 0.870 | 0.882 | 0.875 | 0.869 | 0.881 | 0.875 | 0.869 | 0.881 | ||||||
| High | 0.745 | 0.739 | 0.751 | 0.744 | 0.738 | 0.750 | 0.744 | 0.738 | 0.750 | ||||||
| Employment status (ref.: Not working) | |||||||||||||||
| Employed | 0.708 | 0.700 | 0.717 | 0.707 | 0.699 | 0.716 | 0.707 | 0.699 | 0.716 | ||||||
| Country of origin (ref.: Denmark) | |||||||||||||||
| Germany | 1.004 | 0.973 | 1.035 | 0.997 | 0.949 | 1.048 | |||||||||
| Norway | 1.048 | 1.001 | 1.096 | 1.054 | 0.985 | 1.128 | |||||||||
| Poland | 1.076 | 1.000 | 1.158 | 0.987 | 0.879 | 1.108 | |||||||||
| Former Soviet Union | 1.059 | 0.953 | 1.176 | 1.054 | 0.886 | 1.254 | |||||||||
| Sweden | 1.017 | 0.973 | 1.062 | 0.962 | 0.897 | 1.032 | |||||||||
| Turkey | 0.727 | 0.645 | 0.818 | 0.615 | 0.524 | 0.721 | |||||||||
| UK | 0.924 | 0.853 | 1.002 | 0.867 | 0.767 | 0.978 | |||||||||
| USA | 1.050 | 0.963 | 1.146 | 0.969 | 0.840 | 1.118 | |||||||||
| Vietnam | 0.624 | 0.543 | 0.717 | 0.596 | 0.494 | 0.719 | |||||||||
| Former Yugoslavia | 0.818 | 0.747 | 0.896 | 0.786 | 0.703 | 0.880 | |||||||||
| Country of origin × Widowhood status | |||||||||||||||
| Germany × 0–2 years | 0.970 | 0.853 | 1.104 | ||||||||||||
| Germany × 3–5 years | 0.992 | 0.889 | 1.107 | ||||||||||||
| Germany × 6+ years | 1.022 | 0.954 | 1.094 | ||||||||||||
| Norway × 0–2 years | 0.987 | 0.817 | 1.193 | ||||||||||||
| Norway × 3–5 years | 1.041 | 0.884 | 1.225 | ||||||||||||
| Norway × 6+ years | 0.977 | 0.885 | 1.080 | ||||||||||||
| Poland × 0–2 years | 1.150 | 0.857 | 1.541 | ||||||||||||
| Poland × 3–5 years | 1.222 | 0.946 | 1.577 | ||||||||||||
| Poland × 6+ years | 1.151 | 0.978 | 1.354 | ||||||||||||
| Former Soviet Union × 0–2 years | 1.185 | 0.800 | 1.755 | ||||||||||||
| Former Soviet Union × 3–5 years | 1.005 | 0.691 | 1.461 | ||||||||||||
| Former Soviet Union × 6+ years | 0.979 | 0.775 | 1.237 | ||||||||||||
| Sweden × 0–2 years | 0.922 | 0.768 | 1.105 | ||||||||||||
| Sweden × 2–3 years | 1.070 | 0.921 | 1.243 | ||||||||||||
| Sweden × 6+ years | 1.137 | 1.032 | 1.252 | ||||||||||||
| Turkey × 0–2 years | 1.883 | 1.181 | 3.002 | ||||||||||||
| Turkey × 3–5 years | 1.746 | 1.135 | 2.687 | ||||||||||||
| Turkey × 6+ years | 1.400 | 1.064 | 1.843 | ||||||||||||
| UK × 0–2 years | 1.011 | 0.719 | 1.421 | ||||||||||||
| UK × 3–5 years | 1.252 | 0.953 | 1.646 | ||||||||||||
| UK × 6+ years | 1.116 | 0.934 | 1.333 | ||||||||||||
| USA × 0–2 years | 1.303 | 0.938 | 1.809 | ||||||||||||
| USA × 3–5 years | 1.009 | 0.733 | 1.389 | ||||||||||||
| USA × 6+ years | 1.143 | 0.942 | 1.387 | ||||||||||||
| Vietnam × 0–2 years | 1.635 | 0.968 | 2.764 | ||||||||||||
| Vietnam × 3–5 years | 0.750 | 0.393 | 1.434 | ||||||||||||
| Vietnam × 6+ years | 1.101 | 0.810 | 1.497 | ||||||||||||
| Former Yugoslavia × 0–2 years | 1.112 | 0.745 | 1.660 | ||||||||||||
| Former Yugoslavia × 3–5 years | 0.937 | 0.640 | 1.371 | ||||||||||||
| Former Yugoslavia × 6+ years | 1.193 | 0.957 | 1.487 | ||||||||||||
| Number of persons | 1,079,968 | ||||||||||||||
| Number of person-years | 19,824,137 | ||||||||||||||
| Number of deaths | 473,008 | ||||||||||||||
Note: HR = hazard ratio; CI = confidence interval.
The lower panel of Figure 1 provides a visual representation of these differences, showing the same general patterns as among men: widowhood increases mortality hazard for both foreign- and native-born women, and immigrant women’s small but consistent survival advantage over Danish women is reduced among the widowed.
Adding country of origin, Model 4 shows that women from Turkey, Vietnam, and former Yugoslavia had a survival advantage and women from Norway and Poland had a survival disadvantage relative to native-born women. Interactions between widowhood status and country of origin in Model 5 indicate that the hazard of death associated with widowhood was greater for Turkish than Danish-born women over all post-widowhood periods (HRs = 1.883 for 0–2 years, 1.746 for 3–5 years, and 1.400 for 6+ years). Additionally, Swedish women had a greater hazard of death 6 and more years after widowhood (HR = 1.137) and Vietnamese women had greater mortality in the first 2 years of widowhood (HR = 1.692) than Danish women.
Supplemental Analyses
Analyses including education and parental status—missing for about a third and fourth of the sample, respectively—are summarized in Supplementary Table 2. Model 1 limited the sample to those born in 1922 or later, who have nearly complete education data. Men and women with medium and high education had lower mortality than those with low education. As in the main analyses, immigrant men had higher mortality hazard within 2 years of being widowed and immigrant women had a higher risk of dying 3–5 years post-widowhood than their Danish counterparts, although at 6 and more years immigrant women’s excess disadvantage in widowhood was not significant. Model 2 includes parental status as a control, limiting the sample to those born in 1940 or after (with nearly complete fertility histories). Both men and women who were parents had a lower hazard of death than childless people. However, interactions between widowhood and immigrant background are not significant. Thus, parental status differences between immigrants and nonimmigrants may help explain why the widowhood effect is stronger among foreign-born individuals. Although we do not exclude this possibility, we are cautious with the interpretation because of the omission of older cohorts and a small number of events in this sample, particularly among immigrants.
We included divorced persons and widowed persons who remarried in further supplemental analyses (Supplementary Table 3). Divorced persons have higher mortality than the stably married, while men who remarry after widowhood have slightly lower mortality than the stably married. Interaction analyses also reveal that the increase in the risk of death associated with being divorced (vs. stably married) is smaller among immigrant than native Danish men. Because divorced persons have greater mortality and are not included in our main analyses, it is important to note when interpreting the widowhood effect that the comparison is a selected group of those who are among the most healthy, the stably married.
Discussion
Our analyses showed that the elevated risk of death in the first 2 years after being widowed was greater among immigrant than native Danish men, although this difference was not significant at longer durations of widowhood. Immigrant women experienced a greater risk of dying than Danish-born women 3 and more years post-widowhood when controlling for income and employment status.
These findings partially support our hypothesis that widowhood would take a greater toll on foreign- than native-born persons. We cannot directly test possible explanatory mechanisms using these data. However, qualitative studies have revealed that among immigrants, coping with the immediate stressors of widowhood can be complicated by a lack of familiarity with local systems and alienation from one’s own cultural grief practices (Kokou-Kpolou et al., 2017; Saito, 2014; Schreiber, 1995). Additionally, immigrants are disproportionately exposed to various health-linked stressors, which can include insufficient social and economic resources, experiences with discrimination and trauma, and language and cultural adaptation issues (Bhugra, 2004; Ciobanu et al., 2017; Kristiansen, Razum et al., 2016; Pavli & Maltezou, 2017). Spouses are key sources of support who can help to buffer the adverse effects of stress, which is another reason why we believe that losing a marital partner may affect foreign- more than native-born persons. Future explorations of health among widowed persons of different immigrant backgrounds will shed further light on these possibilities.
Time since widowhood had different implications for immigration background differences in the widowhood effect for women and men. Among men surviving their spouse 3 and more years, immigration background is no longer a significant source of variation in excess mortality. By contrast, among women differences are only apparent over longer durations of widowhood. Although widowhood effects diminish over time in most studies (Moon et al., 2011; Shor et al., 2012), scholars have also noted that certain health consequences of being widowed may take time to accumulate (Berntsen & Kravdal, 2012; Dupre & Meadows, 2007; Hughes & Waite, 2009). Perhaps widowhood effects that disproportionately disadvantage immigrant women, such as reduced material resources, do not exert a measurable toll on their health until several years have passed. However, we would like to point out that HRs for interactions between immigration background and all other widowhood periods also imply immigrants’ greater vulnerability to the widowhood effect and are close to statistically significant for both women and men.
Analyses disaggregating the immigrant sample provide mixed support for our prediction that we would observe country-of-origin differences in the widowhood effect that reflect more disadvantaged immigration backgrounds or stronger cultural differences with Danes. The finding that Turkish women appear to suffer more from widowhood than Danish women at all durations of bereavement is most consistent with our expectations. Supplemental analyses (Supplementary Table 1) revealed that Turkish-origin persons were among the most socioeconomically disadvantaged immigrant groups and the most likely to be married to persons from their same ethnicity. Turkish culture holds the institute of marriage in high regard, and divorced and widowed women in Turkey may experience stigmatization (Özar & Yakut-Cakar, 2013). Even within Denmark, gender roles among people of Turkish origins tend to be patriarchal, with men acting as the primary breadwinners (Liversage, 2012). Thus, Turkish-origin women may encounter more dramatic life adjustments after their spouse dies than Danish women. The gendered nature of marital roles in Turkish culture may also help explain why Turkish men have greater post-widowhood mortality than Danish men after 6 years. Perhaps Turkish men are more reliant on their wives in ways that have measurable longevity consequences after longer periods have passed, such as for control of their health behaviors. Likewise, in traditional Vietnamese culture, women bear responsibility for the family and men for work (Knodel et al., 2005). Vietnamese immigrants are also among the lowest income and most likely to intermarry, and many would have arrived to Denmark as refugees. It is possible that chronic disadvantages associated with losing their spouse add to other vulnerabilities and begin to affect mortality for men and women of this group after several years have passed. A background of hardship among men from the former Soviet Union, who were on average the oldest when they arrived and many of whom were likely driven to Denmark by economic difficulties or political persecution, may similarly help explain their excess mortality 3–5 years post-widowhood.
Findings for elevated risk of post-widowhood death at different periods among German men and Swedish women are less clear to interpret. The somewhat more traditional distribution of gender roles in German culture, in which men tend to rely on their wives for social support (Stevens & Westerhof, 2006), may help explain the mortality disadvantage of German-origin widowers in the first 2 years after widowhood. Even so, we are cautious of overinterpreting these variations, and other factors may very well help to explain these patterns, such as immigration experiences and marital contexts. We would also like to highlight that other country-of-origin differences may not have reached significance due to small samples and may understate the findings. However, we believe that the patterns underscore the importance of considering widowhood effects across different backgrounds and time periods and warrant further investigation.
Our study is not without limitations. While unparalleled in coverage, register data are restricted in their ability to provide information about the specific mechanisms driving immigrants’ greater post-widowhood mortality risk. Moreover, limited information about education and parental status prevents us from fully understanding the role of these characteristics. It is likely that there are multiple explanations for immigrants’ apparent greater vulnerability to widowhood that include both selection and causation and which vary across the country of origin and reason for immigrating. Additionally, to help us draw conclusions about immigration background differences in the widowhood effect outside of other marital transitions, we dropped individuals who divorced or remarried. Because widows who remarry are likely to be younger and healthier while people who divorce are less healthy than those who remain stably married (Dupre & Meadows, 2007), our analyses may overestimate the widowhood effect.
Although further research is needed, ours is the first large-scale investigation of whether widowhood has different impacts on the health of foreign- and native-born persons. In indicating that some immigrant persons in Denmark are at greater risk of dying after a spouse than their native-born counterparts, the findings add to research highlighting that minority and disadvantaged groups may be especially vulnerable to the effects of major stressful live events. They also underscore the possibility that cross-cultural differences in grief and the gendered division of labor influence the degree to which widowhood negatively affects health. Finally, our study adds to evidence that the health consequences of profound life stressors do not necessarily level out with time, but can persist long term.
Funding
The work was supported by funding from the National Institute on Aging (T32AG000243) and the Max Planck Society within the framework of the project “On the edge of societies: New vulnerable populations, emerging challenges for social policies and future demands for social innovation. The experience of the Baltic Sea States (2016–2021).”
Conflict of Interest
None declared.
Author Contributions
J. Caputo and A. Oksuzyan conceived the research questions. J. Caputo, P. Li, M. Kühn, and A. Oksuzyan designed the study and analytic strategy. H. Brønnum-Hansen secured access to the data. P. Li conducted the data analysis. J. Caputo and A. Oksuzyan drafted the initial version of the manuscript. J. Caputo, P. Li, M. Kühn, H. Brønnum-Hansen, and A. Oksuzyan interpreted the results, revised the subsequent versions of the manuscript, and approved the final version of the manuscript.

