


Abstract
India implemented a national mandatory lockdown policy (Lockdown 1.0) on 24 March 2020 in response to Coronavirus Disease 2019 (COVID-19). The policy was revised in three subsequent stages (Lockdown 2.0–4.0 between 15 April to 18 May 2020), and restrictions were lifted (Unlockdown 1.0) on 1 June 2020. This study evaluated the effect of lockdown policy on the COVID-19 incidence rate at the national level to inform policy response for this and future pandemics. We conducted an interrupted time series analysis with a segmented regression model using publicly available data on daily reported new COVID-19 cases between 2 March 2020 and 1 September 2020. National-level data from Google Community Mobility Reports during this timeframe were also used in model development and robustness checks. Results showed an 8% [95% confidence interval (CI) = 6–9%] reduction in the change in incidence rate per day after Lockdown 1.0 compared to prior to the Lockdown order, with an additional reduction of 3% (95% CI = 2–3%) after Lockdown 4.0, suggesting an 11% (95% CI = 9–12%) reduction in the change in COVID-19 incidence after Lockdown 4.0 compared to the period before Lockdown 1.0. Uptake of the lockdown policy is indicated by decreased mobility and attenuation of the increasing incidence of COVID-19. The increasing rate of incident case reports in India was attenuated after the lockdown policy was implemented compared to before, and this reduction was maintained after the restrictions were eased, suggesting that the policy helped to ‘flatten the curve’ and buy additional time for pandemic preparedness, response and recovery.
India implemented a strict lockdown policy to restrict the spread of COVID-19 for approximately 1.3 billion people, the second largest population in the world.
As India and other low- and middle-income countries consider COVID-19 mitigation strategies, it is crucial to evaluate the effect of the lockdown policy using empirical data.
This study implemented an interrupted time series analysis to evaluate the effect of the lockdown policy on daily reports of new cases across the lockdown stages using segmented regression.
We observed a reduction in the positive trend of new case reports in India after the lockdown policy was implemented compared to prior to the lockdown that is maintained after the restrictions were eased, suggesting that the policy helped to ‘flatten the curve’ and buy additional time for pandemic preparedness, response and recovery.
Introduction
The ongoing Coronavirus Disease 2019 (COVID-19) pandemic affected almost all the countries of the world within four months of the first case reported in Wuhan, China (World Health Organization, 2020). As the pandemic unfolded, a surge in COVID-19 cases was observed in Italy, Spain, the UK and the USA, where, historically, health systems are robust and prepared to combat a pandemic and manage the related shock to multiple social and economic sectors. However, low- and middle-income countries (LMICs) like India, Brazil, Peru and Turkey, where the pandemic started slowly, since early June 2020, have also experienced an exponential increase in COVID-19 cases (Johns Hopkins University, 2020).
The first confirmed case of Severe Acute Respiratory Syndrome Coronavirus 2 (SARS CoV-2) in India was reported in Italian tourists on 30 January 2020 (Lamba, 2020). Community spread of the virus was confirmed on 2 March 2020, with the identification of the first domestic case, and then onwards, an increasing number of COVID-19 cases were found across the country. After 1 year since the emergence of the pandemic, India has the second-highest number of reported cases worldwide, with around 10 million cases resulting in around 150 thousand deaths (Johns Hopkins University, 2020).
To contain the spread of the COVID-19 pandemic, governments across the world implemented movement restrictions that included visa restrictions, border closures, domestic travel restrictions and local curfews, generically referred to as lockdown in the literature (Chaudhry et al., 2020; Pachetti et al., 2020). Lockdowns can reduce the spread of COVID-19 by limiting person-to-person contact, which would a priori be observed as an attenuation in the growth of infection rate of COVID-19 after lockdown. This delayed effect would only be observable immediately after the incubation period of the virus has passed, which is approximately 5–6 days on average (Quesada et al. 2020). Monitoring and surveillance were also required for testing and isolation for all suspected cases and their contacts, with health examination and documentation on travel activities (Hussain, 2020).
India implemented one of the strictest lockdowns early in the pandemic due to fear that unrestricted movement might result in a torrent of COVID-19 cases, overwhelming the entire healthcare system (Busch et al., 2020). Initially, strict movement restrictions or the lockdown for 21 days (Lockdown 1.0) was announced by the Prime Minister of India on 24 March 2020 as the country reported 598 COVID-19 cases with 12 deaths (see Table 1; Ray et al., 2020). The Lockdown 1.0 was extended in three more phases lasting till 31 May 2020, along with a rapid scale-up of testing, contact tracing, and isolation, followed by the first stage of relaxing the movement restriction (Unlockdown 1.0) starting 1 June 2020 (Economic Times, 2020).
Stages of lockdown policy for mobility restrictions in India during COVID-19 pandemic
| Lockdown stages | Lockdown characteristics | |||
|---|---|---|---|---|
| Dates | Days | Restriction level | Geographical area | |
| Janata Curfewa | 22 March (7AM–9PM) | [14 h] | Voluntary restriction | Pan India |
| Lockdown 1.0c | 25 March–14 April | 21 | Complete restriction | Pan India |
| Lockdown 2.0c | 15 April–3 May | 19 | Complete restriction | Pan India |
| Lockdown 3.0d | 4 May–17 May | 14 | Some relaxations | Pan India |
| Lockdown 4.0 | 18 May–31 May | 14 | Further relaxations | Pan India |
| Unlockdown 1.0e | 1 June–30 June | 23 | Full relaxations | Containment zones and six major statesb |
| Unlockdown 2.0 | 8 June 2020 onwards | Full relaxations | Pan India except for containment zones | |
Voluntary People’s Curfew.
Punjab, Madhya Pradesh, Maharashtra, Telangana, Tamil Nadu and West Bengal. Source: National Portal of India (https://www.india.gov.in/news_lists?a5854336).
Lockdown 1.0 and 2.0 included the following restrictions (Government order 24 March 2020: https://cgda.nic.in/adm/circular/preventive-25032020.pdf).
Offices of Gvernemt of INDIA (GoI), state/union territories and their autonomous/subordinate offices and public corporations remain closed with few exceptions including, security and defence, treasury, electricity, water and sanitation, and disaster management. However, they were allowed to function with minimum employees in office with work from home facility for others.
All private and commercial establishments were closed with exceptions including ration/food/grocery shops, banking services, print and electronic media, telecom/internet/broadcasting/IT enabled services, e-commerce delivery services of essential goods including food and medicine, petrol/gas stations, power generation services, financial market services as permitted by the authorities, cold storage and security services.
Industrial establishments also remained closed with exception of units manufacturing essential products and/or as permitted by the state government.
Closure of transit—incoming and outgoing including air, land and sea. Exception—transit of essential commodities and other emergency services.
Other services that were notified to remain closed—Hospitality services (excluding infrastructure used as quarantine facilities and other commercial establishments accommodating tourists etc.), places of worship, educational/training institutions, all type of gatherings excluding funeral services, however, not exceeding 20 people.
All medical establishments, both public and private, the corresponding manufacturing and distribution units permitted to remain open including their transporation and support services.
Lockdown 3.0—Earmarked containment zones—Red, Green and Orange and each of them had a different set of permissible activities although most of the activities identified during Lockdown 1.0 and 2.0 remained prohibited for first 2 weeks (from 4th May), irrespective of the zone. (Government order https://www.mha.gov.in/sites/default/files/MHA%20Order%20Dt.%201.5.2020%20to%20extend%20Lockdown%20period%20for%202%20weeks%20w.e.f.%204.5.2020%20with%20new%20guidelines.pdf).
Unlockdown 1 followed a phased re-opening approach including access to religious places, hospitality services and shopping malls in phase I, opening of educational institutions in phase II, and re-starting international travel, metro rail services, all type of gatherings and recreational activities in phase III. During this time everyone was expected to follow social distancing and other guidelines as released by the MoHFW. (Government order: https://www.mha.gov.in/sites/default/files/MHAOrderDt_30052020.pdf).
Unlockdown 1.0 eased almost all restrictions other than continued closure of schools and limiting the number of persons in a social gathering. However, in the six states with the largest number of cases since May and into the first week of June (Punjab, Madhya Pradesh, Maharashtra, Telangana, Tamil Nadu and West Bengal), the state governments decided to continue with movement restrictions followed during the fourth stage of the lockdown. These restrictions were eventually relaxed (Unlockdown 2.0) from 8 June 2020 onwards.
The primary aim of the movement restriction and lockdown in India was to reduce the rate and number of new infections, thereby ‘flattening the curve’ of the COVID-19 pandemic. This was expected to prevent the collapse of the health system, including the shortage of beds, health workers and personal protective equipment, as happened in Italy and Spain (Busch et al., 2020). Evidence supports the effectiveness of lockdown measures in reducing the incidence and saving lives (Lau et al., 2020; Paital et al., 2020), including multiple mathematical models and scenarios (Ambikapathy and Krishnamurthy, 2020; Goscé et al., 2020; IHME COVID-19 health service utilization forecasting Team and Murray, 2020). However, limited empirical evidence is available from LMICs like India, where a large population and differences in population movement and density (compared to high-income countries) might significantly vary the effectiveness of a strict lockdown on COVID-19 incidence (GRID COVID-19 Study Group, 2020, Gupta et al., 2020). Considering the extraordinary uncertainty about how the virus behaves, some authors question the effectiveness of general lockdown and confinement as a non-targeted policy (Fernandes, 2020; Nicola et al., 2020). Lockdowns seem to be blunt tools to flatten the pandemic curve, and therefore, there is an urgent need for contextually relevant analyses from LMICs that are sufficiently fine-grained to help understand the effectiveness of social-distancing measures.
This study aims to assess the effect of the lockdown policy (Lockdown 1.0 to Unlockdown 1.0) on the rate of detecting new COVID-19 cases in India using an interrupted time series analysis. The purpose of this study is to improve understanding of the effect of these policies on the control of the COVID-19 pandemic in LMICs and help prepare for future public health emergencies.
Methods
This analysis proceeded based on the conceptual framework depicted in Figure 1, which informed our statistical model building process.
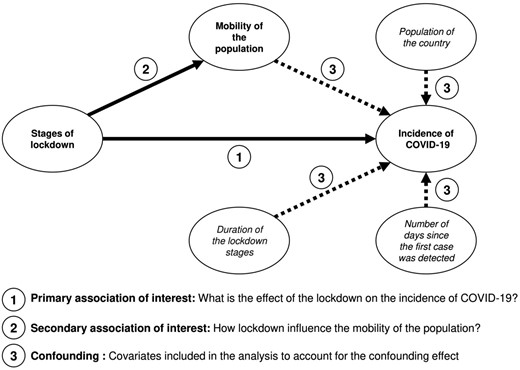
Conceptual framework for evaluating the effect of lockdown on the number of new cases in India.
The relationship between the number of new cases detected per day and the lockdown stages (from the pre-lockdown through the different stages of the lockdown until the relaxation of the lockdown) is the primary association of interest of this study. This is identified as pathway 1 in our conceptual framework. We have implemented an interrupted time series analysis using segmented regression to quantify this association (Wagner et al., 2002). Furthermore, the objective of the lockdown policy was, in part, to ensure social distancing among the general population by reducing human mobility so that the spread of the SARS CoV-2 could be attenuated (Hussain, 2020). The mobility of the population is a practical indicator that can indicate the uptake of this policy. Thus, we descriptively explored the human mobility pattern over the lockdown stages (Pathway 2). We assessed changes in mobility based on Google COVID-19 Community Mobility Reports (Google LLC, 2020) to provide insight into the uptake of the mobility restriction. Lastly, we also included the human mobility indicator as a covariate in the regression analysis to cross-validate the interrupted time series analysis.
Google COVID-19 community mobility reports
We used COVID-19 Community Mobility Reports published by Google (Google LLC, 2020) to assess the effect of the lockdown policy on human mobility. Beginning in April 2020, Google has published anonymous aggregated data that show how mobility has changed since the beginning of the pandemic. These data are collected from devices that have been opted-in to Location History sharing. Google collects data that includes quality and length of connection to networks (e.g. Global Positioning Systems, Wi-Fi) and location settings. These analyses used these daily reports at the national level.
The COVID-19 Community Mobility Reports report the percentage change from a baseline value for each day of the week. Baseline mobility was calculated as the median mobility of the population for each day of the week during the 5 weeks between 3 January and 6 February 2020 (Google LLC, 2020). The mobility data are reported for six categories (1) grocery and pharmacy, (2) parks, (3) transit stations, (4) retail and recreation, (5) residential area and (6) workplace. We assessed these data visually and conducted descriptive analyses to inform model building. These data were available beginning 15 February 2020, which provided 38 days of movement data before Lockdown 1.0 started. The latest report for this analysis was available on 14 June 2020 (Google LLC, 2020).
Interrupted time series analysis
An interrupted time series analysis was conducted to quantify the effect of the lockdown policy in India on reported incident COVID-19 cases. Reported incident cases of COVID-19 were analysed as over-dispersed count data using segmented regression models (Wagner et al., 2002). As illustrated in Figure 2, we estimated the level and trend of the reported incidence across the lockdown stages. The effect estimate controled for cyclic trends (e.g. weekly trends), varying the beginning date of the lockdown stages based on the COVID-19 Community Mobility Reports, and allowing a delay period for the effect of the mobility restrictions to manifest in incident cases.
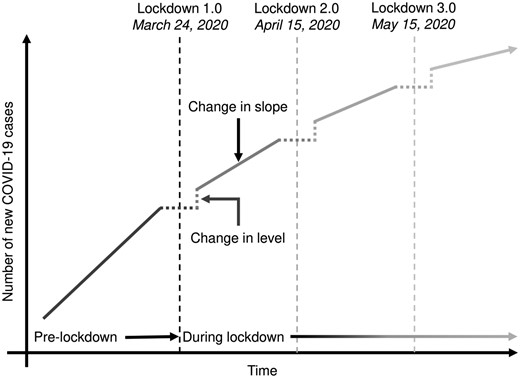
Illustration of the interrupted time series analysis to evaluate the effect of lockdown on the number of new COVID-19 cases in India.
The data included in this analysis were made publicly available by The Ministry of Health and Family Welfare (MoHFW) of the Government of India. MoHFW has maintained a decentralized laboratory-based digital disease surveillance system to detect and monitor COVID-19 since the start of the pandemic through its Integrated Disease Surveillance Programme (IDSP). These data are published daily on the web portal of the MoHFW, Government of India (www.mohfw.gov.in/) (Ministry of Health & Family Welfare, Government of India, 2020). We included incident case reports from 2 March to 1 September 2020. As the data included in this analysis were obtained from a publicly available source, ethical approval was not required for this study.
Variables and measures
Number of daily new cases
Daily reported incident cases at the national level in India is the outcome variable of this analysis. Cases are detected using the real-time polymerase chain reaction, and data were aggregated at the district, state and national levels by the MoHFW for reporting (Ministry of Health & Family Welfare, Government of India, 2020).
Stages of lockdown and the duration of each lockdown stage
Information related to the stages and the duration of the lockdown was also collected from the MoHFW website (Table 1) (Ministry of Health & Family Welfare, Government of India, 2020). The first and most restrictive stage of the lockdown (Lockdown 1.0) was officially initiated on 24 March 2020. However, before this, the Prime Minister called the nation to observe ‘Janata Curfew’ (voluntary lockdown) for 14 h on 22 March 2020, and several states began the restrictions on 22 March 2020. Following the first stage, the lockdown was extended on 15 April 2020 (Lockdown 2.0), 4 May 2020 (Lockdown 3.0), 18 May 2020 (Lockdown 4.0) throughout the country. During Lockdown 3.0, inter-state travel restrictions were eased, and some essential businesses were allowed to open. 1 June 2020 marked the first day of the relaxation of lockdown (Unlockdown 1.0), which lasted until 30 June 2020.
Two variables were created for each lockdown stage: (1) an indicator variable coded as ‘0 before the stage effect and ‘1’ after and (2) a count variable that represents the number of days from the beginning of the stage to the last day in the dataset (20 June 2020). This parameterization provides a coefficient for the change in the level of incident cases before versus after the lockdown stage and a coefficient for the change in incident cases per day (trend) after the lockdown stage (Figure 2), controlling for all other variables in the model. We explored models with a delayed effect of each lockdown stage (Bernal et al., 2017) on reported incident cases based on published incubation times (Lauer et al., 2020; Quesada 2020).
Days since the first case
We included a count variable for the number of days since the first case was reported ranging from 0 to 183 (2 March to 1 September 2020), to understand the temporal change in the COVID-19 disease incidence pattern and control for secular trends.
Day of the week
The day of the week was included in the analysis to control for weekly trends in case reports. The inclusion of this variable in the final model was supported by examining model residuals and fit statistics.
Total population
We included the log of the projected population of India as an offset to allow interpretation of the model results as incident rate ratios of daily reported COVID-19 cases. The population projection was based on the 2011 census of India (Office of the Registrar General & Census Commissioner, 2011). Thus, this model assumes that the entire population of India is at risk of COVID-19 and that contracting COVID-19 confers no immunity.
Statistical analysis
Data were analysed using R version 4·0·0 (R Core Team, 2018) with supplementary packages (Grolemund and Wickham, 2011; Venables and Ripley, 2013). After conducting exploratory data analysis of mobility patterns and reported incidents of COVID-19 cases, we implemented segmented regressions to test for a change in the trend of cases after the lockdown was instituted compared to before and to assess whether this trend changed when subsequent lockdown stages were implemented. We treated the time series of incident case data as a count by assuming a negative binomial distribution with dispersion parameter θ and a log-linear relationship with the predictor variables (Christou and Fokianos, 2015).
Incident cases in India ∼ β0 + β1 × Days since the first case + β2 × Day of the week + βLSn
× Lockdown level + βLTn × Lockdown trend +βMoi × Mobility types +
β7 × first-order autoregressive term + offset (log(population)).
To develop the interrupted time series analysis, first, we have implemented individual unadjusted models by separately including the covariates related to the number of days since the first case (β1), an indicator for the day of the week (β2), stages (βLSn) and trends (βLTn) of the lockdowns (n = 1, 2, 3 and 4), a first-order autoregressive term (β7) and log of the total population of India as the offset term. During the model selection process, to find out the best fitted and most parsimonious model, we conducted K-folds cross-validation (with K set to 5 and 80% of the data used for training in each fold) using the different combination of covariates (Bergmeir et al., 2018) (see Supplementary File S1). We considered treating lockdown as a single event rather than distinct stages due to easing of restrictions that began during Lockdown 4.0, and because they provided a formal hypothesis test to assess whether the trend in incident COVID-19 cases in India returned to baseline. We deemed that including parameters for Lockdown 4.0 would result in an acceptable increase in variance in return for reducing estimate bias.
To aid in model selection, we inspected model residuals, considered Akaike’s and Bayesian information criteria, and considered theoretical relevance and ability to test whether the lockdown policies may have affected COVID-19 incidence at the national level in India. The non-stationarity of the incident case data was assessed with an augmented Dickey–Fuller test (Agiakloglou and Newbold, 1992). Residual autocorrelation was tested with the Ljung–Box test (Ljung and Box, 1978). Model assumptions were also assessed with autocorrelation function and partial autocorrelation function plots.
Results
Mobility
The Community Mobility Reports (Google LLC, 2020) showed a reduction in mobility that preceded Lockdown 1.0 by a few days across all activities except residential, which showed a concurrent increase (Figure 3).
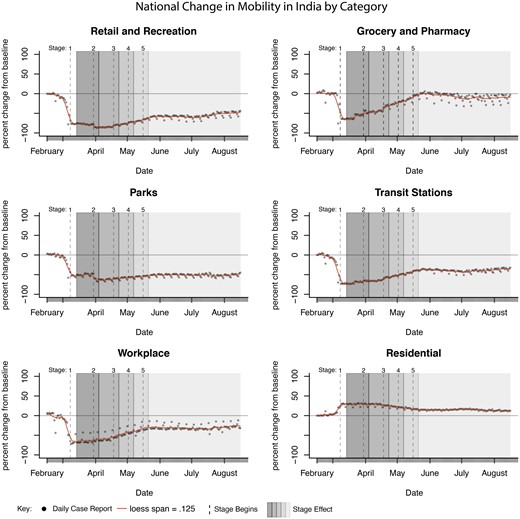
Percent change from baseline in mobility plotted against the lockdown stages.
During Lockdown 1.0 through 5.0, mobility at locations classified as grocery and pharmacy appeared to have increased steadily to near-baseline levels, whereas other categories have remained below baseline levels, with residential traffic still above baseline. Mobility at parks and retail and recreation appears to have declined more after Lockdown 2.0 was initiated, and all categories are notably flat during Lockdown 2.0 (Table 2).
Percent change from baseline daily mobility disaggregated by activity types at the national level in India by COVID-19 community mobility reports published by Google
| Lockdown stages | Number of days | Percent change in daily COVID-19 incidence rate | Percent change from baseline daily mobility | |||||
|---|---|---|---|---|---|---|---|---|
| Retail | Grocery | Parks | Transit | Workplace | Residential | |||
| Median (IQR) | Median (IQR) | Median (IQR) | Median (IQR) | Median (IQR) | Median (IQR) | Median (IQR) | ||
| Pre-lockdown | 23 | 15.8 (7.0–20.2) | −8.0 (−17.5 to −1.0) | 1.0 (−2.0 to 2.0) | −2.0 (−6.5 to −2.0) | −6.0 (−16.0 to 0.0) | −5.0 (−13.5.0 to −4.5.0) | 3.0 (0.0–6.0) |
| Lockdown 1.0 | 21 | 15.9 (10.4–19.7) | −77.0 (−78.0 to −76.0) | −63.0 (−64.0 to −55.0) | −51.0 (−53.0 to −48.0) | −73.0 (−73.0 to −69.0) | −68.0 (−69.0 to −66.0) | 30.0 (29.0–30.0) |
| Lockdown 2.0 | 19 | 7.3 (6.3–8.0) | −85.0 (−86.0 to −85.0) | −46.0 (−47.0 to −44.0) | −62.0 (−64.5 to −61.5) | −66.0 (−66.0 to −65.0) | −63.0 (−64.0 to −59.5) | 29.0 (28.0–30.0) |
| Lockdown 3.0 | 14 | 5.8 (5.2–6.4) | −79.0 (−79.6 to −77.3) | −29.0 (−32.0 to −27.3) | −59.0 (−60.0 to −58.0) | −56.0 (−57.0 to −54.0) | −49.5 (−53.5 to −48.3) | 24.5 (23.0–25.8) |
| Lockdown 4.0 | 14 | 5.0 (4.7–5.4) | −72.0 (−70.6 to −69.3) | −18.5.0 (−20.8 to −14.5) | −56.0 (−57.8 to −55.0) | −48.0 (−49.8 to −46.0) | −41.0 (−44.0 to −37.3) | 19.0 (19.0–21.0) |
| Unlockdown 1.0 | 92 | 3.5 (2.7–3.8) | −57.0 (−59.0 to −55.0) | −5.0 (−12.0 to −1.0) | −51.0 (−53.0 to −49.0) | −39.0 (−41.0 to −37.0) | −33.0 (−34.0 to −29.0) | 15.0 (13.0–16.0) |
Notes: IQR, interquartile range (lower range 25th percentile and upper range 75th percentile).
These results suggest that mobility in locations categorized as retail and recreation, grocery and pharmacy, parks, transit stations and workplace was reduced at about the same time the lockdown was announced. This supports the idea that the segmented regression model of the effect of the lockdown intervention on reported incident COVID-19 cases in India is reasonable.
Interrupted time series analysis
Before the first lockdown stage, the median COVID case growth rate was 15.8% [interquartile range (IQR) = 7.0–20.2]. During Lockdown 1.0 cases grew at a median of 15.9% (IQR = 10.4–19.7), and at a median of 7.3% (IQR = 6.3–8.0), 5.8% (IQR = 5.2–6.4), 5.0% (IQR = 4.7–5.4) during stages 2.0, 3.0 and 4.0, respectively. During the subsequent 3 months (93 days) after Unlockdown 1.0 initiated included in this analysis, cases grew at a median of 3.5% (IQR = 2.7–3.8%) (Table 2). The median number of new cases increased from 12 per day in Lockdown 1.0 to 6550.5 per day in Lockdown 4.0 (Figure 4).
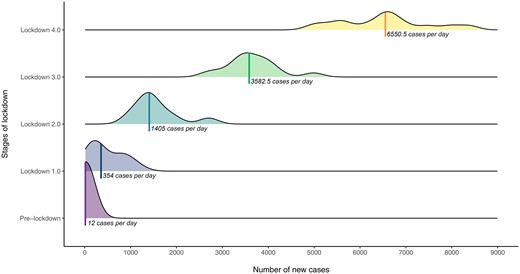
Distribution of the new cases per day and the median number of COVID-19 incidence per day for each stage of the lockdown.
Among the segmented regression models that we considered in our K-folds cross-validation, models with lockdown stages as covariates tended to perform better (i.e. had a lower root mean squared error) compared to models that include mobility indicators (see Supplementary File S1). The percent change in mobility provided marginal increases in predictive performance with a reduction in the model’s goodness of fit. Thus, we did not include the mobility indicators as covariates. Models with a short delay in the policy’s effect (e.g. 4–6 days), with a count for the number of days since the first case and the weekday, tended to perform better than those without. Additionally, models including autoregressive terms tended to perform better than those without, with most of the benefit being achieved with a first-order autoregressive term. The final selected model included variables for only Lockdown 1.0 and 4.0, starting at the officially announced date with a 5-day delay for each stage’s effect and controlling for the day of the week.
The selected model suggested that before Lockdown 1.0, the daily increase of the national COVID-19 incidence rate in India of 14% [95% confidence intervals (CI) = 13–16%], adjusting for covariates. After the fifth day of Lockdown 1.0, there was a significant reduction in the trend of 8% (95% CI = 6–9%) accompanied by a 268% (95% CI = 212–340%) increase in the level of incidence rate, adjusting for covariates (Table 3). This suggests a reduction in the growth of cases after Lockdown 1.0. After the fourth lockdown stage, there was no significant change in the level of daily incidence rate, but the trend of the daily incidence rate was further significantly reduced by 3% (95% CI = 2–3%).
Effect estimate of unadjusted and final segmented regressions of interrupted time series analysis
| Unadjusted model | Selected model | |
|---|---|---|
| Incident rate ratio (95% confidence interval) | ||
| Days since first case | 1.04 (1.04–1.04) | 1.14 (1.13–1.16) |
| Lockdown 1.0 level | 319.54 (195.26–500.53) | 2.69 (2.12–3.40) |
| Lockdown 1.0 trend | 1.04 (1.04–1.04) | 0.92 (0.91–0.94) |
| Lockdown 4.0 level | 13.53 (9.04–20.32) | 0.98 (0.84–1.15) |
| Lockdown 4.0 trend | 1.05 (1.05–1.05) | 0.97 (0.97–0.98) |
| Weekday | 1.03 (0.91–1.18) | 0.99 (0.98–1.01) |
| First-order differences | 1.00 (1.00–1.00) | 1.00 (1.00–1.00) |
| Intercept | 0.00 | |
| θ (Theta) | 18.99 | |
| Ljung–Box test for residual autocorrelation | χ2 = 0.01, df = 1, P-value = 0.79 | |
Notes:The number of days included in all models was 105.
All models assume a negative binomial distribution with dispersion parameter θ (theta) and log link.
AIC, Akaike Information Criterion; BIC, Bayesian Information Criterion.
Figure 5 shows the change in daily reported incident COVID-19 cases in India with fitted values and 95% confidence intervals from the selected model plotted on the log scale. These results show that, while incident cases continued to increase through the analysis period, there was a reduction in the rate of increase after the first lockdown policy was introduced. Further, the slope of the incidence rate did not return to the pre-Lockdown level after restrictions were eased in Lockdown 3.0 through Unlockdown 1.0.
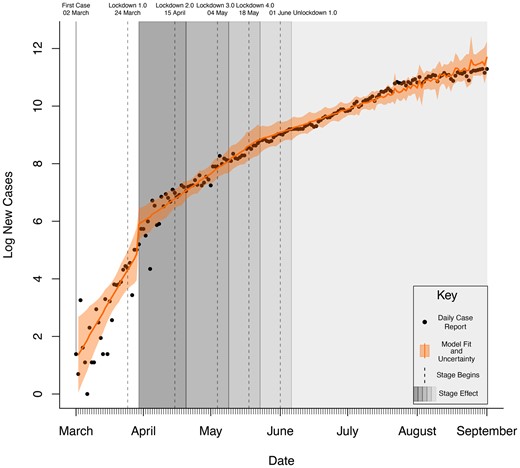
Daily reported incident COVID-19 cases in India with final fitted model results and uncertainty (95% CI).
The Dickey–Fuller test showed that the incident case data are non-stationary (Augmented Dickey-Fuller [ADF] test = 0.02, P = 0.99). To test the model assumptions of residual independence, a partial autocorrelation function (see Supplementary File S1) was calculated. Residual autocorrelation was present at lag 10, suggesting a cyclic 10-day trend in the model errors not fully accounted for by the model. Evidence of non-stationarity was not present in the selected model residuals judging by the autocorrelation function and partial autocorrelation function plots. A Ljung–Box test conducted on the model residuals showed no significant autocorrelation (χ2 = 0.01, df = 1, P-value = 0.79).
Discussion
Our study evaluated the impact of lockdown policy on reported daily incident cases of COVID-19 in India. The findings indicate a significant reduction in the rate of increase in new COVID-19 cases during Lockdown 1.0 and then Lockdown 4.0, with no significant rebound increase in this rate during the subsequent easing of the lockdown policy. Additionally, other than Lockdown 1.0, there was no significant increase in the level of COVID-19 incidence. This suggests that the number of reported incident cases has not returned to the pre-Lockdown trend or the exponential growth pattern associated with the spread of COVID-19 sans prophylactic measures.
Mobility data aggregated by Google supported the notion that this reduction may be associated with proper uptake of the lockdown policy. We observe that the mitigation of the trend in incident COVID-19 cases corresponds temporally with a reduction in non-residential mobility associated with retail and recreation, parks, grocery and pharmacy, work and transit travel, as categorized by Google (Google LLC, 2020). Among the six reported activities—grocery and pharmacy reverted almost back to the baseline mobility during Unlockdown 1.0, whereas the other five activities did not show a full return to baseline.
We monitored changes in the number of new cases reported by the MoHFW, Government of India in response to ongoing COVID-19 control efforts that include interventions to reduce physical movement and increased testing, tracing and isolation of cases and their contacts. The substantially large decline in the trend of daily incidence that occurred after Lockdown 1.0 may be due to more vigorous enforcement of lockdown measures during this stage than in subsequent stages. The Oxford COVID-19 Government Response Tracker to measure the strictness of the lockdown imposed gave the highest score (100) to India’s Lockdown 1.0 (University of Oxford, 2020).
Our findings also indicate a rapid change in public behaviour reflected in the swift reduction of mobility a few days before the official announcement of Lockdown 1.0. The increase in enforcement occurred subsequent to the mass media efforts encouraging people to stay home with restricted movement. This behaviour change may have allowed a substantially faster reduction in movement and a significantly slower increase in incidence rate than would have been possible with only enforcement. However, in subsequent stages of lockdown, the mobility reduction and strength of enforcement might not have been adequate for a similarly substantial reduction in the rate of pandemic progression. Available reports also indicate this change in the policy of the Indian Government after Lockdown 1.0 and subsequent increase in movement to provide much-needed assistance to more vulnerable groups, including migrant labourers and other workers involved in the large informal sector prevalent in India (Sharma, 2020).
Most countries with rising COVID-19 infections implemented movement restriction policies in an attempt to flatten the curve by reducing the rate of new infections. These findings concur with studies evaluating lockdown policies in China (Davies et al., 2020; Prem et al., 2020), Iran, Italy, South Korea and Japan (Davies et al., 2020). Our study also supports the evidence based on the association between lockdown policies with a reduction in mobility and slower pandemic progression. Furthermore, several studies also indicate the need for these social distancing measures to be strictly implemented and sustained for prolonged periods (Jiang and Luo, 2020; Dong et al., 2020).
The COVID-19 pandemic poses uniquely difficult questions for governments and public health authorities in LMICs (Baru, 2020). Because of the explosive nature of the spread and extraordinary uncertainties about how the virus behaves, the rationale of severe restrictions on movement and liberty, considering its beneficial effect on the health sector, should also be critically discussed in relation to other affected sectors (Bernstein et al., 2020). Though, out of the scope of our present study, in the context of LMICs like India, it is crucial to understand people’s willingness to follow such orders, the limits of police enforcement, uncertainty on how illness can be treated, and the economic and social trade-offs that result when people are forced to stay home (Xafis et al., 2020).
The strength of our study includes a robust analysis of publicly available data to provide a real-time evaluation of lockdown measures implemented by a large and diverse LMIC like India. The use of automated mobility data to compare with changes in the rate of new cases also provides an important tool to combine findings from two different data sources. The use of interrupted time series provides a robust observational design to evaluate the effect of potentially life-saving interventions that cannot be randomized.
Limitations of this study include the quasi-experimental design and reliance on reported incident COVID-19 cases. We did not include a comparison group or estimate a counterfactual number of cases that would have occurred without the policy. It is also difficult to fully account for all national and subnational policy changes implemented between 2 March and 20 June 2020. These include biases related to efforts at scale-up of testing, increasing awareness of the disease by health professionals and the public, and changes to the diagnostic criteria (Dong et al., 2020; Prem et al., 2020).
The Indian Council for Medical Research (ICMR) oversaw the rapid scale-up of the testing capacity from an average of 1000 tests per day around 23 March 2020, to an average of 200 000 per day around 23 June 2020, with the test positivity rate below 8% in this duration (Indian Council for Medical Research (ICMR), 2020). ICMR also prescribed a standardized testing protocol and developed a centralized reporting portal, thereby contributing to the reliability and validity of the data used for this study. However, it is difficult to fully account for all the biases that might have impacted the COVID-19 incidence rate in India in ways not related to the Lockdown policy.
Besides, a high proportion of the Indian population uses internet services through their wireless phones. At the end of March 2019, there were 1161.81 million wireless subscribers in India, with an overall teledensity of 90.11% (Telecom Regulatory Authority of India, 2019). Android (google based) market penetration was predominant, with 637.73 million internet subscribers (DeviceAtlas, 2019). Despite this high penetration, it is vital to consider the limitations in the mobility data, including that location history sharing is an opt-in service, meaning data is only collected from devices where a user has logged into a Google account and changed their default setting from off to on (Google LLC, 2020). Besides, the data are aggregated into categories without precise documentation of how this aggregation is performed. This may have a qualitative impact on the meaning of these results depending on the exact locations included in categories, such as grocery and pharmacy, given that health system disruptions may have indirect effects on health outcomes (Roberton et al., 2020).
These results are observational, meaning that we see a reduction in the increase in incidence rate per day after Lockdowns 1.0 and 4.0, but we do not estimate what would have happened without the reduction in mobility that corresponded to the policy. Possible methods to do this include creating a synthetic control using simulation methods with data from other countries. Another limitation of this model is that it does not account for changes in the number of persons at risk based on immunity conferred from infection or any other changes, as would a Markov-based model. Furthermore, this model is based on case reports aggregated to the national level, but individual regions and states may reveal a more nuanced story of the effect of the lockdown policy.
Thus, we recommend further studies that should explore the different trajectories of pandemic progression within each state and for different regions and vulnerable groups with the population, including disaggregation by age, gender, race, ethnicity, education status, occupation and socioeconomic status. Also, different outcome measures should be explored, including the death rate due to COVID-19 among those documented to be exposed and also not exposed, and deaths due to other causes of illness.
Conclusion
Our results suggest that the lockdown policies helped reduce the daily rate of increase in new COVID-19 cases in India and represent an effective way to slow COVID-19 transmission. Even after the restrictions were eased, this effect was consistent, suggesting that the policy helped to ‘flatten the curve’ and buy additional time for pandemic preparedness, response and recovery. However, beyond the health sector, significant uncertainties exist around the trade-offs related to lockdowns’ economic, psychological and social impact on the population.
Data availability
The study review is based on secondary data. The data underlying this article are available on MoHFW of the Government of India’s website. The datasets were derived from sources in the public domain, which can be accessed at https://www.mohfw.gov.in/. The software code used to analyse the data of this article will be shared on a reasonable request to the corresponding author.
Supplementary data
Supplementary data are available at Health Policy and Planning online.
Acknowledgements
No funding was available for this study. However, we are immensely grateful to the Ministry of Health and Family Welfare (MoHFW) of the Government of India for making the data publicly available, which made this analysis possible.
Conflict of interest statement. None declared.
Ethical approval. No ethical approval was required for this study.
References
Dong E, Du H, Gardner L.
