


Abstract
This article demonstrates the utility of combining individual survey data with social media content data in order to analyze how social context predicts individual behavior. The lack of valid and reliable measures of the contexts of social interaction in which individuals are embedded has remained an Achilles heel of the survey method. The reason is that the collection of direct observation of social interaction requires qualitative analysis of the context, which, hitherto, has been too costly to collect on a large scale. Instead, researchers have resorted to indirect measures such as aggregate group composition, respondent reports of social context, and institutional accounts. However, with the recent advent of social media data, contemporary social scientists now have social interaction data on an unprecedented scale. To utilize these data for quantitative analysis, researchers have to transform text prose into good measurement. We combine qualitative content analysis and supervised machine learning in order to ensure both semantic validity and accuracy in our measure of social interaction in Facebook groups. To test the substantive performance of the direct measures of social interaction, we use it to predict individual participation in refugee solidarity activism in Denmark. Additional testing indicates that the direct measure cannot easily be replaced by indirect measures of social interaction derived from group composition and institutional accounts. We also show how contexts and individual respondents can be effectively sampled using Facebook groups. Finally, the article discusses the limitations of social media data and points to alternate settings where our design is applicable.
Can Social Media Data Replace or Complement Survey Data?
Social media content data have emerged as an alternative or supplement to survey data. Some scholars have argued that social media data can replace surveys (Savage and Burrows 2009; Mayer-Schónberger and Cukier 2013), providing large N and continuous measurement at a low cost (Golder and Macy 2014; Ceron, Curini, and Iacus 2015). However, despite some early studies finding a relatively strong correlation between surveys and social media analysis, recent scholarship shows that these relations are not necessarily robust over time. As Conrad et al. (2019) argue, it is implausible to always expect similar results, particularly as demographic characteristics can differ enormously across survey and social media populations and the stimuli conditions vary dramatically. With surveys, we know the population, what questions participants are answering, and under what conditions. In contrast, with social media, we have no such certainty. In short, there is little evidence to suggest that we can straightforwardly replace expensive surveys with analyses of low-cost social media data.
Another way of characterizing the difference between survey and social media data is that surveys measure individual attributes and attitudes while social media captures the symbolic environments, social relations, and events that actors are embedded in and respond to (Ruppert, Law, and Savage 2013). From this vantage point, social media content data’s strength is to measure the social context that individuals navigate. James Coleman (1958; see also Cicourel 1964; Barton 1968) noted long ago that surveys treat individuals as though they existed outside any context of social interaction, and many attempts across the social sciences, including from Coleman himself, have been made to bring “social context” back in (Katz and Lazarsfeld, 1955; Barton 1968; Weatherford 1982; Granovetter 1985).
This paper argues and demonstrates that social media content data can provide a fruitful alternative data source on social context that with great benefit can be combined with survey data in order to understand how social context relates to individual behavior. We illustrate the benefits of our design with a study of how contentious interactions within activist Facebook groups predict individual likelihood of political participation. In contrast to the dominant approaches measuring social context indirectly with proxies, the method proposed in this study directly measures social context using content data from Facebook groups. These groups were also used to sample respondents for a survey. Thus, the paper argues that social media provides both a rich and useful source of social context data as well as a practical sampling frame for generating multilevel survey datasets.
Ways of Measuring the Social Context of Political Behavior
Contextual influences can refer to many different phenomena. In this paper, we are interested in measuring an important subset of those typically captured under general terms, such as discussion networks (Marsden 1987; McLeod et al. 1999) or small groups (Olson 1965), which in political sociology and civil society studies are often specified as civic, activist, or grassroots groups (Gundelach 1979; Eliasoph and Lichterman 2003; Blee 2012). What they all refer to is the interactional context composed of recurrent communication patterns between individuals in a group which we, in short, will refer to as social interaction (Leighley 1990; Mcclurg 2003). There are four overall ways of measuring social interaction:
Compositional Measures
Compositional measures aggregate individual attributes within a bounded setting, such as a neighborhood, workplace, or organization (Huckfeldt 1979; Ibsen, Toubøl, and Jensen 2017; Lipset, Trow, and Coleman 1956). This measure of social context is indirect because it infers what is being said or done from who is present in the setting. As a measure of social interaction, it rests on two rather strong assumptions: First, that group-level composition describes the actual social networks of individuals, and second, that the composition of individuals determines the content of interaction. The first assumption seems more and more unlikely the larger the setting is, because within them individuals are more likely to opt for social relations or smaller settings with a different composition. The second assumption is inconsistent with theories of social interaction (Rawls 1987; Fine 2012), which argue that it is problematic to assume that the individual level determines the interactional level.
Respondent Reports
Respondent reports of social interaction use survey questions that ask the individual respondents about the content of social interaction (Weatherford 1982; Leighley 1990). For instance, the US National Election Survey’s “Do you ever discuss politics with your family or friends?” attempts to measure actual content of social interaction in this way. Consequently, inference shifts from who people are with to what respondents say is going on in interactions. The limitations of self-reported data on social interaction have long been known. As Allen H. Barton remarks, respondents “may not accurately perceive it, or they may not be conscious of characteristics of the context which actually influence them” (1968, p. 2). These observations are supported by research on the attitude-behavior gap (Jerolmack and Khan 2014) and social desirability bias (Kreuter, Presser, and Tourangeau 2008; Hariri and Lassen 2017), shown to influence self-reported voting behavior (e.g., Dahlgaard et al. 2019). Thus, it is questionable if survey responses can be used to reliably infer the content of social interaction.
Institutional Accounts
Policies, bylaws, newsletters, and other organizational documents can be used to measure the rules and/or ideologies that govern interaction in a given community. This approach to measuring social interaction has been applied to a wide range of communities, ranging from countries (Esping-Andersen 1990) to social movement organizations (Snow et al. 1986). In the latter case, of particular relevance to the case of this study, organizational documents or elite statements are used to derive the frames of interpretations that guide the coordination of collective action (Snow and Benford 1988). This approach assumes that organizational documents or elite statements capture the interaction of the movement’s rank-and-file members. The approach has been criticized for “elite bias” (Benford 1997), a concern supported by ethnographic findings that document a high variation in patterns of interaction in groups with similar institutional frames (Eliasoph and Lichterman 2003).
Direct Observation
Ethnographies and other methods of direct observation of political participation (Mansbridge 1983; Snow et al. 1986; Eliasoph 1998; Lichtermand and Eliasoph 2014; Pacewicz 2016) have the obvious advantage that they do not rely on indirect measures (Jerolmack and Khan 2014). Who interacts with whom and the content of the interaction is readily available to the analyst. The inferential challenge is to map observed interaction into more abstract categories, requiring the researcher to learn how symbols are used within the given context in order to ensure semantic validity (Lichterman 2017). However, in situ interaction is ephemeral, demanding an analyst to be present in the actual setting to gather data, and hitherto, large-scale direct observation of social interaction has been almost impossible to generate, due to pragmatic constraints rendering it infeasible to combine and integrate methods that directly observe interaction with large-scale surveys.
Observing Interaction Through Social Media
The limitations to obtaining direct observation measures change when social interaction is mediated through social media platforms. Social media infrastructures typically record all interactions, the user ID of those interacting, and the content of the interaction. This means that large amounts of interactional data can be collected and coupled to specific social media users and groups including political activist groups. A crucial challenge, well known from the ethnography, concerns that social media content has to be understood in its context, as demonstrated by Whitney Philips’s study of trolling behavior (Philips 2011). Furthermore, data overload represents an additional challenge. Many social media datasets have very large amounts of relational and textual data. To overcome this challenge, researchers have developed computational methods for automated text classification (Grimmer and Stewart 2013; Evans and Aceves 2016). We will later explain how precisely we think computational content analysis can produce valid and reliable measures of the content of social interaction.
The paper is structured by two overall analytical steps: The first is the process of collecting observational and survey data from individuals within the same context. The second is applying the measure of interactional context derived from social media as predictor of extra-institutional political participation as reported in the survey. The next section concerns the first step, which involves a) sampling and gathering data on Facebook groups relevant to our research questions, b) recruiting individual activists through announcements within different Facebook groups, and c) collecting content data and transforming them into measures of the within-group interaction by means of supervised machine learning (SML). The subsequent section focuses on the second analytical step, measurement and statistical analysis, and the final section provides a summary and critical appraisal of the methods we used, their implications, and limitations.
Combining Survey and Social Media Measures of Interaction Context
Our method of combining individual-level survey data with observational data on social interaction was developed in relation to an ongoing research project on the Danish mobilization of refugee solidarity activism that started in 2014 and reached its peak in 2015 (Toubøl 2017; Carlsen 2019). Refugee solidarity activism is composed of two different types of activism: One is humanitarian, focusing on aid, relief action, and ensuring the psychological and social well-being of refugees. A second is contentious, aiming to alter or undermine antirefugee policies through protests, petitions, and civil disobedience. The substantive analysis that we use to argue for the benefit of using social media as a measure of social interaction asks whether refugee activist groups influence which type of activism the actors engaged in. The guiding hypothesis is that, in group contexts characterized by a high level of politically contentious social interaction, the individual activists will have a higher likelihood of participation in contentious activities as opposed to noncontentious humanitarian activities (Carlsen, Toubøl, and Ralund 2021). Testing this hypothesis demands that we both collect data on the content of social interaction in the different activist groups and individual activists’ patterns of participation in activism. To do this, we exploited the fact that the 2015 wave of refugee activism took place to a great extent on Facebook: activists used Facebook groups as their intranet to recruit, coordinate collective action events, socialize, tell stories, comment on relevant events, and share information.
Facebook’s centrality to the movement organizations made the social media platform useful for data collection in two ways: 1) as a sample frame used to sample social movement groups and individuals, and 2) as a source of social media content data. The online survey collected data on individual demographics, prior and present political participation, and inner states. At low cost, it was distributed on Facebook to nearly all the refugee solidarity groups and pages on Facebook.
Sampling Social Contexts of Ephemeral Populations
In order to estimate the correlation between social context and individual-level behavior, a precondition is to obtain a sample of individuals in the very context in which we are interested. This has proven to be a challenge to students of political behavior. This is particularly true for the study of the ephemeral populations of extra-institutional political behavior (Kapiszewski, MacLean, and Read 2015, p. 290). Social movement activists are notoriously hard to reach because of the lack of systematic membership lists. Moreover, mobilizations fluctuate in response to events and their timing is therefore hard to predict (Salganik 2018).
This was also the case in the 2015 mobilization of the Danish refugee solidarity movement. Figure 1 depicts the explosive mobilization that took place in September 2015, when the so-called “European Refugee Crisis” came to encompass Denmark and tens of thousands of refugees crossed the borders in a highly unregulated manner, motivating a massive mobilization of solidarity activism. The figure shows the proportion of all newcomers who were active for the first time in a given month (dark-gray line), the share of leavers active for the last time in a given month (black line), and the share of active members compared to the whole movement (light-gray line) over time. This graph clearly shows that this movement's population is highly ephemeral, with a very small part of the population being active in any given month and with many activists leaving and entering the movement in different periods. The ephemeral character of the population makes sampling difficult, but, as we shall argue below, social media constitutes a useful frame for better sampling such ephemeral populations.
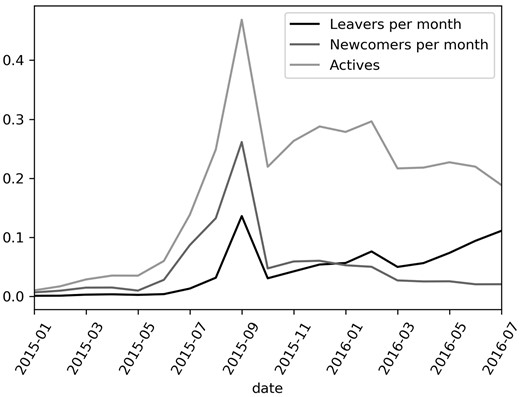
Active, new, and leaving members’ share of total movement population per month, January 2015–July 2016.
We wanted to conduct a survey covering all relevant Facebook contexts in the form of groups used for organizing collective action. To accomplish this, we identified groups using a keyword search including common terms among the known organizations and groups in the movement (keywords are listed in footnote 1 of Supplementary Material A). The selection of keywords was informed by prior fieldwork in the movement spanning more than a year, including 42 qualitative interviews with activists from a wide array of networks and groups in the movement as well as online ethnography.
In total, 165 relevant groups were identified. One of the authors then became a member of each group and contacted the group administrator to ask for permissions to post the survey invitation letter in the group. Seven administrators objected and the survey was not posted. The survey invitation was also not posted in eight groups that were either quite small or were subgroups of other groups (e.g., the steering committee for a larger group). In the end, 150 (91 percent) of the identified groups participated.
Recruiting Individual Activists in Contexts
After securing the participation of 150 grassroots groups, the second step was to sample individuals. Due to the impracticability of obtaining “friendship” and subsequently communicating individually with 100,000+ Facebook user profiles, the only feasible option available was convenience cluster sampling recruited via announcements. A post was distributed to all groups inviting members to participate by following a link to the online survey hosted on a secure server at the University of Copenhagen. The post briefly explained the purpose of the research project and the content of the survey. In addition it stressed that a high level of activity, or even any, was not a requirement for participating in order to avoid selection bias toward highly active members. While this strategy seemed successful in terms of obtaining high variation in level and spread of participation in activism, we still suspect that the sample is biased toward highly active members. We chose a web-based self-administered survey mode that has been shown to reduce social desirability effects (Kreuter, Presser, and Tourangeau 2008), because the survey asked sensitive and controversial questions (e.g., if the respondents participated in illegal activities such as assisting refugees going underground). In summary, this design enabled us to obtain a large sample during the two-month data collection period detailed in the following section.
Figure 2 depicts the accumulation of valid responses (solid line) and groups with different thresholds of numbers of valid responses (broken lines). Between May 24 and 31, 2016, the survey was posted in the identified groups as well as on pages affiliated with the movement. The questionnaire contained 51 question pages, some of which contained question batteries, and the median completion time was 22 minutes with quartiles 18 and 28 minutes (the questionnaire is available in Supplementary Material G). Despite the questionnaire being quite long for an online survey, the responses quickly accumulated; before the first reminders were posted on June 2 (first dropline in figure 2), 1,173 valid responses had been provided and 60 groups had over five responses. On June 29 a second reminder was posted, sparking a steep increase in participation taking the total number of valid responses, 1,931, to the final count of 2,289, with the last response being given on July 28. However, from July 5 (2,214 valid responses) onward, only a few responses were submitted on a daily basis and, with regard to the group count, no more reached the threshold of 6 responses after July 4, totaling groups with n > 5 at 107. Table 1 summarizes the final result of the data collection.
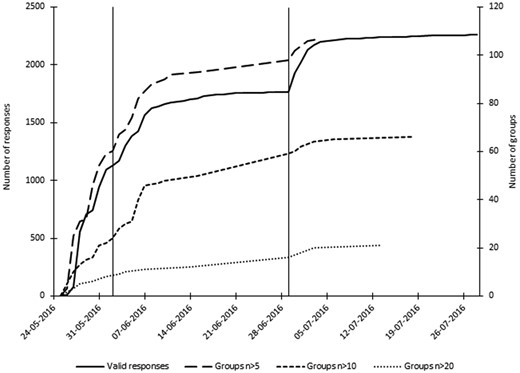
Accumulation of valid individual and group-level cases during data collection. Drop lines indicate posting of reminders. Data collection began on May 24, 2016.
Overview of data collection
| Level | Individual | Context |
|---|---|---|
| Population | All activists | All groups |
| Frame population | 28,304 | 165 |
| Response sample | 2,289 (8%) | 107 (65%) |
| Data source | Online survey | Social media content data |
| Level | Individual | Context |
|---|---|---|
| Population | All activists | All groups |
| Frame population | 28,304 | 165 |
| Response sample | 2,289 (8%) | 107 (65%) |
| Data source | Online survey | Social media content data |
Note.—Survey data were collected from May 24 to July 28, 2016.
An important challenge is the accurate assignment of individuals to the group that is most relevant to their activism. To this end, two techniques were devised: First, each survey link was unique to the group or page it was posted on, thus enabling automatic assignment of the respondents to a group. However, due to activists with multiple group memberships and circulation of the links, this procedure alone would likely result in false assignments. Furthermore, unique survey links were also posted on Facebook pages (137 in total) but we suspected that only rarely would pages reflect the relevant social context since they were mainly used for one-way communication by NGOs and professionalized SMOs. Therefore, we devised a second check, a survey item asking if the group or page of the link used to access the survey was the primary group of the activist in relation to the refugee solidarity activism and, if not, asking the respondent to provide the name of the correct group. Of the total of 2,289 valid respondents, 583 corrected their group affiliation.
Finally, we sought to assess the representativeness of the sample relative to the frame population of all 28,304 Facebook users who were active in the sampled groups during the data collection. We developed two individual measures based on social media data comparable to the relevant survey items: individual gender based on automated name recognition, and political attitude based on the group members’ “like” history of public party-affiliated pages (proven to be a highly reliable measure of political party preference by Kristensen et al. 2017). Gender is a standard measure when it comes to sample representativeness, and of particular relevance to this case of a movement with a repertoire dominated by humanitarian activities known to influence recruitment in terms of gender (e.g., Rotolo and Wilson 2007). In addition, political attitude is of particular relevance to this study, as we are dealing with political activism. Thus, despite many more measures such as education, age, occupation, and geography being relevant, these two measures’ centrality to the substantive research problem at hand makes the test meaningful.
Coding names by gender presents a challenge since some names are not exclusive to one or the other of the binary genders. In addition, names may be in languages not known to the classifier. In total, 13.2 percent of the names could not be classified for these reasons. Of the remaining members of the frame population, 75.5 percent are women (in name at least). The movement principally being made up of women is reflected by the sample being 84.3 percent women. This is, however, a significantly higher proportion, implying that the sample overrepresents women.
The survey did not measure political attitude by political party voting intent or preference but by self-placement on a political left-right scale. We therefore converted individuals’ party likes on Facebook to a position on a left-right scale. We did this by calculating factors expressing the relative association between political party and placement on the scale using a sample of 2,994 valid respondents from the 2017 round of the European Value Survey, Denmark (Frederiksen 2019), asking about both party preference and self-placement on a left-right scale. We are fully aware that the multidimensional information of individual party preference is not readily transferable to the one-dimensional space of a left-right scale, and this implies a massive reduction of complexity as well as loss of information. On the other hand, the correlation between party preference and position on the political scale (not shown) places the parties as one would expect in accordance with common wisdom of Danish politics, suggesting that the operation is meaningful. In addition, we only use this method to estimate political attitudes on the aggregate level of groups and the frame population and not at the individual level where the reliability is questionable.
Figure 3 shows the distributions of the movement’s Facebook population and the survey sample on a political left-right scale. Means (variance) are 4.159 (σ = 2.205) and 3.899 (σ = 2.137), respectively, and both means and variances differ significantly according to z-, t- and F-tests. Thus, the survey sample is significantly more left-leaning and more homogeneous than the Facebook population. However, the difference in means is only 0.26 on the 10-point scale which, in substantive terms, is a very modest difference. The same can also be said for the difference in variance. Thus, the two indicators suggest that online self-selected convenience sampling can produce response samples that are not extremely biased. The next step is to develop a measure of social interaction from the Facebook groups’ content data.
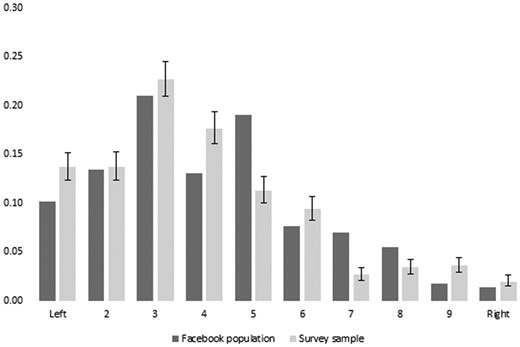
Distribution on political left-right scale of Facebook population and survey sample (with 95% confidence intervals).
Collecting Content Data and Transforming them into Measures of the Within-Group Interaction
We collected 643,636 documents (posts and comments) from 119 Facebook groups through the Facebook API (this type of data collection is not possible through the Facebook API anymore). These content data on social interaction in the Facebook groups were linked with the survey data at the group level, enabling us to create measures of within-group interaction. The survey did not ask for the respondents' Facebook ID, only their affiliation to their primary movement Facebook group, and therefore, we cannot link the respondents to their individual Facebook activity.
The content dataset of 643,636 documents were impossible to code manually. To overcome this challenge, we use supervised machine learning (SML), where a model is trained and tested on a human-annotated dataset and then used to classify the full population of documents (Evans and Aceves 2016). SML has the advantage over other computational text methods in that it has explicit metrics that are both used to train the model and evaluate the model’s ability to reproduce the human annotations. Scholars can then evaluate the model’s precision, accuracy, and recall before using the classification as measurement. Yet, it does not seem suitable for many social science applications to simply take human annotation as an unproblematic ground truth, as is common in computer science (DiMaggio 2015). One cannot assume that any human can understand the language used within a specific setting, and least of all to be able to map these onto our theoretical categories of interest (Malinowski 1994; Lichterman 2017). Human coders have to learn, through immersion and extensive exposure, how language is used within a given social context. In the following, we will go into greater depth on how we classified our documents, our machine learning model’s features, and its performance.
To ensure that our coders and our categories were appropriate, we first undertook a qualitative analysis of the social media content. This included a broad reading across the many Facebook groups and an in-depth reading of specific groups. After a phase of learning and discovery, we settled upon the definition of a contentious statement as any statement having an implicit or explicit adversary to the refugee cause. With this definition, we coded a random sample of 12,500 posts and comments. We coded these in context of the other messages to ensure that the statements were properly understood. Furthermore, the texts were presented in chronological order to ensure that the researcher could keep track of relevant events that might inform the understanding of the content.
The 12,500 messages were then divided into 75 percent for training our machine learning model and 25 percent for testing it. The relatively large set of labeled documents was needed in order to handle a general challenge for model training: the rarity of the category of interest. Besides this, we also constructed some features that countered the problem of words that are rare or nonexistent in the training data (a full description of this procedure can be found in Supplementary Material A).
The final classifier performed well on various measures. The classifier has an Area Under the Curve score of 0.941, an accuracy of 0.965, precision of 0.910, and performs substantially better than standard baseline models in text classification (see Supplementary Material A). One worrying feature of the model is its low recall of 0.590 (the classifier was able to find 59 percent of the contentious statements in the test dataset.1 To evaluate potential bias due to the recall rate, we ran a sensitivity analysis changing the decision boundary to obtain a higher recall. The results are robust to a level of 0.90 recall (see Supplementary Material A).
Satisfied with the performance on the test data, we used the classifier to label the full social media dataset (640,000+ posts and comments). This resulted in a dataset where we had individual-level data on the timing, group, and contentiousness of communication. But because we could only couple the survey and social media data on a group level, we discarded the individual-level information. The final contentious interaction variable was the proportion of contentious statements within each group during October and November 2015, weighted by the total number of statements per month in the groups. The contentious interaction variable ranges from 0 to 1. With a low mean (0.046) and standard deviation (0.031), it is clear that it is concentrated on the lower end, around 0.05.
Privacy and Ethics
Various concerns with privacy and ethics need to be addressed in greater depth when working with social media data where, in many cases, informed consent is impossible to obtain. Following the Association of Internet Research and leading researchers within the field of digital social research (Salganik 2018), we were guided by the principle of contextual integrity, where the focus is on researchers respecting the appropriate flow of information as it is conceived in the field site. In this regard, it is important that one of the authors is a known researcher of the movement who continually communicates with movement members. To the best of our knowledge, we have respected the informational concerns of the movement members. The Facebook groups were in many cases very large in size and directed toward both mobilizing from and communicating with the wider public (either national or local), and hence were not conceived as private spaces for confidential communication. That said, the distinction between private and public on social media is hard to determine, and we therefore do not treat the data as public data and limit our direct citation and circulation of the data to the absolute minimum. Furthermore, data were pseudonymized and stored on a high-security server at the University of Copenhagen.
Social Interaction Predicting Participation
The integration of our individual-level survey and group-level measure of contention allows us to model the relation between contentious group interaction and individual-level participation. Our theory was that degree of contention within groups had an effect on individual chance of engaging in political protest—independent of organizational frame and individual-level characteristics (Carlsen, Toubøl, and Ralund 2021). However, in this paper we focus on the methodological innovations of the design, specifically how much our measure of social context matters for predicting differential participation.
The dependent variable counts the number of contentious activities the respondent has reported participating in, including activities such as petitioning, demonstrating, and civil disobedience (see Supplementary Material B). Seven different activities were recorded but, in order to avoid very small counts in the higher categories, we recoded the variable into 0–4. As this was a count variable and the design inquires about a group-level factor’s influence on an individual-level outcome, the straightforward model specification would be a multilevel Poisson regression model.
In order to test our claim that our direct measure of social interaction is both valid and superior to indirect measures, we need to be able to assess the contribution of different measures in terms of variance explained. Due to the inherent difficulties of estimating R2 in multilevel and Poisson regression models (Snijders and Bosker 2012), we use OLS models. This implies less precise estimates of the variable relationships. However, comparing the resulting parameters with a multilevel Poisson regression model revealed no alarming differences in terms of direction, size, and significance of the parameters (see Supplementary Material C). Since the question of analyzing the underlying social processes of the observed correlations and their theoretical explanations is beyond the scope of the present study and for the sake of clarity of argument (see Carlsen, Toubøl, and Ralund 2021 for a related analysis of these questions using the same data), in the following we focus on the variables’ main effects and their contribution to the overall level of explained variance.
Table 2 summarizes the included variables (see Supplementary Material E for details on variable constructions) in the five models presented in table 3, allowing us to assess the contribution of the interaction variable measured by R2. Common to cross-sectional survey designs, selection effects must be considered. In our case, individuals predisposed for political protest joining the same groups while avoiding others could explain the observed correlations between contentious interactional contexts and participation in contentious activities. We attempt to control for such selection effects by including an extensive set of variables.2 However, despite this comprehensive list of controls, in a cross-sectional survey study, we cannot fully exclude the possibility of selection effects causing the observed correlations.
Summary of variables included in statistical models
| Variable (type) | n | Mean | S.D. | Min. | Max. |
|---|---|---|---|---|---|
| Political protest (scale) | 1,364 | 0.860 | 0.945 | 0 | 4 |
| Contentiousness of social interaction (scale) | 1,364 | 0.048 | 0.046 | 0 | 1 |
| Contentious framing (binary) | 1,364 | 1.025 | 0.156 | 0 | 1 |
| Personal network (scale) | 1,364 | 0.885 | 0.913 | 0 | 2 |
| Organizational network (binary) | 1,364 | 0.061 | 0.239 | 0 | 1 |
| Political civil society embeddedness (scale) | 1,364 | 4.228 | 1.688 | 0 | 9 |
| Nonpolitical civil society embeddedness (scale) | 1,364 | 3.850 | 2.044 | 0 | 9 |
| Emotional response (scale) | 1,364 | 3.463 | 0.975 | 0 | 4 |
| Income (scale) | 1,364 | 3.002 | 1.154 | 1 | 5 |
| Worktime (scale) | 1,364 | 1.816 | 1.596 | 0 | 5 |
| Highest level of education (scale) | 1,364 | 4.127 | 0.958 | 1 | 5 |
| Degree of urbanization (scale) | 1,364 | 3.424 | 1.232 | 1 | 5 |
| Children in household (binary) | 1,364 | 0.460 | 0.499 | 0 | 1 |
| Age (scale) | 1,364 | 48.822 | 13.849 | 15 | 84 |
| Refugee (binary) | 1,364 | 1.970 | 0.171 | 1 | 2 |
| Active before September (binary) | 1,364 | 0.538 | 0.499 | 0 | 1 |
| Prior history of activism (scale) | 1,364 | 1.754 | 1.638 | 0 | 5 |
| Prior history of refugee activism (scale) | 1,364 | 0.877 | 1.313 | 0 | 5 |
| Self-transcendent values (scale) | 1,364 | 5.556 | 1.797 | 1 | 8 |
| Self-enhancement values (scale) | 1,364 | 3.669 | 1.483 | 1 | 7 |
| Political attitude (scale) | 1,364 | 2.117 | 0.893 | 1 | 4 |
| Frequency of church attendance (scale) | 1,364 | 1.013 | 1.127 | 0 | 4 |
| Occupation (nominal) | |||||
| Full time | 606 | 44 | – | – | – |
| Part time | 119 | 9 | – | – | – |
| Self employed | 118 | 9 | – | – | – |
| Student | 110 | 8 | – | – | – |
| Unemployed | 61 | 4 | – | – | – |
| Early retirement | 60 | 4 | – | – | – |
| Retired | 189 | 14 | – | – | – |
| Other | 101 | 7 | – | – | – |
| Gender (nominal) | |||||
| Female | 1,172 | 86 | – | – | – |
| Male | 185 | 14 | – | – | – |
| Identify as neither | 7 | 1 | – | – | – |
| Religion (nominal) | |||||
| Nonbeliever | 686 | 50 | – | – | – |
| Danish National Church | 594 | 44 | – | – | – |
| Islam | 22 | 2 | – | – | – |
| Other | 62 | 5 | – | – | – |
Note.—Supplementary Material E details how the variables were constructed.
Effect of contentious interaction context on participation in contentious activism (unstandardized ordinary least square regression estimates, N = 1,259)
| Covariatea | Model 1 | Model 2 | Model 3 | Model 4 | Model 5 | ||||||||||
|---|---|---|---|---|---|---|---|---|---|---|---|---|---|---|---|
| Coef. | S.E. | p−value | Coef. | S.E. | p−value | Coef. | S.E. | p−value | Coef. | S.E. | p−value | Coef. | S.E. | p−value | |
| Group level | |||||||||||||||
| Cont. social interaction | 8.258 | 0.819 | <0.001 | 4.525 | 0.817 | <0.001 | – | 4.886 | 0.806 | <0.001 | – | ||||
| Contentious framing | – | 0.488 | 0.187 | 0.009 | −0.695 | 0.186 | <0.001 | 0.467 | 0.185 | 0.012 | 0.691 | 0.184 | <0.001 | ||
| Individual level | |||||||||||||||
| Personal network | – | 0.025 | 0.026 | 0.335 | 0.032 | 0.027 | 0.232 | – | – | ||||||
| Organizational network | – | −0.049 | 0.099 | 0.618 | −0.089 | 0.100 | 0.374 | – | – | ||||||
| Political civil society embed. | – | 0.044 | 0.044 | 0.003 | 0.045 | 0.015 | 0.003 | 0.048 | 0.014 | 0.001 | 0.049 | 0.014 | 0.001 | ||
| Other civil society embed. | – | −0.009 | 0.012 | 0.452 | −0.010 | 0.012 | 0.409 | – | – | ||||||
| Active before September | – | 0.232 | 0.048 | <0.001 | 0.245 | 0.048 | <0.001 | 0.227 | 0.047 | <0.001 | 0.242 | 0.048 | <0.001 | ||
| History of activism | – | −0.089 | 0.020 | <0.001 | −0.096 | 0.020 | <0.001 | −0.086 | 0.019 | <0.001 | −0.094 | 0.020 | <0.001 | ||
| History of refugee activism | – | 0.149 | 0.025 | <0.001 | 0.159 | 0.025 | <0.001 | 0.152 | 0.025 | <0.001 | 0.163 | 0.025 | <0.001 | ||
| Emotional response | – | 0.152 | 0.025 | <0.001 | 0.154 | 0.026 | <0.001 | 0.146 | 0.025 | <0.001 | 0.148 | 0.026 | <0.001 | ||
| Self-transcendent values | – | 0.035 | 0.013 | 0.010 | 0.035 | 0.014 | 0.010 | 0.037 | 0.013 | 0.005 | 0.038 | 0.013 | 0.004 | ||
| Self-enhancement values | – | −0.044 | 0.017 | 0.009 | −0.039 | 0.017 | 0.024 | −0.044 | 0.016 | 0.006 | −0.036 | 0.016 | 0.024 | ||
| Political attitude | – | −0.150 | 0.029 | <0.001 | −0.155 | 0.029 | <0.001 | −0.140 | 0.028 | <0.001 | −0.144 | 0.029 | <0.001 | ||
| Constant | 0.484 | 0.046 | <0.001 | −1.569 | 0.531 | 0.003 | −1.705 | 0.537 | 0.002 | −0.796 | 0.251 | 0.002 | −0.980 | 0.253 | <0.001 |
| R2 | 7.49 | 28.83 | 27.05 | 27.46 | 25.31 | ||||||||||
| Log likelihood | −1671.09 | −1505.966 | −1521.554 | −1518.03 | −1536.367 | ||||||||||
| Degrees of freedom | 2 | 34 | 33 | 15 | 14 | ||||||||||
Note.—Dependent variable is scale from 0 to 4. Compared to table 2, the sample is smaller because only groups with more than 5 observations at the individual level are included in order to increase reliability of the estimated group level variable parameters.
aIn models 2 to 5 additional controls are not reported. Estimates of the covariates, excluded from this table, are reported in Supplementary Material D.
Model 1 of table 3 only contains the social interaction variable. In Model 2, we include all controls, both group level and individual level. Model 3 includes the same variables except the interaction variable. This tells us that the measure of social interactions alone accounts for 7.49 percent of the variation in participation in contentious activities. This is quite substantial compared to the 28.83 percent variation accounted for in Model 2 including all variables. However, Model 3 reveals that, when including all covariates, the direct effect of social interaction accounts for 1.78 percent variance. Model 4 is the most parsimonious model, only including significant estimates, and Model 5 is the same excluding social interaction, here accounting for 2.15 percent variation. Thus, while a substantial amount of the effect of social interaction variable is mediated or moderated by individual-level variables, contentious social interaction is still a substantial predictor of participation in contentious activism.
Contentious social interaction’s substantial contribution to the model’s overall fit is confirmed by the dominance analysis reported below in table 4. Dominance analysis allows us to assess the relative contribution of the covariates included in the parsimonious model (Azen and Budescu 2003; 2006). In this case, the general dominance statistic used to assess the relative contribution of each variable is the weighted average marginal contribution of each variable measured by the difference in R2 for models for all variable combinations. Table 4 summarizes the results. At the top we find contentious social interaction together with political attitude and emotional response being the most important predictors in terms of explaining the variance of contentious activism.
Dominance standardized ranking of covariates in parsimonious model 4 oftable 3
| Covariate | Dominance stat. | Stand. dom. stat. | Ranking |
|---|---|---|---|
| Contentious interactional context | 0,046 | 0,176 | 1 |
| Political attitude | 0,044 | 0,169 | 2 |
| Emotional response | 0,040 | 0,154 | 3 |
| Prior history of refugee activism | 0,030 | 0,118 | 4 |
| Active before September | 0,025 | 0,098 | 5 |
| Degree of urbanization | 0,025 | 0,096 | 6 |
| Political civil society embeddedness | 0,012 | 0,047 | 7 |
| Self-transcendent values | 0,012 | 0,045 | 8 |
| Contentious framing | 0,011 | 0,042 | 9 |
| Prior history of activism | 0,009 | 0,033 | 10 |
| Self-enhancement values | 0,006 | 0,023 | 11 |
Note.—Religion has been excluded despite being significant because Dominance Analysis cannot manage categorical variables.
Although other variables in the survey might be inferable from social media data, very important predictors of contentious activism are not. This points to the fruitfulness of combining social media and survey measures. Both variables measuring inner states (emotional response and value disposition) and participation in activism (contentious activities; the history of activism) could not be measured in a reliable manner on social media due to the risk of type 2 (false negative) measurement errors when this information is simply not reported on social media. Here the survey instrument appears to be the better choice.
Can we Replace Direct Measures of Interactional Context?
In continuation of the preceding discussion, a pressing question is whether direct measures of social interaction from social media could be replaced by indirect measures. These could be either compositional measures that use aggregate individual characteristics, self-reported measures that use survey questions on social context, or organizational accounts that document the rules and/or ideologies that govern interaction. With regard to the latter, this is included in the analysis above in the form of the framing variable measuring the extent to which the group’s self-description defines its purpose as contentious. This variable is indeed a significant predictor of participation, but its association is modest compared to the social interaction variable as expressed by both its coefficient and the general dominance statistic. The survey does not contain any survey questions on social context, barring us from testing this option.
In contrast, social media is ripe with compositional measures, allowing us to test if social interaction could be substituted with a less costly and more accessible measure. Based on the well-documented association between being politically left-leaning and participation in extra-institutional political activism (Hirsch 1990; Dalton 2013)—also present in our own analyses (see estimates of political attitude in Model 4, table 2)—we will test whether the political composition of the group members predicts and indeed could substitute the social media content measure of interactional context.3
Using the same method as in the representativity test, we derive a mean on a ten-point political left-right scale for each group based on the total “like” history of all group members being active in October–November 2015 (i.e., the same members whose in-group communication in the same period was the data source of the social interaction variable). The correlation between the groups’ average placement on the left-right scale and their level of contentious interaction is -0.402 (standard error= 0.202, p = 0.050), meaning that the more right-leaning, the less contentious interaction, as we would expect.
Finally, we scrutinize the group-level political composition variable’s association with individual-level participation in contentious activism. Table 5 reports three OLS models with participation in contentious activism ranging 0–4. In Model 1, which includes only political composition, the estimated correlation is insignificant and the variance explained miniscule. In Model 2, we include all variables from the parsimonious Model 4 in table 3, but we only report the estimates of variables of particular interest, namely the group-level variables and the individual-level variable of political attitude. Even though the coefficient of political composition is slightly larger and the standard error a little smaller, it remains insignificant (p = 0.087). In Model 3, we remove political composition (that is to say, it is the same as Model 4 of table 3), revealing that the R2 only decreases by 0.17, which renders Model 3’s fit insignificantly less good than Model 2. While not a general conclusion, in this case political composition would not be an acceptable indirect measure of the political culture of the grassroots groups, underlining the potential benefits of sampling and directly measuring interaction using social media content data.
Effect of political composition on participation in contentious participation (unstandardized ordinary least squares regression estimates, N = 1,259)
| Covariatea | Model 1 | Model 2 | Model 3 | ||||||
|---|---|---|---|---|---|---|---|---|---|
| Coef. | S.E. | p−value | Coef. | S.E. | p−value | Coef. | S.E. | p−value | |
| Group level | |||||||||
| Political composition | −0.618 | 0.490 | 0.207 | −0.764 | 0.446 | 0.087 | – | ||
| Cont. interactional context | – | 5.301 | 0.841 | <0.001 | 4.886 | 0.806 | <0.001 | ||
| Contentious framing | – | 0.393 | 0.190 | 0.039 | 0.467 | 0.185 | 0.012 | ||
| Individual level | |||||||||
| Political attitude | – | −0.140 | 0.028 | <0.001 | −0.140 | 0.028 | <0.001 | ||
| Constant | 1.007 | 0.116 | <0.001 | −0.546 | 0.291 | 0.061 | −0.796 | 0.251 | 0.002 |
| R2 | 0.13 | 27.63 | 27.46 | ||||||
| Log likelihood | −1719.291 | −1516.549 | −1518.03 | ||||||
| Degrees of freedom | 2 | 16 | 15 | ||||||
Note.—Dependent variable is a scale from 0 to 4. Compared to table 2, the sample is smaller because only groups with more than 5 observations at the individual level are included in order to increase reliability of the estimated group level variable parameters.
aIn model 2 and 3, additional controls are not reported. Model 3 is identical to model 4 of table 3, and the full list of estimates are available from model 4 of Supplementary Material D. Supplementary Material F reports the full list of estimates of Model 2.
Discussion: Limitations and Future Work
In this article, we have argued for the benefits of combining social media and survey data in our attempt to understand how the context of social interaction predicts extra-institutional political behavior. Social media content data provide a direct rather than indirect measure of the social interaction that individuals engage in and are exposed to. Second, social media platforms constitute sampling frames, which allows us to sample both individuals and contexts from ephemeral populations such as social movements, activism, and political protest. Using Facebook as a sampling frame of this hard-to-survey population, at low cost, we were able to gather valid responses from 2,289 (8 percent coverage) activists and social media content data from 119 social movement groups. Furthermore, we were able to obtain above five responses from 107 groups (65 percent coverage), which makes it possible to estimate robust multilevel models. By combining content analysis with SML, we annotated all communication within the groups, resulting in over 640,000 labeled documents. These could in turn be used to measure the degree of contentious interaction within the activists’ Facebook groups and in turn model its correlation with a measure of the individuals’ political participation. Degree of contentious interaction on Facebook turns out to be the variable that accounts for most variation in the dependent variable of self-reported individual-level participation in contentious activism. Furthermore, we test whether our direct measure of social interaction could be replaced by indirect measures of 1) the institutional accounts of the groups’ self-description of their purpose and activities, and 2) a compositional measure of aggregate individual political attitudes. This was, however, not the case for either indirect measure.
Our analyses and research design focused on measuring social context and less on estimating the effect of social context on political behavior. In our specific case, the survey data were cross-sectional and hence estimating how a change in social interaction changes individual-level participation was not possible. Extending the online survey to a panel survey could allow for determining causal relations between social interaction and individual participation, without greatly increasing research costs. Of course, a challenge is the unpredictable timing and duration of mobilizations, which requires some agility on the part of researchers in the data-collection process.
One pressing question is when, and when not, social media content data are a good measure of interaction. Researchers should ensure that there is a strong coupling between the social media content data and the specific social context they intend to study (Evans and Aceves 2016). In our case, the refugee solidarity movement used Facebook groups extensively for a wide range of tasks and the groups were the central sites of coordination and discussion, and so the coupling was relatively strong. Many other types of social networks (voluntary groups, friendship circles, university cohorts, and more) use Facebook groups for various purposes, and hence we believe the method can be applied to many other cases. But in each case, researchers will need to acquire in-depth knowledge of the cases’ use of social media in order to be able to evaluate in what respects they can expect a coupling between contexts of social interaction and individual-level measures.
Other social media platforms, such as Reddit and Twitter, allow for a similar coupling between survey data and social media content data—critical given Facebook’s recent restrictions to data collection. For instance, from Twitter, researchers can retrieve users’ networks and the posted content within these networks and thereby estimate individual users’ interactional contexts. Our approach could also be applied to cases beyond social media. Many organizations use intranet or email to communicate and coordinate action, which have already been shown to be fruitful data sources for analyzing patterns of communication’s consequences for individual-level outcomes (Goldberg et al. 2016).
Yet, it is clear that many social contexts are not sufficiently encoded into textual databases to allow for our research design to work, and thereby indirect measures of interaction will continue to be useful in many cases. Another important limitation is that the social contexts observed online can only influence online participants, implying that the findings cannot necessarily be generalized to, for instance, members of a movement who are not online. It would require supplementary case-specific research to assess whether the online interactional contexts reflect offline interactional contexts and thereby determine the transferability of findings observed online to offline settings.
It is also important to point out that our approach is not limited to social media convenience samples. For instance, in case of more institutionalized, stable, and population-wide political behavior, such as voting, it would make sense to use a national representative sample and ask respondents for their Twitter username or primary Facebook group and then supplement with a collection of the relevant social media content data. In addition, this would enable us to address some of the concerns regarding the transferability of online findings to offline contexts because users and nonusers of social media could be compared.
Finally, despite this study’s focus on how social media content data can enrich survey data, it also demonstrates the reverse logic. Many scholars have pointed to the problems of social media data: lack of demographic information seriously hampers inference due to unobservable population heterogeneity and, as Salganik (2018) argues, social media data tell us little of individuals’ inner states. In relation to the present study, the survey provides measures of inner states of values and emotions that figure prominently in the model. Social media data are also limited in regard to behavioral variables such as the dependent variable of participation in activism of the present study, due to the imminent risk of Type 2 measurement errors of false negatives. Even though social media users occasionally may self-report behavior like participation in activism online, this cannot be trusted to be done consistently. An additional advantage of the design is that all essential individual-level information is obtained from the survey where informed consent is easily obtained, while the social media data is treated on the aggregate group level. Future research should work out precisely how effective this coupling is to provide an alternative to collecting and storing individual-level data from digital traces. This is all the more relevant when studying issues around contentious politics where individual-level information can be misused by authorities.
Thus, in contrast to the early excitement around the potential of social media data to fully replace survey data, we agree with more moderate calls for exploring the potentials for cross-fertilization (Salganik 2018). This study contributes to this agenda by demonstrating how analysis of social media content data can address the longstanding problem of measuring how social context relates to individual-level survey outcome variables.
Data Availability Statement
REPLICATION DATA AND DOCUMENTATION are available at doi.org/10.17605/OSF.IO/EDM4S.
Supplementary Material
SUPPLEMENTARY MATERIAL may be found in the online version of this article: https://doi.org/10.1093/poq/nfab022.
Hjalmar Bang Carlsen is an assistant professor at SODAS and the Department of Sociology, University of Copenhagen, Copenhagen, Denmark. Jonas ToubØl is an assistant professor in the Department of Sociology, University of Copenhagen, Copenhagen, Denmark. Snorre Ralund is a postdoctoral research fellow at SODAS, University of Copenhagen, Copenhagen, Denmark. The authors are grateful to Peter Gundelach, Frederik Georg Hjorth, and David Dreyer Lassen for valuable comments along the way. An earlier version of this paper was presented at SODAS Data Discussion, and the authors thank the participants for supportive and constructive feedback. Research for this paper was supported by the Carlsberg Foundation as part of the project entitled Mobilization in the Era of Social Media: Introducing the Decisive Role of Group Level Factors [CF17-0199 to J.T.]
Footnotes
It should be noted that given the highly unbalanced classes, it would be very hard to reach a better performance than a recall of 0.59. But this is still problematic from the point of view of measurement.
The variables include: 1) history of activism measuring the respondents’ prior engagement in contentious activities like demonstrations, petitions, and more; 2) political attitude on a political left-right scale; 3) embeddedness in political civil society; 4) whether the respondent was an active member of the group before the mobilization in the fall of 2015 or became a member during the mobilization and therefore was not influenced by the group’s culture before the period considered in this study; and 5) whether the group’s description frames its activities and goals as contentious or not, which could function as a signal causing selection. In addition, we control for socio-demographic and -economic factors, beliefs, values, biographical availability, and emotional reactions.
It should be clear that since we use social media data to construct the compositional measure, we are simulating a hypothetical situation where such information was available for the total frame population in the form of register data from membership records or gathered with a saturated survey sample.
References
———.
