


Abstract
most older individuals who experience mobility decline, also show cognitive decline, but whether cognitive decline precedes or follows mobility limitation is not well understood.
examine the temporal sequence of mobility and cognition among initially unimpaired older adults.
mobility and cognition were assessed every 2 years for 6 years in 412 participants aged ≥60 with initially unimpaired cognition and gait speed. Using autoregressive models, accounting for the dependent variable from the prior assessment, baseline age, sex, body mass index and education, we examine the temporal sequence of change in mobility (6 m usual gait speed, 400 m fast walk time) and executive function (visuoperceptual speed: Digit Symbol Substitution Test (DSST); cognitive flexibility: Trail Making Test part B (TMT-B)) or memory (California Verbal Learning Test (CVLT) immediate, short-delay, long-delay).
there was a bidirectional relationship over time between slower usual gait speed and both poorer DSST and TMT-B scores (Bonferroni-corrected P < 0.005). In contrast, slower 400 m fast walk time predicted subsequent poorer DSST, TMT-B, CVLT immediate recall and CVLT short-delay scores (P < 0.005), while these measures did not predict subsequent 400 m fast walk time (P > 0.005).
among initially unimpaired older adults, the temporal relationship between usual gait speed and executive function is bidirectional, with each predicting change in the other, while poor fast walking performance predicts future executive function and memory changes but not vice versa. Challenging tasks like the 400 m walk appear superior to usual gait speed for predicting executive function and memory change in unimpaired older adults.
Introduction
Cognitive and mobility deficits are major contributors to late life disability, and are often related. Based on neuroimaging studies, age-related alterations in gait and cognitive function are associated with shared underlying structural changes in the prefrontal and medial temporal lobes, as well as increased burden of cerebrovascular lesions [1]. However, the relative temporal sequence of age-related changes in mobility and cognition remains controversial. If we were able to determine which measures of mobility or cognition change first during ageing, we might better focus our screening and intervention efforts. Knowledge about the sequence of events might also provide new insights into underlying causal pathways.
Cross-sectionally, slow gait is consistently associated with poor cognition, especially with executive function [2]. Unidirectional longitudinal studies suggest that poorer mobility is associated with greater declines in global cognitive function and executive function, as well as risk of cognitive impairment, Alzheimer's disease and dementia, and that poorer cognitive function, particularly global cognitive function and executive function, predicts a greater decline in mobility [3, 4].
Studies examining co-occurring longitudinal relationships between mobility and cognition have shown conflicting results. Three examined rates of change; two reported co-occurring changes [5, 6] while one found no relationship [7]. Among those that examined bidirectional relationships, some reported cognitive performance predicts mobility decline while mobility function does not predict cognitive decline [8, 9], while others suggested that mobility decline predicts cognitive decline but not vice versa [9, 10] and two reported bidirectional longitudinal relationships [11, 12]. These mixed results may be due to factors such as characteristics of participants, duration of follow-up and/or types of measures of mobility and cognition.
Here, we attempt to determine the sequence of cognitive and mobility changes over time by starting with an older adult sample without evidence of cognitive or mobility impairment. We measure change over multiple repeated visits, evaluate measures of mobility at usual and fast walking speed, and include multiple measures of cognition within two domains; (executive function and memory).
Methods
Study population
Participants were drawn from the Baltimore Longitudinal Study of Aging (BLSA), an ongoing prospective study of adults aged 20 and older [13]. Participants undergo testing at the National Institute on Aging's clinical research unit.
Because we wanted to focus on temporal sequences, we sought to create an initially unimpaired sample. Eligibility included aged 60 or older, initially unimpaired mobility and cognition, and repeated assessments of mobility and cognition at subsequent follow-up (details in Supplementary data, Appendix 1, available in Age and Ageing online). We defined unimpaired mobility as a usual gait speed of >0.8 meters/second and unimpaired cognitive function as score of >24 on the 30-point Mini-Mental State Exam [14], with no adjudicated cognitive impairment or dementia. Of 901 participants aged 60 and older who had concurrent assessments of the measures of interest at Time 1, 812 had unimpaired mobility and cognition, and 412 had repeated assessments 2 years later at Time 2. This study included these 412, of which 220 had data at 4 years (Time 3) and 140 had data at 6 years (Time 4). Reasons for failure to return are reported in Supplementary data, Appendix 2, available in Age and Ageing online.
The study protocol was approved by the institutional review board. All participants provided written informed consent.
Mobility assessment
Usual gait speed to the nearest 0.1 second was measured on a 6-meter course. The average speed in m/s over two trials was used for analyses.
The 400 m walk test provides a 400 m fast walk time. Participants complete ten 40-meter laps walking as quickly as possible and are not allowed to run. Lap time was recorded using a stop watch; the sum of 10 lap times yields the 400 m time. The use of walking aids during the test increased from 0.2% to 2.1% from Time 1 to Time 4.
Cognition assessment
Executive function and verbal memory were assessed with a neuropsychological battery. Measures of executive function included the Digit Symbol Substitution Test (DSST) [15] and the Trail Making Test Part B (TMT-B) [16]. DSST assesses complex visuoperceptual speed and mental tracking. TMT-B assesses cognitive flexibility, visuomotor speed and tracking. Verbal episodic memory was measured using the California Verbal Learning Test (CVLT) [17], including immediate recall, short-delay free recall and long-delay free recall.
Cognitive status
At every visit, all participants were screened using the Blessed Information Memory Concentration (BIMC) Test. Participants were evaluated with the Clinical Dementia Rating Scale (CDR) or the dementia questionnaire if the BIMC score was ≥4. In addition, participants in some sub-studies acquire a CDR at each study visit. A participant was reviewed at a consensus diagnostic conference if the BIMC score was ≥4, the CDR score ≥0.5 or the dementia questionnaire was abnormal. Mild cognitive impairment was determined by Petersen criteria [18]. Diagnoses of dementia and Alzheimer's disease, respectively, were determined by the Diagnostic and Statistical Manual (DSM)-III-R and the National Institute of Neurological and Communication Disorders and Stroke—Alzheimer's Disease and Related Disorders Association criteria [19], respectively. The prevalence of cognitive impairment or dementia changed from 0 at Time 1 to 3.7% at Time 4.
Covariates
Age, sex, self-reported education in years, height and weight were collected at each visit. Body mass index was calculated as weight in kg divided by square of height in meters.
Statistical analysis
We first examined the cross-sectional association between mobility and cognition at each assessment using multivariable linear regression models, adjusted for age, sex, body mass index and education. We then examined the temporal sequence between mobility and cognition using bivariate autoregressive cross-lagged models from structural equation models [20]. In this model, both cross-lagged and autoregressive associations were evaluated simultaneously. Specifically, the autoregressive analyses examined the association between cognition at time t and cognition at time t + 1 as well as the association between mobility at time t and mobility at t + 1. The cross-lagged analyses examined the association between cognition at time t and mobility at time t + 1 while controlling for mobility at time t, and vice versa (i.e. the association between mobility at time t and cognition at time t + 1, while controlling for cognition at time t). Associations between each pair of sequential time periods (i.e. Time 1–2, 2–3, 3–4) were set to be the same in both cross-lagged and autoregressive analyses. Both autoregressive and cross-lagged associations were adjusted for age, sex, body mass index and education at Time 1. Due to multiple testing between two mobility measures and five cognitive measures, significance was defined as P < 0.005 using Bonferroni correction (0.05/10 = 0.005). A significant association between cognition at time t and mobility at time t + 1 would be over and beyond the variance accounted for by the autoregressive association between mobility at time t and mobility at t + 1, and covariates. Values of TMT-B were log transformed due to a skewed distribution. For comparison purposes, values of mobility and cognitive measures were standardised in Z scores based on the mean and standard deviation at Time 1. The regression coefficient of an association is equivalent to the effect size. We also examined the temporal sequence of two mobility measures.
We conducted a sensitivity analysis to evaluate whether the associations would change due to selection bias attributable to the increased difficulty and risk of missing follow-up data for the 400 m walk compared to the short usual pace walk. Thus, we repeated the analyses in a larger sample who had data on usual gait speed whether or not they had data on the 400 m walk (N = 484 at Time 1).
Statistical analyses were performed using SAS statistical package (v9.3, SAS Institute Inc., Cary, NC) and Mplus7.11 (Muthen & Muthen).
Results
Table 1 provides sample characteristics. Compared to those who were initially unimpaired and returned at Time 2, those who did not meet these criteria had poorer scores on DSST, CVLT immediate recall, short-delay free recall, long-delay free recall, and had longer 400 m time (see Supplementary data, Appendix 3, available in Age and Ageing online). The two groups did not differ in other characteristics.
Sample characteristics
| Time 1 (n = 412) | Time 2 (n = 412) | Time 3 (n = 222) | Time 4 (n = 140) | |
|---|---|---|---|---|
| Characteristics | ||||
| Age, years | 71.4 (7.7) | 73.6 (7.7) | 75.3 (7.2) | 76.9 (7.2) |
| Female, N (%) | 209 (50.7) | 209 (50.7) | 108 (48.7) | 71 (50.7) |
| Body mass index, kg/m2 | 26.9 (4.6) | 27.3 (4.7) | 27.2 (4.6) | 27.0 (4.4) |
| Education, yearsa | 17 (2) | 17 (2) | 17 (2) | 17 (2) |
| Cognitive impairment or dementia, N (%) | 0 (0) | 3 (0.7) | 3 (1.4) | 4 (2.9) |
| Global mental state | ||||
| MMSE (range 0–30) | 28.8 (1.2) | 28.7 (1.4) | 28.6 (1.4) | 28.7 (1.3) |
| Executive function | ||||
| DSST (range 0–90) | 47.0 (10.9) | 44.9 (11.4) | 41.8 (11.4) | 41.7 (11.2) |
| TMT-B, s, median (IQR) | 69.5 (33) | 71.0 (36) | 69.5 (36) | 71.0 (37) |
| Verbal memory | ||||
| CVLT immediate recall | 52.5 (12.1) | 52.5 (12.7) | 54.2 (13.1) | 53.1 (12.6) |
| CVLT short-delay free recall (range 0–16) | 10.7 (3.3) | 10.6 (3.5) | 10.9 (3.4) | 10.6 (3.4) |
| CVLT long-delay free recall (range 0–16) | 11.2 (3.3) | 11.2 (3.3) | 11.4 (3.4) | 11.1 (3.5) |
| Mobility measures | ||||
| Usual gait speed, m/s | 1.14 (0.18) | 1.12 (0.19) | 1.13 (0.20) | 1.10 (0.19) |
| 400 m time, s | 267.4 (41.3) | 279.2 (52.4) | 290.2 (65. 3) | 297.1 (66.0) |
| Use of a walking aid, N (%) | 1 (0.2) | 2 (0.5) | 3 (1.4) | 3 (2.1) |
aPresented in years of full time education.
Note: MMSE, Mini-mental State Exam; DSST, Digit symbol substitution test; TMT-B, Trail Making Test Part-B; CVLT, California Verbal Learning Test. Values are mean (SD) unless otherwise noted.
The cross-sectional association between cognition and mobility
Cross-sectionally at Time 1, there were no significant associations between usual gait speed and any of the cognitive measures after adjustment, but there were significant associations of 400 m time with DSST, TMT-B and CVLT immediate recall. There were associations and trends toward a variety of associations among usual gait, 400 m time, and cognition at the follow-up periods in the expected direction (see Supplementary data, Appendix 4, available in Age and Ageing online).
The temporal sequences of usual gait speed with executive function and memory
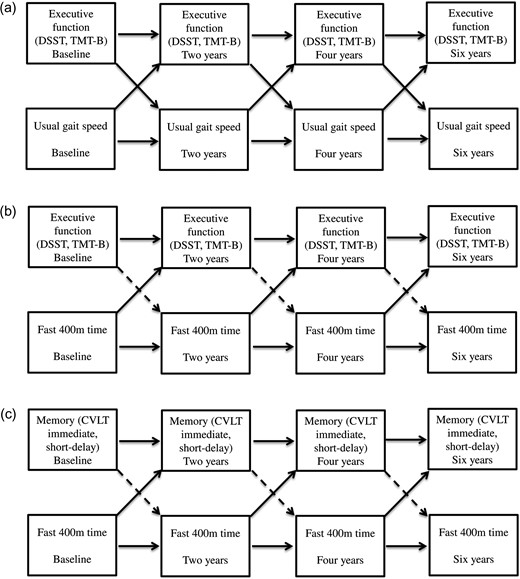
Significant cross-lagged and autoregressive associations between cognition and usual gait speed (a) and fast 400 m time (b) (c). Solid line: significant associations. Dashed line: non-significant associations.
Cross-lagged associations of mobility with cognition
| β (SE), P-value | β (SE), P-value | |||
|---|---|---|---|---|
| Cross-lagged associations between cognitive measures and gait speed (higher = better) | ||||
| DSST→gait speed | 0.092 (0.028), 0.001 | gait speed→DSST | 0.069 (0.018), <0.001 | |
| TMT-B→gait speed | −0.100 (0.029), 0.001 | gait speed→TMT-B | −0.137 (0.025), <0.001 | |
| CVLT immediate→gait speed | 0.049 (0.028), 0.081 | gait speed→CVLT immediate | 0.059 (0.022), 0.008 | |
| CVLT short-delay→gait speed | 0.051 (0.029), 0.074 | gait speed→CVLT short-delay | 0.063 (0.024), 0.009 | |
| CVLT long-delay→gait speed | 0.046 (0.030), 0.119 | gait speed→CVLT long-delay | 0.031 (0.023), 0.178 | |
| Cross-lagged associations between cognitive measures and 400 m time (lower = better) | ||||
| DSST→400 m time | −0.031 (0.023), 0.183 | 400 m time→DSST | −0.048 (0.016), 0.003 | |
| TMT-B→400 m time | 0.012 (0.023), 0.620 | 400 m time→TMT-B | 0.115 (0.023), <0.001 | |
| CVLT immediate→400 m time | −0.019 (0.023), 0.394 | 400 m time→CVLT immediate | −0.078 (0.020), <0.001 | |
| CVLT short-delay→400 m time | −0.029 (0.023), 0.203 | 400 m time→CVLT short-delay | −0.087 (0.022), <0.001 | |
| CVLT long-delay→400 m time | −0.038 (0.023), 0.108 | 400 m time→CVLT long-delay | −0.043 (0.021), 0.043 | |
| Cross-lagged associations between usual gait speed and 400 m time | ||||
| Gait speed→400 m time | −0.060 (0.026), 0.023 | 400 m time→usual gait speed | −0.311 (0.028), <0.001 | |
Note: N = 412 at Time 1, N = 412 at Time 2, N = 222 at Time 3, N = 140 at Time 4. Models adjusted for the dependent variable measure at the previous assessment, baseline age, sex, body mass index and years of education. Bold number reflects significant associations with Bonferroni correction.
The temporal sequences of 400 m time with executive function and memory
After adjustment, the autoregressive associations of 400 m time, DSST, TMT-B and CVLT measures across all time points were all significant at P < 0.001 (data not shown). There were significant one-way cross-lagged associations of slower 400 m time with poorer DSST, TMT-B, CVLT immediate recall and short-delay free recall scores. Slower 400 m time was associated with subsequent poorer DSST, TMT-B, CVLT immediate recall and short-delay free recall, while accounting for prior scores on these measures. In contrast, DSST, TMT-B, CVLT immediate recall and short-delay free recall were not associated with subsequent 400 m time (Table 2, Figure 1b–c). There was a one-way trend toward the association of slower 400 m time and subsequent poorer CVLT long-delay free recall that did not hold after correcting for multiple testing.
The temporal sequences of usual gait speed and fast 400 m time
There was a one-way cross-lagged association of longer 400 m time with subsequent slower usual gait speed, while accounting for prior usual gait speed. In contrast, usual gait speed did not predict subsequent 400 m time after accounting for prior 400 m time.
Sensitivity analyses
Among all who met entry criteria, with or without complete follow-up 400 m test data, results of the bidirectional relationships of slower usual gait speed with poorer DSST and TMT-B remained significant after Bonferroni correction (see Supplementary data, Appendix 5, available in Age and Ageing online).
Discussion
In a sample of older adults with initially unimpaired gait speed and cognition, we found that usual gait speed and executive function measures of DSST and TMT-B have a bidirectional change relationship. In contrast, poor fast-paced endurance walk performance may be a strong and early predictor of subsequent deficits in executive function and memory, while the reverse was not found.
The strong bidirectional association between usual gait speed and executive function is consistent with prior findings [11, 12]. Several potential mechanisms for this relationship have been proposed. First, gait performance and executive function may share common neuropathologies. Based on neuroimaging evidence, poorer gait and executive function are both associated with greater brain atrophy and white matter lesions [1]. Second, some have proposed that the increasing number of senescent cells during ageing, accompanied by the secretion of pro-inflammatory cytokines, growth factors and proteases, may explain the bidirectional relationship [21, 22]. Third, multiple health-related conditions of age, including multi-morbidity and lifestyle factors may affect systems that contribute to worsening of both gait and executive function [23].
We did not find significant longitudinal associations between usual gait and memory function, while some prior studies reported a bidirectional relationship [12, 24]. In contrast, we found that the longer 400 m time at a fast pace unidirectionally predicted subsequent executive function and memory, whereas tasks assessing these cognitive domains did not predict subsequent 400 m time. This is consistent with a report suggesting that fast but not usual gait speed predicts global cognitive function [25], but that study did not test specific cognitive domains. There is evidence that one path to brain health appears to be fitness training [26]. Perhaps the more demanding longer fast-paced walk may be more able to detect cardiopulmonary fitness, and physiological reserve compared to usual gait [27]. In this cohort with unimpaired cognition, the 400 m time predicted CVLT immediate and short-delay free recall, but not long-delay free recall. Longitudinal data from the BLSA suggest that CVLT immediate recall is the first to decline during the early preclinical stages of disease, while decline in delayed recall is enhanced in the later stage [28]. Perhaps, the ability of 400 m to predict CVLT immediate recall and short-delay free recall is capturing the earliest changes in this initially unimpaired cohort.
The inconsistency among studies may be attributable to methodological differences, including the sample, the duration of follow-up and the types of measures used [5–9, 11, 12]. Three studies only examined rate of change, so were unable to assess the sequence of events [6, 7, 12]. Of the remaining five studies, two required normal cognition [10, 11], one that participants be free of dementia [8], one excluded diagnosed neurological disease [9] and one did not specify cognitive eligibility [12]. In terms of mobility at entry, one required no report of difficulty walking ¼ mile, climbing 10 steps, or performing activities of daily living at entry [11], one that participants be able to walk 3 meters [9], but others do not provide an explicit criterion. Among the five studies, measures of cognition vary from global indicators such as MMSE to executive function tests only, to one report with an extensive cognitive battery [10]. All five measured usual gait, while some also included chair stands and grip strength. None included a long fast walk. Follow-up ranged from 1 to 9 years.
Our study has several strengths. We attempted to create an initially unimpaired cohort where the sequence of decline could be detected. We tested two key measures of gait and two domains of cognition, to allow assessment of differential associations within types of mobility and cognition. In addition, we performed a sensitivity analysis to assess selection bias during follow-up. Our study also has limitations. Those who return are in better health than those who do not (Appendix 2, available at Age and Ageing online). If those who failed to return had greater decline, it is likely that our estimates of the magnitude of change over time are underestimates. In the overall ageing population, the true rate of decline may be greater. We cannot predict the effect of loss of follow-up on the direction or sequence of change. While our follow-up lasted 6 years, an even longer period might reveal stronger effects because over longer periods of time people are likely to decline more.
In this initially unimpaired cohort of older adults, change in usual gait speed and executive function predict each other over time, whereas poor fast-paced endurance walk performance appears to precede decline in executive function and memory. Endurance walking may be a sensitive early predictor of cognitive change.
Age-related declines in mobility and cognition are strongly correlated, but the temporal sequence of change over time is not well understood.
Changes in usual gait speed and executive function predict each other over time, whereas poor fast-paced endurance walk performance appears to precede declines in executive function and memory.
Endurance walking performance may be a sensitive early predictor of cognitive change.
Supplementary data
Supplementary data are available at Age and Ageing online.
Conflicts of interest
None declared.
Funding
This research was supported by the Intramural Research Program of the National Institute on Aging.
References

Comments