


Abstract
1. Assess validity of the Oxford Cognitive Screen (OCS-Plus), a domain-specific cognitive assessment designed for low-literacy settings, especially in low- and middle-income countries (LMIC); 2. Advance theoretical contributions in cognitive neuroscience in domain-specific cognitive function and cognitive reserve, especially related to dementia.
In a cross-sectional study of a sample of 1,402 men and women aged 40–79 in the Health and Aging in Africa: A Longitudinal Study of an INDEPTH Community in South Africa (HAALSI), we administered OCS-Plus along with health and sociodemographic assessments. HAALSI is a representative sample of older adults in Agincourt, South Africa contributing to normative understanding of cognition in LMIC. We report measure distributions, construct and external validity of the OCS-Plus.
OCS-Plus has excellent construct and external validity. Intra-class correlations between similar basic measures of orientation in OCS-Plus and in HAALSI assessments was 0.79, and groups of people performing well on the OCS-Plus verbal memory also showed superior performance on HAALSI verbal memory. The OCS-Plus scores showed consistent associations with age and education and domain-specific associations with alcohol and depression. Younger respondents and the more educated did better on all assessments.
The OCS-Plus represents a major methodological advance in dementia studies in LMICs, and enhances understanding of cognitive aging.
The greatest burden of dementia will rest in developing countries, yet optimal screening tools suited for low- and middle-income countries (LMICs) are limited (Kalaria et al., 2008). By 2040, an estimated 70% of the 80 million people with dementia will reside in LMICs, where many older adults have little formal education and low levels of literacy (Ferri et al., 2006). Educational attainment is a consistent predictor of cognitive function across countries, including LMICs (McArdle, Smith, & Willis, 2009; Strauss et al., 2010). Furthermore, cognitive abilities decline sharply with age (Barrett et al., 2011; Strauss et al., 2010), a particular challenge for LMICs such as South Africa, where life expectancy is expected to rise dramatically (Bor, Herbst, Newell, & Bärnighausen, 2013). Currently, 2–4% of the sub-Saharan African population over 60 are estimated to have dementia or some form of cognitive decline (WHO, 2012). The HIV/AIDS epidemic may significantly alter patterns of cognition and dementia in late adulthood (Mateen & Mills, 2012). It seems clear that there may be improved approaches to assessing cognition more tailored to social conditions of older adults in sub-Saharan Africa (Hendrie et al., 2006).
Pioneering work on dementias in LMIC has emerged over the last decades (Ogunniyi et al., 2000; Prince, Acosta, Chiu, Scazufca, & Varghese, 2003; Rodriguez et al., 2008). However, studies assessing cognitive disorders in sub-Saharan Africa involve (with some notable exceptions) small samples, and are clinic-based (Mateen & Mills, 2012). Population-based studies incorporating neuropsychometric testing are particularly rare for this region, as are contextually validated assessments of cognitive function and dementia (Mayeux et al., 2011; Seshadri et al., 2011; D. R. Weir et al., 2011). Developing cognitive assessments for population-based studies that emphasize validity will elucidate the growing international burden of cognitive decline and dementia. Reliable cross-country epidemiological estimates are compromised by limitations in available cognitive screening tools. There is also increased awareness that early detection of dementia—to which available screening tools are less sensitive (McLane et al., 2014; Swainson et al., 2001)—is critically important for prevention and diagnosis.
A key challenge in detecting cognitive dysfunction within and across countries is that education is not only a likely causal factor contributing to true differences in cognitive function, but also a biasing factor in measurement, to the extent that some cognitive tests are sensitive to education levels even conditioning on true variation in cognition (Berkman, 1986; Glymour, Kawachi, Jencks, & Berkman, 2008; Glymour, Tzourio, & Dufouil, 2012).
Cognitive neuropsychology theory emphasizes the independence and dissociation of specific cognitive domains. This independence is apparent in focal brain injury studies (e.g., in stroke (Demeyere, Riddoch, Slavkova, Bickerton, & Humphreys, 2015), and in many subtypes of neurodegeneration. Aside from Alzheimer’s disease (AD), which is characterized by precipitous memory decline, other dementias have specific domain profiles: fronto-temporal dementia, semantic dementia, cortico-basal degeneration, posterior cortical atrophy. These are characterized by domain-specific impairments and often cannot be diagnosed with current dementia screens (Cullen, O’Neill, Evans, Coen, & Lawlor, 2007).
Traditional screens for dementia such as the Mini Mental State Examination (MMSE) (Folstein, Folstein, & McHugh, 1975) take a binary view of cognition, relying on a summary score from subtasks with a single cutoff value for impairment. Due to the nature of subtasks, this single value is heavily weighted on verbal memory performance. In addition, the MMSE is typically subject to ceiling performance and low sensitivity (Hoops et al., 2009; O’Bryant et al., 2008). Other dementia screens, such as the Montreal Cognitive Assessment (MoCA; Nasreddine et al., 2005) and Addenbrooke’s Cognitive Examination, contain measures of domains other than memory, but they lack domain-specific normative data and are almost exclusively language-based. These screens, therefore, are inappropriate for populations with language deficits (Demeyere et al., 2015) or low literacy.
Here, we report validation of the Oxford Cognitive Screen (OCS-Plus), an innovative domain- specific and domain-general tablet-based approach to cognition assessment. OCS-Plus was developed as a novel screening tool, based on cognitive neuropsychology theory, and provides continuous performance measures, both (i) domain-specific: language; memory; visuo-spatial abilities and (ii) domain-general: selective and sustained attention; executive functioning. Importantly, OCS-Plus is administered via tablets, with respondents themselves completing tasks, their performance and timing automatically recorded and scored—an important improvement over measures derived from examiner-scored responses to interview questions.
OCS-Plus offers a series of important advantages, including: improved design emphasizing visual-oriented assessments minimizing language effects; time-efficient tests targeting distinct cognitive domains; mobile technology implementing automatic scoring, increasing test sensitivity, standardizing administration, and facilitating deployment in large population studies.
The OCS-Plus approach provides a critical stepchange in population cognitive screening by building comprehensive and refined cognitive profiles incorporating both domain-specific and domain-general measures. These profiles facilitate early identification of decline in more than the traditional memory domain, enabling detection of other types of dementia and early stages of AD. Furthermore, OCS-Plus tests avoid ceiling effects and increase performance range in healthy populations by including more challenging nonverbal tasks and automatically deriving timing measures.
In this article, OCS-Plus is validated in a population of older adults in rural South Africa against standard questionnaires (construct validity) and in relation to associations with a number of variables including physical and mental health, age, education, and alcohol consumption (external validity). This work contributes to provision of age and education-related norms for these measures in population based studies in LMICs.
Method
We draw on data from the Health and Aging in Africa: A Longitudinal Study of an INDEPTH Community in South Africa (HAALSI), a cohort study in Agincourt, South Africa, designed as one of the international sister studies of Health and Retirement Study (HRS; Arokiasamy, Bloom, Lee, Feeney, & Ozolins, 2012; Borsch-Supan et al., 2013; Sonnega et al., 2014; Steptoe, Breeze, Banks, & Nazroo, 2013; Zhao, Hu, Smith, Strauss, & Yang, 2014). HAALSI investigates drivers and consequences of noncommunicable diseases and HIV among older adults. The study setting, Agincourt subdistrict of rural northeast South Africa, is an area of poverty, low education, high unemployment, and consequent labor migration. The population of 110,000 has been followed since 1992 under the Agincourt Health and Socio-Demographic Surveillance System (Kahn et al., 2012). A total of 5,059 women and men aged 40 and older were enrolled in HAALSI between November 2014 and December 2015; recruitment procedures and eligibility criteria are described elsewhere (Gómez-Olivé et al., 2016). The survey response rate was 85.9%. Respondents completed a household questionnaire capturing demographics, education, employment history, cognitive and physical functioning, self-reported health history, and social, HIV, and cardiometabolic risk factors. A random subsample of the household respondents aged 40–79 were then invited to either a follow-up visit at Agincourt research laboratory or home, where they completed OCS-Plus assessments between May–December 2015. We present data from 1,402 respondents (508 men, 894 women) who completed OCS-Plus language and memory tasks and HAALSI Computer-Assisted Personal Interview (CAPI) cognition tests. Compliance and test conditions for OCS-Plus tasks are provided in Supplementary Table 1. Two-thirds of the HAALSI cohort were sampled for a follow-up visit. Approximately 75% of those sampled for follow up consented to a second visit during which time venous blood, clinical exams, and the OCS-Plus were administered. Among those who consented to the follow-up visit, no one refused to participate in the cognitive assessment.
Measures
OCS-Plus assessment
OCS-Plus comprises nine short tests of domain-specific and domain-general cognitive performance: language, memory (intentional and incidental), executive functioning (task switching and rule finding), attention (auditory), and praxis. OCS-Plus runs as a stand-alone application on Windows Surface Pro tablets and was developed using Matlab (The MathWorks, Inc, 2012) and Psychophysics Toolbox (Brainard, 1997; Kleiner et al., 2007; Pelli, 1997). Administration takes 20–30 min. OCS-Plus’s graphical user interface guides interviewers through a fixed task list, provides full scripts for each task, ensuring standardized administration and intuitive framework for immediate response scoring. Interviewer and respondent interaction with tablets occurs via dedicated stylus; touch input is disabled to avoid accidental input.
For each task, the interviewer documents the administration condition by selecting from a predefined “condition of test” list. Timing is automatically recorded; for most tasks, accuracy of response is also automatically scored. Exceptions include tasks involving interpretation of respondent’s speech or drawing. Here, we describe and report accuracy scores for eight of the nine tasks. The praxis task requires manual offline scoring and data have not yet been analyzed.
Stimuli were adapted to linguistic and cultural context and validated on a gender- and age-matched population subsample. Visual stimuli were black and white original line drawings presented on a white background. Auditory stimuli were voice recordings of a female native speaker of the local language, Shangaan.
A summary provided in Supplementary Table 2 details the OCS-Plus tasks in the order they were administered, together with illustrations of respondent visual displays and description of derived scores.
Language Tasks
Picture naming
Respondents were asked to name a series of four objects with low frequency names. The line drawings of each object were presented one at a time, shown in the middle of the screen. Answers were audio-recorded and their accuracy immediately scored by interviewers. Respondents scored 1 for a correct answer, maximum total score of 4.
Semantics
Respondents were presented with four sets of known objects. In the first and second sets, the interviewer asked the respondent to identify a specific object (i.e., ostrich, pineapple). In the third and fourth sets, the interviewer asked the respondent to identify the object that fit a semantic category (i.e., vegetable, bird). Respondents scored 1 for a correct answer, maximum total score of 4.
One picture-naming stimulus and two nontarget (distractor) semantics stimuli formed part of the incidental memory task later in the assessment.
Memory Tasks
Orientation
Respondents were asked open-ended questions about the year, month, date, and current president. Answers were audio-recorded and response accuracy for each item scored by interviewers immediately after response was given. Respondents scored 1 for each correct answer, with a maximum of 4 total.
Word encoding
Respondents were shown and read out loud five words, asked to remember them, then immediately asked to recall the words (first immediate recall). Responses were audio-recorded and interviewers marked recalled words. Respondents scored 1 for each recalled word, maximum total score of 5. Respondents were then informed that recall of these words would be tested later; words were again shown, read out loud, and their recall tested in a similar fashion (second immediate recall).
Word-delayed recall and recognition
After performing the trails nonverbal executive task that took 4–5 min, respondents were asked to recall the words (delayed recall). Responses were audio-recorded and scored 1 for each correct word. For each word not recalled, respondents were presented with a list of four words on the screen, of which one was the learned word and the rest were semantically related words. Respondents were asked to indicate the word they recognized as the one learned (delayed recognition). Respondents scored 1 for each recalled word, maximum score of 5. Respondents also scored 1 for each recognized word, maximum combined score of 5.
Incidental memory
Respondents were presented with a set of four line drawings and asked to identify the item previously seen during the assessment. Three sets were presented in fixed order. Each set contained three previously unseen items, and one item presented earlier: one target item from picture-naming task, two distractor items from the semantics task. A fourth similar set was presented including written words, with one target verbal memory word and three distractors. Respondents scored 1 for each recognized item, maximum total score of 4.
Executive Function Tasks
Trails
Respondents were presented with an arrangement of dark gray circles and light gray squares of different sizes and asked to draw lines on the screen with stylus to connect them in certain orders. Arrangements were pseudo-random, ensuring that correct connections would not intersect with other shapes or correct connections. To hold the respondent’s engagement, when the line intersected a shape, visual, and auditory feedback was given. Performance was timed and automatically scored.
There were two baseline conditions and one set-switching condition. Each condition was preceded by interviewer demonstration and two practice runs; assessment only followed successful completion. During test runs, respondents were given no prompts or feedback regarding accuracy or completeness of the trail, and each task finished when respondent indicated the trail was complete.
Test runs for first baseline condition consisted of an arrangement of eight circles and eight squares. Respondents were asked to connect circles from small to large. Respondents scored 1 for each correct connection (maximum score: 7). Test runs for second baseline condition consisted of a similar arrangement, with respondents asked to connect squares from large to small. Scoring remained the same. In the switch condition test, respondents were asked to alternate connections between squares and circles, alternating in size, starting with the largest square followed by the smallest circle, and continuing until all shapes were connected. Scoring was similar, this time with a maximum score of 14. For respondents who scored at least 2 in baseline condition, executive score was the switch condition score as a percentage of highest baseline score. An additional binary score was derived to record whether respondents failed to learn the task.
Rule finding
Respondents were presented with a set of 12 squares and 12 triangles randomly arranged in an 8-by-3 grid. All shapes were light gray, with the exception of one item per row that was dark gray. During the task, a red dot moved across the shapes following certain rules. Current and previous positions of the dot were always marked. At each move, respondents were asked to use the stylus to tap the position they predicted the dot would assume next. After one practice rule, respondents received no feedback, but accuracy could be inferred from the subsequent position.
There were five rules in total, and transitions from one rule to next were not signaled. Four rules were positional (shape colors were irrelevant), but for the final rule both position and shade were relevant. Respondent scored 1 for each correctly predicted move. The first move in every rule—where only guessing was possible—was not scored. Two consecutive correctly predicted moves within a rule were scored as rule found, with a maximum score of 5. An additional binary score recorded whether respondents failed to learn tasks, resulting in 0 rule score.
Auditory Attention
OCS-Plus includes an auditory attention task assessing selective and sustained attention to words presented repeatedly in an audio recording.
The task included three target words (goodbye, down, no), three semantically related distractors (hello, up, yes), and three unrelated distractors (and, eat, day). Each word was presented nine times, split across three blocks, each containing three presentations of each word. The order of words within each block was pseudo-randomized. Interstimulus interval was assigned randomly from a selection of 1, 2.5, and 3 s.
Respondents used the stylus to tap a blue button in the middle of the screen as soon as they heard any target word, and to tap a yellow button beneath the blue one upon hearing any other word. Respondents were not told about the identity of distractor words prior to testing.
The test run was preceded by a maximum of three practice runs, in which respondents were presented a short audio recording comprising one presentation of each target and semantically related words. Following each practice run, respondents were presented with target and distractor words, one per row, and asked to identify target words. Assessments only proceeded to test run if respondents either responded correctly to practice or correctly identified target words. An additional binary score was derived to record whether respondents passed the practice.
HAALSI household measures and assessments
In the HAALSI survey, respondents were interviewed in Shangaan during home visits by trained fieldworkers using CAPI. Respondents were asked background questions on household members and household socioeconomic and social characteristics, age, educational attainment, employment status, and health. In these analyses, we include questions regarding age, taken from administrative records of date of birth; education, defined by years of schooling and categorized as no education, some primary education, or completion of primary education or more; depression, measured with an 8-item Center for Epidemiological Studies Depression Scale (CES-D) (Radloff, 1977), with yes/no scoring of symptoms reported in the last week; consumption of any alcohol in the previous 30 days (a measure of general consumption not alcoholism), scored yes/no; and activities of daily living (ADLs; walking across room, bathing, eating, getting in or out of bed, toileting), scored yes if positive to any (Katz, Ford, Moskowitz, Jackson, & Jaffe, 1963; Sonnega et al., 2014). Literacy was assessed separately from education; respondents were asked whether they could read or write. Household wealth is the quintile ranking of scores derived from principal components analysis of ownership of household items, livestock, and vehicles (Filmer & Pritchett, 2001).
The HAALSI cognitive function assessment consisted of standard questions drawn from HRS to assess cognitive competencies (Sonnega et al., 2014). The series spans three cognitive domains: memory, orientation, and executive functioning. The questions include self-rated past and present memory, working memory, orientation, and a mini-mental state exam. Here, we describe results on memory and orientation.
Memory
Immediate word recall
Respondents remember as many words as possible, in any order, from a list of 10 words read by the interviewer. Word retention was immediately tested and words recalled were documented. If no words were recalled, interviewers read out the same list again up to three additional times. Regardless of recall success, interviewers told respondents that their recall would be assessed later. Four unique lists were stored in CAPI, and one list was randomly chosen for each respondent to reduce any potential bias.
Delayed word recall
After an average of 1 min, respondents were asked to recall any of the 10 words. Words recalled were documented. The 1-min delay was shorter than commonly used in similar surveys and resulted from a faster interview pace than anticipated based on our pilot studies. The short delay may limit the sensitivity of this measure.
Orientation
Respondents name the current month, date, year, and president. Accuracy of response (correct/incorrect/not known/refusal) was recorded for each question. Note that these questions are identical to those in OCS-Plus orientation task.
Statistical Approach
We use several methods to test validity of the OCS-Plus. We first document overall distributions of OCS-Plus scores, as well as variation in scores by age and education. We assess convergent validity by testing intra-class correlations and report the extent to which comparable HAALSI CAPI and OCS-Plus scores are associated. We examine OCS-Plus relationships between delayed word recall performance and ability to learn executive tasks. Finally, we complete multiple regression analyses for each of the OCS-Plus scores, including conditions we hypothesized would illustrate convergent and divergent external validity. We test for interactions between age and education to assess the impact of education on age-related differences.
Results
Table 1 describes the HAALSI cohort sociodemographic and health characteristics and distributions for the OCS-Plus validity sample of 1,402. Results indicate that, while there are more women in the OCS-Plus sample than in the overall HAALSI cohort, on most other dimensions the differences are small. An important feature of this cohort of rural South Africans is the overall low level of education. Over 45% of the cohort had no formal education and roughly 30% had only some primary education. Employment was 19% in men and 12.9% in women. It should be noted that most South Africans aged 60 or older receive the state old-age pension and do not commonly work in the formal work sector so these percentages are low.
Characteristics of the HAALSI Main Study Sample and the Cognition Subsample
| Full sample, N = 5,059 | Cognition subsample, N = 1,402 | |||
|---|---|---|---|---|
| n | % | n | % | |
| Sex | ||||
| Male | 2,345 | 46.4 | 508 | 36.2 |
| Female | 2,714 | 53.7 | 894 | 63.8 |
| Age | ||||
| 40–49 | 918 | 18.2 | 291 | 20.8 |
| 50–59 | 1,410 | 27.9 | 481 | 34.3 |
| 60–69 | 1,304 | 25.8 | 362 | 25.8 |
| 70–79 | 878 | 17.4 | 268 | 19.1 |
| 80+ | 549 | 10.9 | 0 | 0.0 |
| Education level | ||||
| No formal education | 2,306 | 45.7 | 542 | 38.7 |
| Some primary (1–7 years) | 1,614 | 32.0 | 543 | 38.8 |
| Some secondary (8–11 years) | 537 | 10.7 | 167 | 11.9 |
| Secondary or more (12+ years) | 585 | 11.6 | 147 | 10.5 |
| Marital status | ||||
| Never married | 290 | 5.7 | 74 | 5.3 |
| Separated/divorced | 650 | 12.9 | 206 | 14.7 |
| Widowed | 1,540 | 30.5 | 376 | 26.8 |
| Currently married/cohabitating | 2,575 | 50.9 | 746 | 53.2 |
| Household size | ||||
| Living alone | 534 | 10.6 | 129 | 9.2 |
| Living with 1 other person | 538 | 10.6 | 129 | 9.2 |
| Living in 3–6 person household | 2,438 | 48.2 | 692 | 49.4 |
| Living in 7+ person household | 1,549 | 30.6 | 452 | 32.2 |
| Employment | ||||
| Employed (part or full time) | 805 | 16.0 | 180 | 12.9 |
| Not working | 3,719 | 73.7 | 1,047 | 74.7 |
| Homemaker | 521 | 10.3 | 174 | 12.4 |
| Wealth index | ||||
| Quintile 1 (lowest) | 950 | 18.8 | 250 | 17.8 |
| Quintile 2 | 979 | 19.3 | 273 | 19.5 |
| Quintile 3 | 1,158 | 22.9 | 337 | 24.0 |
| Quintile 4 | 977 | 19.3 | 274 | 19.5 |
| Quintile 5 (highest) | 995 | 19.7 | 268 | 19.2 |
| Alcohol use | ||||
| Currently drinks (in last 30 days) | 1,171 | 23.2 | 265 | 18.9 |
| ADLs | ||||
| Has any ADL disability | 456 | 9.0 | 76 | 5.4 |
| Depression | ||||
| CESD Score 0 | 511 | 10.4 | 142 | 10.1 |
| CESD Score 1 | 2,362 | 47.9 | 649 | 46.3 |
| CESD Score 2 | 1,128 | 22.9 | 357 | 25.5 |
| CESD Score 3 or higher | 928 | 18.8 | 254 | 18.1 |
Note: Not shown: 17 missing education level, 4 missing marital status, 14 missing employment status, 3 missing alcohol use, 130 missing depression score in full sample; and 3 missing education level, 1 missing employment status, in subsample. In the full sample, 231 missing wealth index were assigned village mean wealth, 56 missing wealth index were assigned village mean wealth in subsample.
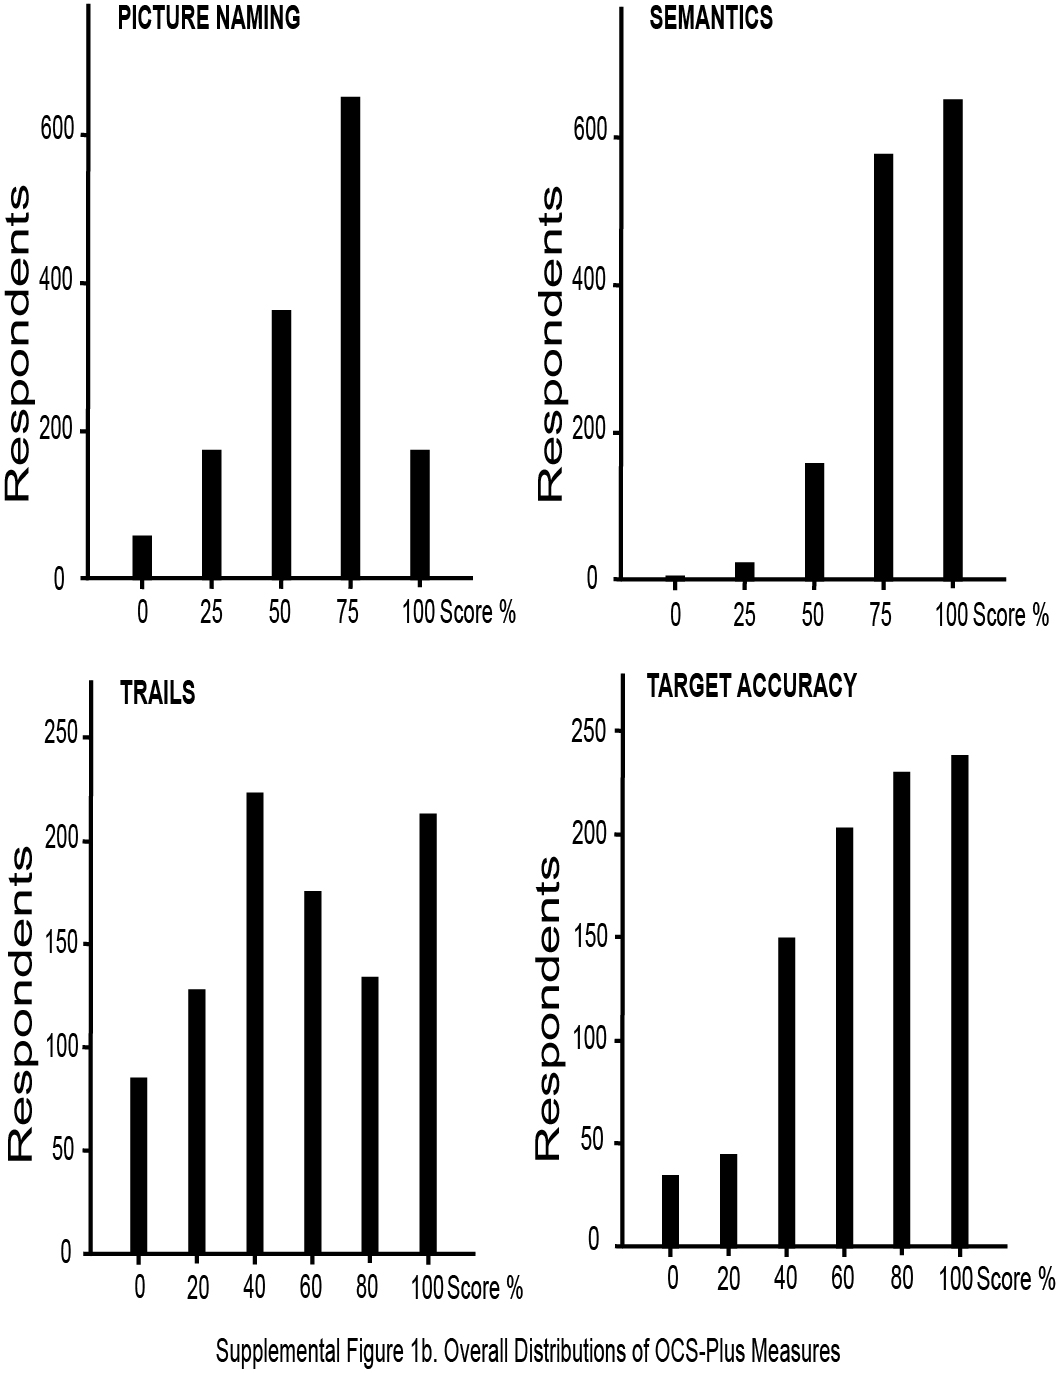
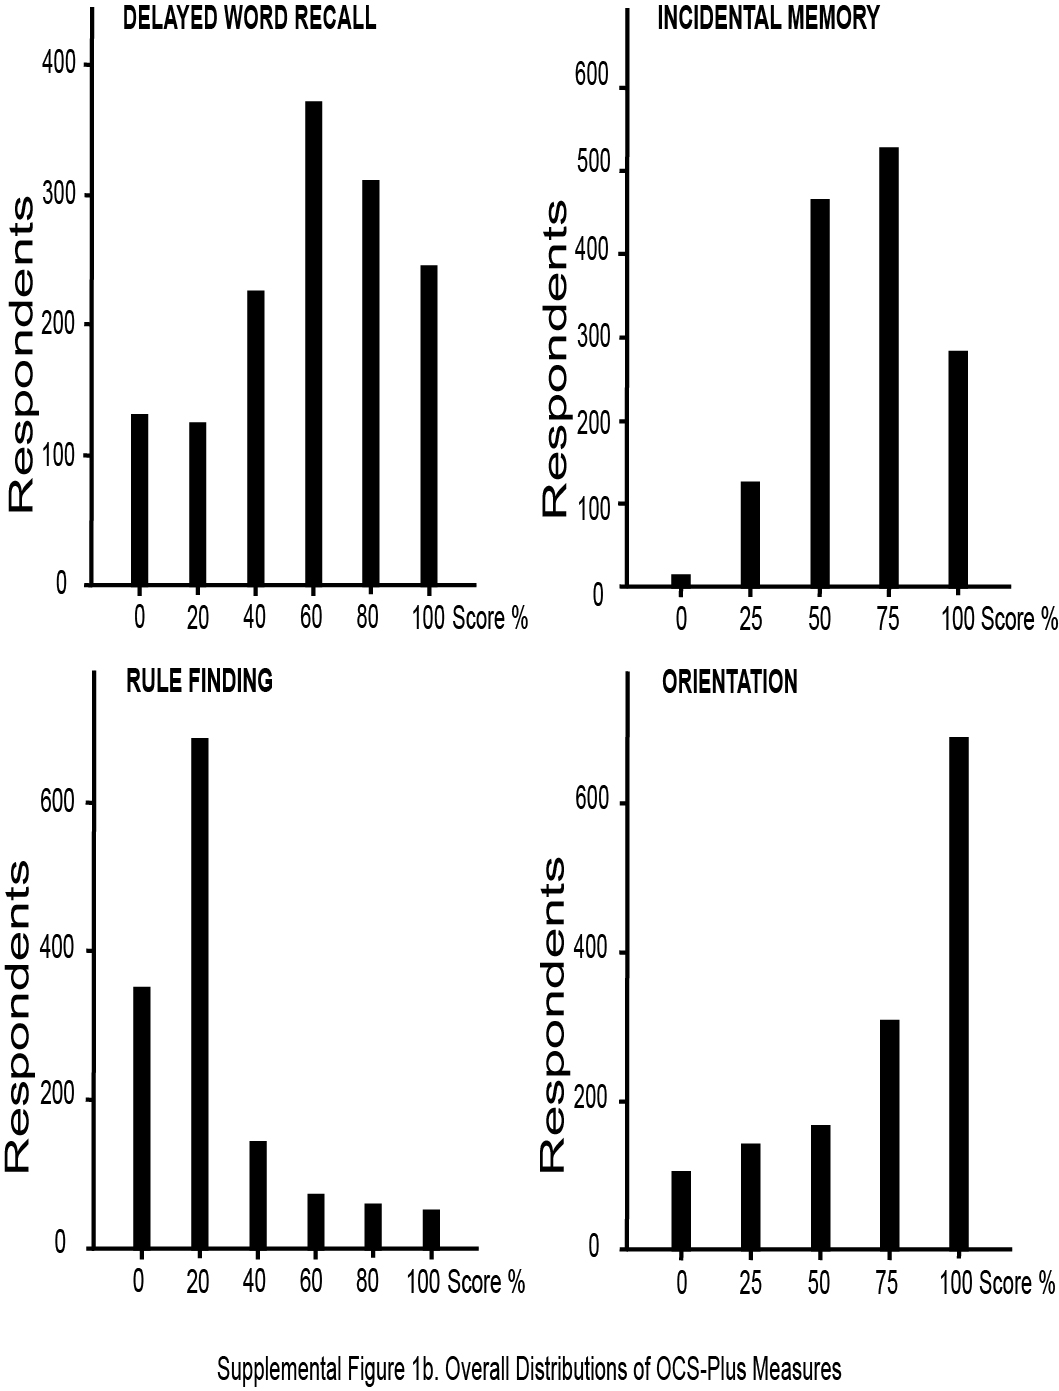
Supplementary Figure 1 presents distributions of OCS-Plus task scores pooled by age and education. A tendency to perform to ceiling was noted on the Orientation task, a standard measure in all dementia screens. The Rule Finding distribution of scores, however, exhibited a tendency to floor, with the majority of respondents not scoring higher than 20% (finding only one rule), though the full range was present with 15% of the sample finding more than two rules. Other tests, particularly incidental memory, demonstrated a very good range of variability across all scores. However, we note that these distributions were collapsed across age, sex, and education and therefore reflect these sample characteristic distributions as well as test score distributions (discussed below).
Figure 1 presents distributions for OCS-Plus task scores by age decade and education level. Since only 10.5% of the sample had 12 or more years of education, this group was combined with those with 8–11 years. The association between education and task performance was clearly apparent in all OCS-Plus tasks, with higher scores associated with higher levels of education. Although weaker, associations between age and performance were also evident, particularly for the oldest age group. We discuss in detail these associations in multivariate analyses with formal tests of significance, controlling potential confounders.
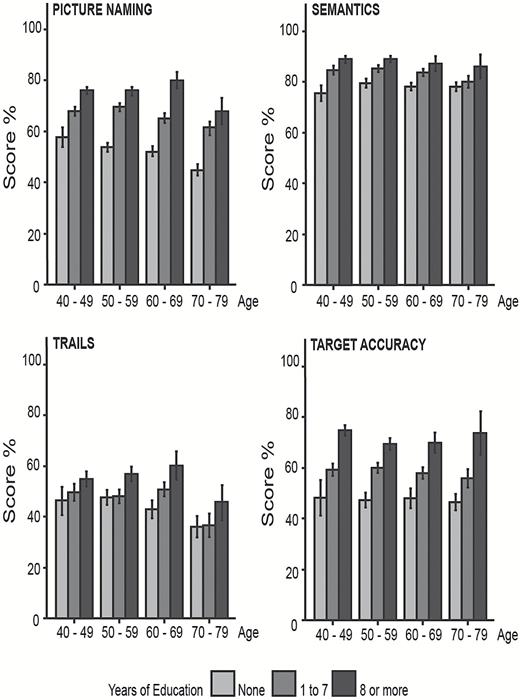
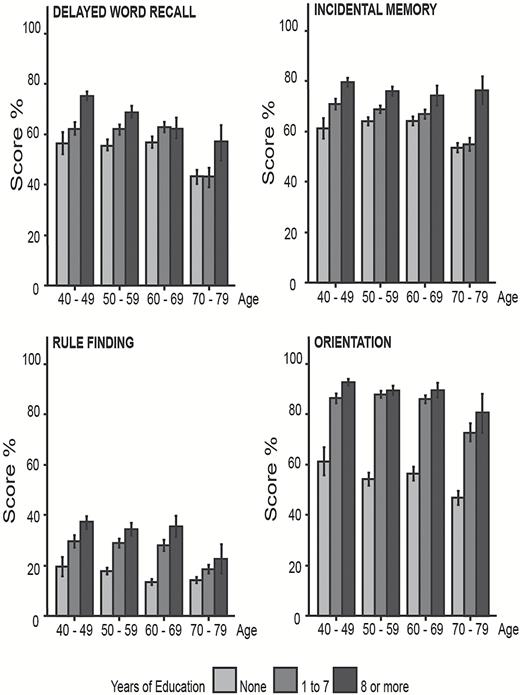
Distributions of OCS-plus scores by age and education (percent and standard error)
The next set of analyses assessed construct validity by comparing OCS-Plus scores and HAALSI CAPI scores on the two tasks that were similar, namely orientation and delayed word recall. Overlapping corresponding score distributions are shown in Figure 2.
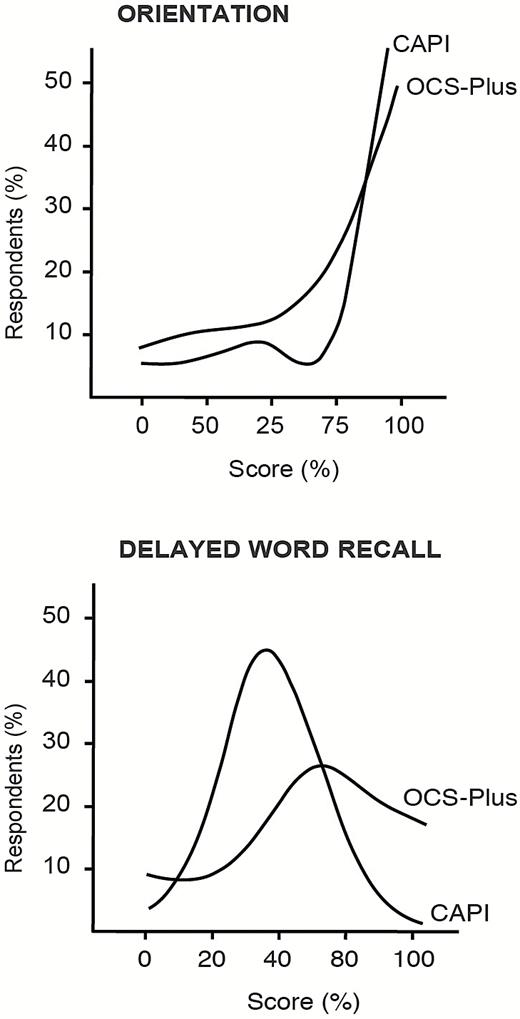
Distributions of OCS-plus and HAALSI CAPI orientation and delayed recall (percent correct).
The two measures of orientation were virtually identical in the two sets of assessments and the intra-class correlation was highly significant, p < .0001, Cronbach alpha 0.8. Comparisons of two measures of delayed word recall were less straightforward, since the two procedures employed were very different. The HAALSI CAPI instrument asked respondents to learn and later recall 10 words. Between the first presentation of words and delayed recall, words were presented again up to three times without recording number of rehearsals or intermediate recalls. Time delay between presentation of words and delayed recall was very short, averaging 1 min, during which two short numerical tasks were performed. By contrast, the OCS-Plus word memory task (intentional memory) involved only two presentations of a shorter word list comprising only five words, followed by a much longer executive nonverbal task. It is not surprising, then, that the intra-class correlation between the two scores was low, Cronbach alpha 0.3. However, further analysis was performed splitting respondents into two groups: high intentional memory performance (>3 words in the delayed recall OCS-Plus task) versus low performance (≤3). We found those with good OCS-Plus intentional memory performance also had superior performance on the HAALSI CAPI task [t(1,400) = 6.8, p < .001).
We then examined relationships between intentional memory performance and ability to learn executive tasks with a Pearson chi square between an operational score for high intentional verbal memory performance and binary score derived for ability to learn the executive task. We predicted that intentional verbal memory would not be associated with nonverbal executive tasks, but would be associated with the auditory attention task that included an important verbal memory component. Indeed, analyses revealed that intentional verbal memory performance was independent of ability to learn the rule finding task (Cramer’s V = 0.027, p = .32) and of ability to learn the trails task (Cramer’s V = 0.41, p = .15); it was associated with ability to learn the auditory attention task (Cramer’s V = .091, p = .001). This dissociation between intentional verbal memory and executive function performance is a critical finding highlighting the importance of nonverbal executive tests in informing detection of deficits outside the memory domain.
In our final set of analyses, we conducted multiple regressions for each OCS-Plus score, with gender, age, education, employment status, household wealth, depressive symptoms, and current alcohol included as independent variables. We conducted these analysis to establish external validity—or convergent validity. We hypothesized that OCS-Plus scores would be positively associated with education, employment, and wealth, and negatively associated with age, depressive symptoms, and alcohol use. Results are shown in Table 2.
Multiple Linear Regression Model Estimates Demonstrating Converging and Diverging External Validity of Eight OCS-Plus Measures
| Language | Memory | Executive | Attention | |||||
|---|---|---|---|---|---|---|---|---|
| Picture naming | Semantics | Orientation | Delayed word recall | Incidental | Trails | Rule finding | Target accuracy | |
| Male (ref: female) | 1.80 (1.4) | 0.13 (1.1) | 12.3*** (1.6) | −3.08+ (1.8) | −0.043 (1.4) | −4.83* (2.4) | 5.46*** (1.4) | 5.10* (2.0) |
| Age (ref: 40–49 years) | ||||||||
| 50–59 | −1.02 (1.7) | 0.61 (1.4) | −4.02* (2.0) | −3.37 (2.2) | −2.02 (1.7) | 1.25 (2.7) | −2.98+ (1.8) | −2.83 (2.2) |
| 60–69 | −4.04* (1.9) | −0.96 (1.6) | −6.17** (2.3) | −2.83 (2.5) | −2.79 (1.9) | 2.22 (3.2) | −6.69*** (2.0) | −4.85+ (2.6) |
| 70–79 | −10.5*** (2.1) | −2.04 (1.8) | −16.6*** (2.5) | −17.8*** (2.8) | −12.5*** (2.1) | −8.76* (4.0) | −10.6*** (2.2) | −5.12 (3.3) |
| Education (ref: none) | ||||||||
| 1–7 years | 12.2*** (1.4) | 4.65*** (1.2) | 25.7*** (1.7) | 4.37* (1.9) | 3.59* (1.4) | 3.99 (2.7) | 8.03*** (1.5) | 9.81*** (2.2) |
| 8+ years | 18.7*** (1.8) | 8.30*** (1.5) | 28.1*** (2.2) | 12.3*** (2.4) | 12.8*** (1.8) | 11.4*** (3.1) | 13.4*** (1.9) | 21.2*** (2.6) |
| Employment (ref: employed) | ||||||||
| Not working | −3.56+ (1.9) | −1.48 (1.5) | −5.74* (2.2) | −0.32 (2.4) | 1.41 (1.8) | 0.15 (3.0) | −0.30 (1.9) | −2.23 (2.5) |
| Homemaker | −4.10+ (2.4) | −1.49 (2.0) | −4.70 (2.9) | −1.56 (3.2) | 0.53 (2.4) | −0.81 (4.1) | −0.39 (2.5) | −2.50 (3.3) |
| Wealth index (ref: Q. 1) | ||||||||
| Quintile 2 | 3.80* (1.9) | −0.073 (1.6) | 2.62 (2.3) | −1.90 (2.6) | −0.56 (1.9) | −6.65+ (3.7) | 2.21 (2.1) | −2.08 (3.0) |
| Quintile 3 | 10.3*** (1.9) | 0.92 (1.5) | 5.85** (2.2) | −1.99 (2.4) | −0.14 (1.9) | −5.99+ (3.4) | 2.70 (2.0) | −3.39 (2.9) |
| Quintile 4 | 7.62*** (2.0) | 1.75 (1.7) | 9.19*** (2.4) | 1.57 (2.6) | 1.74 (2.0) | −1.10 (3.7) | 6.05** (2.1) | 1.68 (2.9) |
| Quintile 5 | 11.7*** (2.1) | 3.23+ (1.7) | 11.0*** (2.5) | 1.57 (2.7) | 1.43 (2.0) | −4.49 (3.6) | 9.11*** (2.2) | 4.69 (3.0) |
| Depression (ref: CESD 0) | ||||||||
| CESD Score 1 | 0.88 (2.1) | 2.15 (1.7) | −3.42 (2.5) | −3.49 (2.7) | 1.32 (2.1) | 0.97 (3.6) | 3.10 (2.2) | −0.60 (2.9) |
| CESD Score 2 | 0.14 (2.2) | 1.39 (1.8) | −5.66* (2.7) | −2.67 (2.9) | −2.03 (2.2) | 4.58 (3.9) | 2.31 (2.3) | −2.13 (3.1) |
| CESD Score 3+ | −1.71 (2.3) | 0.58 (1.9) | −4.15 (2.8) | −4.46 (3.1) | 2.00 (2.3) | 0.61 (4.1) | 4.40+ (2.5) | −0.64 (3.3) |
| Current drinker (ref: Nondrinker) | −2.46 (1.6) | −3.11* (1.4) | −8.98*** (2.0) | 1.35 (2.2) | −2.41 (1.6) | 3.55 (3.0) | −4.89** (1.8) | −0.83 (2.5) |
| Has ADLs (ref: none) | 0.74 (2.6) | 2.65 (2.2) | 0.024 (3.2) | −1.58 (3.5) | −1.62 (2.6) | 2.37 (4.9) | −3.62 (2.8) | −5.97 (3.9) |
| Observations | 1,398 | 1,398 | 1,398 | 1,398 | 1,398 | 951 | 1,348 | 893 |
Note: Standard errors in parentheses. +p < 0.10. *p < 0.05. **p < 0.01. ***p < 0.001.
The most consistent finding was the association of education with OCS-Plus scores across all cognitive domains. Furthermore, as expected, age was associated with all but two (semantics and attention tasks) of the eight OCS-Plus measures. We note that significant differences in performance were found only in the older age group.
Household wealth quintile ranking—an important indicator of socioeconomic conditions in this population—was associated with picture naming and semantics, orientation, rule finding, and attention scores. Alcohol consumption was also significantly related to OCS-Plus measures of semantics, orientation, and rule finding. This category of the measures included a broad range of respondents who reported consuming any alchohol in the past 30 days. Depressive symptoms were negatively associated with orientation and picture naming but not with any other scores. Employment was unrelated to cognition except for two significant associations with orientation and picture naming, although few respondents in our study were employed and many were receiving old-age pensions. Convergent validity was established with consistent associations of OCS-Plus scores with age, education, and wealth. Validity was further demonstrated with the association of alcohol consumption with lower cognitive function. Depressive symptoms were less consistently associated with cognitive outcomes.
To assess divergent validity, or the independence of measures, we examined associations between OCS-Plus and ADL disability, which captures major physical impairment (see Table 2 results). We anticipated no relationship with cognitive function except among the most severely impaired AD respondents. Our analyses found that no OCS-Plus measures were associated with the ADL measure, suggesting divergent validity, since our validity sample excluded respondents likely to have severe dementia. We will be able to confirm this further with longitudinal analyses over the next years with additional waves of data and continued more detailed examination of those most likely to have Alzheimer’s Disease or related dementias (ADRD).
We assessed the interaction between age and education in regression models with the same covariates. Weak positive interactions (p < .05) were observed for orientation and picture naming, suggesting that education might protect against cognitive decline at older ages (data not shown). It is important to note that we had both age and cohort effects in the cross-sectional sample and were not able to examine the protective effects against decline in cognition as one could with longitudinal data. Future longitudinal data will enable us to distinguish true age-related declines from cohort effects.
Discussion
The innovative tablet-based OCS-Plus approach bypasses limitations of paper-and-pencil assessments and builds on the increasing familiarity with electronic devices now common even in many low-income countries. Indeed, we found high task compliance and good validity of the OCS-Plus in our large, low-education, low-income sample from the rural South African community of Agincourt. We highlight some critical advantages offered by the OCS-Plus platform in: standardization of administration through scripted instructions; use of visually oriented and simple language tasks that minimize cultural and literacy confounds; and automatic scoring of performance with minimal interviewer input or bias, allowing for significant gains in speed and process of data collection and management. This suggests that OCS-Plus is highly suitable as a cognitive screen within large epidemiological studies, in a variety of cultural and socioeconomic settings. Although the tablet for this study was in a prototype stage it is now being adapted for tablet-based assessments that are more easily and economically implemented. These will be field tested in the coming year avoiding one of the disadvantages of the current OCS-Plus. Its use may increase our ability to understand whether cross-country comparisons reflect genuine differences in risks, giving us important etiologic clues as to the causes and prevention of ADRD and domain specific cognitive declines. To date, our findings underscore the similar age and education patterns seen in other low, middle, and high income countries. Although longitudinal data will be more informative regarding age-related declines in cognition, our findings suggest that some of these patterns may be virtually universal even as we enrich our understanding of cognition in low literacy settings (Huang & Zhou, 2013; Kalaria et al., 2008; D. Weir, Lay, & Langa, 2014).
The range of cognitive scores reported in this study demonstrates that OCS-Plus avoids floor and ceiling effects present in other short cognitive screens based primarily on language and memory domain measures. For both domain-specific and domain-general measures, there is a strong effect of education level. Our findings also show that age-related associations with such cognitive domains as language and orientation may be stronger among those with lower levels of education. One possible mechanism by which education may protect against age-related decline is through the construct of cognitive reserve (Stern, 2012), which proposes an experience-dependent neuroprotective mechanism. This includes factors such as professional attainment, intelligence, and mental stimulation. Strong effects of education in all age ranges suggest that indeed education increases capacity to deal with complex cognitive tasks and preserves function by either enhancing cognitive reserves earlier in life (at time of education) or preserving function through the maintenance of cognitive abilities through behavioral interactions that occur over a lifetime, which has been suggested to repeatedly activate the noradrenergic system (Robertson, 2013). Since the finding in the Dementia Study Project (Del Ser, Hachinski, Merskey, & Munoz, 1999), the neuroprotective effects of education on cognitive decline have been reported numerous times in epidemiological studies.
We must nonetheless interpret these findings very cautiously because they may also still reflect selection processes—especially for older cohorts of respondents whose cognitive abilities may have increased their chances of acquiring higher levels of education even during the period of apartheid and in this setting with limited access to education. Associations with education may also reflect increase famililarity with computers which can alter reliability (Browndyke et al., 2002; Schatz & Browndyke, 2002). Our longitudinal analyses over the next years will enable us to sort this out by observing true age effects and genuine decline in cognition from cohort effects. With further waves of follow up, we will understand better the degree to which education is likely to lead to declines in cognition or interact with age to “protect” against age related declines. This will help us to infer the causal effect of education, though it is not definitive since we do not have an experimental approach to test this association. It will help us to avoid reverse causation but not to rule out the impact of other unobserved conditions. Furthermore, we demonstrate independence of verbal recall and domain-general measures, a critical finding that suggests suitability of our assessment for distinguishing between various types of neurodegeneration, for detection beyond memory decline typical of Alzheimer’s dementia. Another limitation relates to the administration of our assessments. Some measures were not optimally harmonized. In particular, the delayed word recall was not standardized in the time between initial delivery and delayed recall or in number of items between the OCS-Plus and the CAPI version limiting our analytic ability. In future studies, we will harmonize these aspects of the assessment and for longitudinal assessments we will consider prior testing experience since this may be critical in assessing changes over time (T. A. Salthouse, 2016).
We also note that OCS-Plus collects a variety of performance and timing information not reported here, although it should be acknowledged that the predictive utility of these data for distinguishing normative cognitive decline from more severe levels of impairment will be explored in future papers. These measures include, but are not limited to, reaction times, commission errors, reversals—all potentially very important in the context of age-related cognitive decline (Sylvain-Roy, Lungu, & Belleville, 2015; Vasquez, Binns, & Anderson, 2016). For example, decline and increased variability in speed and efficiency of information processing may be an important marker of cognitive decline (Der & Deary, 2006; T. Salthouse, 2000, 2009). These can also help predict incident cognitive impairment independent of age (Bielak, Hultsch, Strauss, MacDonald, & Hunter, 2010; Kochan et al., 2013), which has led to the intriguing suggestion that measures of reaction time may represent an index of general neurological integrity at the biological level (Nilsson, Thomas, O’Brien, & Gallagher, 2014).
Conclusion
The tablet-based OCS-Plus assessment provides domain-specific (language and memory) and domain-general (executive and attention) measures of cognition with minimal language content, improving sensitivity and rigor of epidemiological studies by minimizing language and cultural confound effects and examiner bias, while providing a comprehensive cognitive profile as a tool for early detection of multi-domain decline. OCS-Plus may therefore prove to be critical in understanding the global epidemiology of dementias, but can also translate more broadly to a better understanding of cognition and cognitive decline in populations, across a wide range of education levels. Our work moves the field forward to create the next generation of standardized, sensitive, and validated methods of cognitive assessment likely suitable for large-scale population study settings.
Supplementary Material
Please visit the article online at http://psychsocgerontology.oxfordjournals.org/ to view supplementary material.
Funding
This work was supported by the National Institute on Aging at the National Institute of Health (1P01AG041710-01A1) HAALSI—Health and Aging in Africa: Longitudinal Studies of INDEPTH Communities; (1R01AG051144–01) An Innovative Language Controlled Tablet-Based Cognitive Test: Harmonizing Dementia Screening Across High and Low Literacy Countries, and the National Institute of Health (3U54HG006938-03S1) Supplement to the AWI-Gen Collaborative Centre. N. Demeyere is supported by the Stroke Association UK (TSA LECT 2015/02) and the National Institute Health Research Oxford Cognitive Health Clinical Research Facility. The Agincourt HDSS was supported by the Wellcome Trust, UK (058893/Z/99/A, 069683/Z/02/Z, 085477/Z/08/Z, and 085477/B/08/Z), the University of the Witwatersrand and South African Medical Research Council.
Acknowledgments
We would like to acknowledge the contribution that Professor Glyn Humphreys made to advancing work in cognitive neuroscience around the world. Professor Humphreys died on January 14, 2016 while continuing this work.
References
Author notes
Correspondence should be addressed to Mihaela D. Duta, PhD, Department of Experimental Psychology, 9 South Parks Road, Oxford OX1 3UD, UK. E-mail: mihaela.duta@psy.ox.ac.uk
Decision Editor: Bob G. Knight, PhD

