


Abstract
Alterations in circuits involving the amygdala have been repeatedly implicated in schizophrenia neuropathology, given their role in stress, affective salience processing, and psychosis onset. Disturbances in amygdala whole-brain functional connectivity associated with schizophrenia have yet to be fully characterized despite their importance in psychosis. Moreover, it remains unknown if there are functional alterations in amygdala circuits across illness phases. To evaluate this possibility, we compared whole-brain amygdala connectivity in healthy comparison subjects (HCS), individuals at high risk (HR) for schizophrenia, individuals in the early course of schizophrenia (EC-SCZ), and patients with chronic schizophrenia (C-SCZ). We computed whole-brain resting-state connectivity using functional magnetic resonance imaging at 3T via anatomically defined individual-specific amygdala seeds. We identified significant alterations in amygdala connectivity with orbitofrontal cortex (OFC), driven by reductions in EC-SCZ and C-SCZ (effect sizes of 1.0 and 0.97, respectively), but not in HR for schizophrenia, relative to HCS. Reduced amygdala-OFC coupling was associated with schizophrenia symptom severity (r = .32, P < .015). Conversely, we identified a robust increase in amygdala connectivity with a brainstem region around noradrenergic arousal nuclei, particularly for HR individuals relative to HCS (effect size = 1.54), but not as prominently for other clinical groups. These results suggest that deficits in amygdala-OFC coupling could emerge during the initial episode of schizophrenia (EC-SCZ) and may present as an enduring feature of the illness (C-SCZ) in association with symptom severity but are not present in individuals with elevated risk for developing schizophrenia. Instead, in HR individuals, there appears to be increased connectivity in a circuit implicated in stress response.
Introduction
Schizophrenia is a devastating neuropsychiatric disease associated with altered brain functional connectivity.1–6 A growing body of research implicates the amygdala in the limbic and cortical dysfunction associated with schizophrenia.7–14 First, amygdala has a widely distributed connectivity with both cortical and subcortical networks.15,16 Second, amygdala neurochemistry and physiology are sensitive to stress, a factor that may contribute to schizophrenia-related psychopathology.17 Third, amygdala activation has been implicated in aberrant salience, a factor possibly contributing to the emergence of positive symptoms.18,19 Finally, amygdala hyperactivity can compromise the activation of prefrontal networks, perhaps contributing to functional impairment in schizophrenia patients.20–22 Despite the potential importance of understanding amygdala-related dysfunction in schizophrenia, disturbances in its functional connectivity associated with this illness have yet to be fully characterized.
The functional connectivity of the amygdala can be studied by analyzing the low-frequency fluctuations present in the blood oxygenation level-dependent (BOLD) signal at rest with the use of resting-state functional connectivity magnetic resonance imaging (rs-fcMRI).23–25 Moreover, rs-fcMRI provides a powerful tool to characterize large-scale connectivity disruptions in neuropsychiatric disease,23,26 as illustrated by studies investigating cortical dysconnectivity in schizophrenia.2,26 This approach could potentially be sensitive to functional changes associated with schizophrenia that may occur between the amygdala and other large-scale neural systems.14,15
Functional connectivity studies may also shed light on the changes in brain function associated with the emergence and progression of schizophrenia27—building from the period of increased risk, to the initial episode of psychosis, to long-standing illness. Recent investigations have shown compelling evidence for amygdala connectivity alterations in schizophrenia.14,28 However, relatively few studies have directly examined amygdala connectivity alterations across illness phases. Such a knowledge gap makes it difficult to infer whether the transitions from being at risk for the illness, to the initial diagnosis, to a more chronic illness phase are possibly associated with unique amygdala connectivity alterations. Given its central role in stress, amygdala could be an important contributor to onset and progression of this illness. Yet, it remains unknown whether amygdalar whole-brain connectivity differs across distinct illness stages.
To address this question, the current cross-sectional study directly compared amygdala whole-brain functional connectivity across 4 groups: healthy comparison subjects (HCS), subjects at high risk for developing schizophrenia (HR), individuals in the early course of schizophrenia (EC-SCZ; on average, within 5 months of symptom onset), and patients diagnosed with chronic schizophrenia (C-SCZ; on average, 5 years of illness duration). We hypothesized that (1) functional connectivity abnormalities of the amygdala and frontal cortical structures may emerge in association with the onset of schizophrenia, a marker that would differ from HR individuals and (2) across individuals, the magnitude of the disturbance in amygdala-frontal connectivity would correlate with the severity of schizophrenia symptoms.
Methods
Participants
C-SCZ, EC-SCZ, and HR participants were recruited from the outpatient clinics of the Department of Psychiatry, First Affiliated Hospital of China Medical University, Shenyang, China. Participants older than 18 years were independently diagnosed by 2 trained psychiatrists using the Structured Clinical Interview for DSM-IV Axis I Disorders (SCID)29 translated to Chinese (http://www.scid4.org/trans.html). Participants younger than 18 years were diagnosed using the Schedule for Affective Disorders and Schizophrenia for School-Age Children-Present and Lifetime Version (K-SADS-PL).30
Patients met Diagnostic and Statistical Manual of Mental Disorders, Fourth Edition (DSM-IV) diagnostic criteria for schizophrenia, schizophreniform, or brief psychotic disorder, but no other Axis I diagnosis. Subjects were allowed to have a history of nicotine and alcohol use, but no current nicotine, alcohol, or drug abuse/dependence. No participants reported past history of alcohol and drug dependence. While comorbidity of substance abuse is frequent in schizophrenia,31 the incidence of such comorbidity is quite low for the area where participants were recruited (F. Wang, PhD, personal communication). Forty-eight patients with schizophrenia participated in the study (table 1), out of which 28 met criteria for early illness course (ie, within 1 y of their initial clinical presentation, mean = 4.27 mo of illness duration). This duration was calculated by deducting the age at the onset of first evident symptoms (reported by the participants and confirmed with other resources, such as existing medical records and close relatives) from participant’s age at the time of the scan. All early-course patients were followed up and confirmed to meet DSM-IV criteria for diagnosis of schizophrenia by trained clinicians. Chronic patients were defined as having met diagnostic criteria for at least 12 consecutive months. Most C-SCZ patients reported past 5 years of illness duration (mean = 64.45 mo). Twenty-one HR subjects were offspring of individuals with schizophrenia (at least 1 parent) who had not passed through the age of peak illness risk (<30 years old), to ensure subjects were still within the elevated risk period for developing the illness. All HR subjects had to meet identical inclusion criteria as controls (see below).
Clinical and Demographic Characteristics
| Characteristic | HCS (N = 96) | C-SCZ (N = 20) | EC-SCZ (N = 28) | HR (N = 21) | Significance | |||||
|---|---|---|---|---|---|---|---|---|---|---|
| Mean | SD | Mean | SD | Mean | SD | Mean | SD | F/T Value Chi-square | P Value (2 Tailed) | |
| Age (y) | 28.84 | 10.51 | 31.43 | 8.20 | 25.00 | 9.70 | 19.95 | 5.24 | 6.73 | <.001a |
| Gender (% male) | 45 | — | 45 | — | 43 | — | 57 | — | 1.23 | .75 |
| Father’s occupational status | 37.63 | 22.69 | 28.79 | 18.25 | 34.54 | 19.39 | 30.22 | 14.43 | 1.28 | .28 |
| Mother’s occupational status | 36.67 | 21.89 | 37.06 | 22.48 | 34.00 | 19.72 | 31.26 | 15.14 | 0.38 | .77 |
| Participant’s education (y) | 14.79 | 3.11 | 11.48 | 3.52 | 11.54 | 3.02 | 12.70 | 2.83 | 13.06 | <.001a |
| Handedness (% right) | 88.54 | — | 90.00 | — | 78.57 | — | 71.43 | — | 8.97 | .44 |
| Medication-CPZ equivalents | — | — | 240.00 | 132.22 | 96.40 | 71.33 | — | — | 2.67 | <.01a |
| % treated | — | — | 95.00 | 43.00 | — | — | 13.86 | <.001a | ||
| BPRS total symptoms | — | — | 25.56 | 10.58 | 36.67 | 15.68 | 18.11 | 0.46 | 14.42 | <.001a |
| Duration of illness (mo) | — | — | 64.45 | 38.26 | 4.27 | 3.20 | — | — | 8.32 | <.001a |
| Signal-to-noise | 177.47 | 49.82 | 195.58 | 52.87 | 173.44 | 57.37 | 160.93 | 41.30 | 2.10 | .10 |
| % Frames scrubbed | 8.63 | 12.69 | 8.26 | 6.62 | 8.07 | 6.46 | 12.52 | 13.01 | 0.67 | .61 |
Note: BPRS, Brief Psychiatric Rating Scale; CPZ, chlorpromazine (equivalents). Groups: C-SCZ, chronic schizophrenia; EC-SCZ, early-course schizophrenia; HCS, healthy comparison subjects; HR, high risk. Age, education levels, and age at diagnosis are expressed in years; duration of illness is expressed in months. No participants had current alcohol/drug use or past history of drug dependence. The occupation status (socioeconomic status) of the participants’ parents was used as a proxy for educational attainment and was scored according to the International Socio-Economic Index of Occupational Status (ISEI).76 CPZ equivalents were calculated using recently revised approaches.33
aSignificant F statistic for the 1-way between-group ANOVA.
Finally, 96 demographically matched HCS were recruited from the China Medical University community by advertisement. HCS were selected to be mean-matched to subjects from each of the 3 other groups (HR, EC-SCZ, and C-SCZ) by age, sex, ethnicity, handedness, and parental socioeconomic status, rather than individual educational attainment. HCS underwent a clinical evaluation using the SCID or K-SADS-PL. HCS met the following inclusion criteria: (1) no current or lifetime Axis I disorder (determined by a trained psychiatrist); (2) no history of medical or neurological conditions; and (3) no history of psychotic, mood, or other Axis I disorders in first-degree relatives (reported by detailed family history).
Participants were excluded if they had (1) history of neurological conditions (eg, epilepsy, migraine, head trauma, loss of consciousness); (2) any MRI contraindications; and (3) any concomitant major medical disorder. As expected, education attainment and age was uneven across groups (P = .01). Critically, adjusting for educational attainment, age, and medication did not alter any reported findings (see figures 5 and 6 for detailed age analyses). All participants provided informed consent approved by the Institutional Review Board of China Medical University and Yale University.
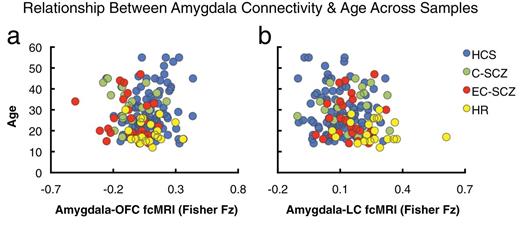
Relationship between amygdala connectivity and age across samples. Given that age is a key between-group difference variable across the 4 examined samples, we conducted a follow-up validity check analysis to ensure that age is not significantly related to any of the main between-group effects. Here, we show the relationship between age across all participants and amygdala-orbitofrontal cortex (OFC) (a) and amygdala-brainstem connectivity (b). There was no significant relationship between age and reported connectivity effects for the OFC region (OFC: r = .07, P = .37, n.s., nonsignificant). However, across all subjects (N = 165), there was a modest, but significant relationship between amygdala-brainstem connectivity and age (brainstem: r = −.19, P < .02, 2 tailed). Nonetheless, as evident from the plot, the HR group (yellow) was shifted to the right (increased connectivity) relative to all other groups (lower right quadrant of plot b), suggesting specifically elevated amygdala-brainstem connectivity. Moreover, age, when used as a covariate, did not alter the between-group ANOVA F-test. Nonetheless, we conducted an additional age-matched follow-up analysis to ensure that brain maturity was not a confounding variable for the brainstem effect (see figure 6). Groups: C-SCZ, chronic schizophrenia; EC-SCZ, early-course schizophrenia; HCS, healthy comparison subjects; HR, high risk.
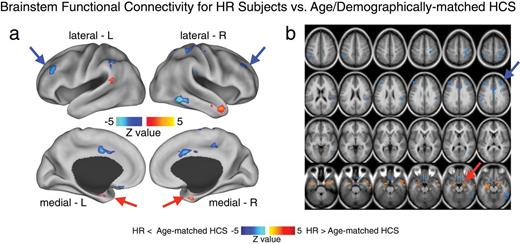
Brainstem region functional connectivity for high-risk subjects (HR) vs age- and demographically matched healthy comparison subjects (HCS). Given the somewhat unexpected amygdala-brainstem connectivity finding, driven by the HR group, we compared connectivity patterns for the identified brainstem region between HR subjects and a subset of age- and demographically matched HCS. This was especially important given concerns that this finding may be related to brain maturation (rather than a risk factor for developing schizophrenia or psychiatric illness more broadly). This follow-up analysis was also important to better understand other possible circuits involved in elevated amygdala-brainstem connectivity patterns found for the HR group. Therefore, we identified a subset of HCS matched to the HR group across all demographic variables, but most importantly age (mean = 19.95, SD = 4.58). (a and b) We computed an independent samples t-test between the HR group and the age-matched HCS using the identified brainstem region as a seed. Type I error corrected results revealed elevated amygdala connectivity in the HR group, given that this is a partially circular analysis (red arrows). However, the analysis also revealed reduced connectivity between the brainstem region and frontoparietal cortical regions for HR subjects relative to age-matched HCS. This analysis is partially circular and should be interpreted as qualitative to better understand the source of the amygdala-brainstem connectivity alterations in the HR group. That is, we identified the brainstem region with the between-group F-test (figure 2), which we used here to compare HR subjects relative to a specific subgroup of age-matched controls. Independence concerns notwithstanding, this post hoc analysis revealed prefrontal clusters that may contribute to altered amygdala-brainstem coupling pattern identified for the HR group. Perhaps most importantly, this age-matched follow-up analysis provides a further validity check, showing that age alone did not drive the reported amygdala-brainstem effects in the HR group.
Current Symptoms and Medication
Symptoms were evaluated by the Brief Psychiatric Rating Scale (BPRS).32 Ninety-five percent of chronic patients and 43% of early-course patients were receiving antipsychotics, which we converted to chlorpromazine (CPZ) equivalents33 (table 1). None of the identified effects correlated with CPZ equivalents. Reported effects did not change when we covaried for medication dose. Moreover, the magnitude of the effect did not differ for those patients receiving medication vs those who did not.
Data Acquisition
Imaging data were acquired on a GE Signa HDX 3.0T MR scanner. A standard 12-channel head coil was used with foam padding to minimize head motion. Participants were instructed to rest with eyes closed during scanning but were monitored to ensure they stayed awake. None of the included participants reported falling asleep during the scan when routinely asked immediately after scanning. BOLD images were acquired using a T2*-weighted gradient-echo planar imaging sequence (repetition time [TR]/echo time [TE] = 2000/30 ms, flip angle = 90°, field of view [FOV] = 24 × 24cm2, acquisition matrix = 64 × 64). Thirty-five axial slices were collected with 3 mm thickness without gap; acquisition lasted for 6.66 minutes and produced 200 volumetric images per subject. For spatial normalization and structural segmentation, high-resolution images were acquired using a T1-weighted, 3D fast spoiled gradient-echo (FSPGR) sequence (TR/TE = 7.1/3.2 ms, flip angle = 13°, FOV = 24 × 24cm2, matrix = 240 × 240 with 176 slices, each 1 mm thick without gap).
Data Preprocessing and Analysis
BOLD images were preprocessed using the following validated steps2,26: (1) slice-time correction, (2) first 5 images removed from each run, (3) rigid-body motion correction, (4) correction for magnetic field inhomogeneity, (5) 12-parameter affine transform of the structural image to the Talairach coordinate system, and (6) coregistration of volumes to the structural image with 3 × 3 × 3 mm re-sampling. All participants had to pass the following quality assurance criteria to ensure comparable BOLD quality across groups: (1) signal-to-noise ratios (SNRs) greater than 100, determined by obtaining the mean signal and SD for a given slice across the BOLD run, while excluding all non-brain voxels across all frames34; (2) no BOLD run with a single frame movement greater than 1 functional voxel; and (3) movement scrubbing as recommended by Power et al 35,36. Image frames with possible movement-induced artifactual fluctuations in intensity were identified using 2 criteria: First, frames in which sum of the displacement across all 6 rigid body movement correction parameters exceeded 0.5 mm were identified (assuming 50-mm cortical sphere radius). Second, root mean square (RMS) of differences in intensity between the current and preceding frame was computed across all voxels and divided by mean intensity. Frames in which normalized RMS exceeded the value of 3 were identified. Frames flagged by either criterion were excluded, including the one preceding and 2 frames following the flagged frame. Subjects with more than 50% frames flagged were completely excluded from analyses. The final samples (table 1) had no significant SNR differences (HCS mean = 177.47; C-SCZ mean = 195.58; EC-SCZ mean = 173.44; HR mean = 160.93, P = .1, nonsignificant). All included participants passed described movement scrubbing criteria. Moreover, there were no significant differences in the mean proportions of removed frames across groups (HCS proportion flagged = 8.63; EC-SCZ proportion flagged = 8.07; C-SCZ proportion flagged = 8.26; HR proportion flagged = 12.52; table 1).
Next, to remove spurious signal in resting-state data, all BOLD time series underwent high-pass (0.009 Hz) and low-pass (0.08 Hz) temporal filtering and nuisance signal removal from ventricles, deep white matter, global mean signal (GMS), 6 rigid-body motion correction parameters, and their first derivatives using in-house Matlab tools.5 As argued previously,26 removing the GMS could complicate between-group interpretations.37 However, evidence demonstrates improvements in specificity of connectivity findings,38 following GMS removal. While controversies regarding GMS need to be resolved,39 we ensured that all groups underwent identical preprocessing. We acknowledge that prospective formal simulation and clinical studies are needed to resolve GMS removal considerations37 (see “Limitations” section).
Amygdala Seed-Based Resting-State Functional Connectivity (rs-fcMRI) Analyses
Amygdala seed-based rs-fcMRI analyses followed prior studies.26 Briefly, each amygdala seed was anatom- ically defined bilaterally for every subject via Freesurfer-based segmentation.40,41 All Freesurfer-based segmentations were inspected for quality by a trained rater (A.A.). Bilateral amygdala signal was used, given no laterality hypotheses. Prior to rs-fcMRI analyses, BOLD signal was spatially smoothed with a 6-mm full-width-at-half-maximum Gaussian kernel. Whole-brain amygdala seed maps were obtained by extracting time series across all anatomically defined bilateral amygdala voxels and computing a correlation with each voxel in the brain for each participant. Next, we computed a Fisher r-to-Z transform, yielding a Fisher-Z connectivity map for each participant where each voxel’s value represents its connectivity with bilateral amygdala.
To test hypothesized between-group differences, all single-subject maps were entered into a second-level 1-way ANOVA with 4 across-group levels (HCS, C-SCZ, EC-SCZ, and HR), which was computed within FSL’s Randomise tool.42,43 Whole-brain type I error correction was accomplished via threshold-free cluster enhancement with 10 000 permutations implemented in Randomise.44 Significant findings were visualized using Caret 5.5 (http://brainvis.wustl.edu/wiki/index.php/Caret:Download) and NeuroLens (http://www.neurolens.org) software. Group distribution plots were computed and visualized using R statistical computing environment (http://www.r-project.org). All formal effect sizes were calculated using standard approaches across subjects via Cohen’s d45 by extracting the Fisher-Z value for all subjects across all voxels showing the main effect. This was done to characterize the magnitude of between-group effects across voxels surviving the whole-brain correction, as done previously,46 and to provide an explicit guide regarding observed effects for future replication studies.
Results
Schizophrenia Is Associated with Reductions in Amygdala-Orbitofrontal Connectivity
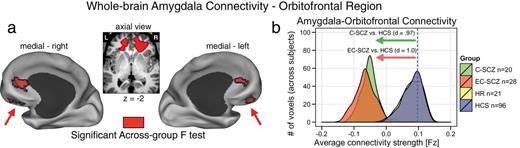
The 1-way ANOVA revealed a significant group effect in 2 bilateral prefrontal foci centered on the orbitofrontal cortex (left OFC: x = −17, y = 35, z = −2; right OFC: x = 18, y = 34, z = −1) (figure 1a). Effects remained significant after covarying and controlling for age (see figure 5) and medication. To characterize the group effect, we extracted signal out of the identified clusters across all groups, which revealed a specific reduction in amygdala-OFC coupling for C-SCZ and EC-SCZ groups relative to HCS (see table 2 for all pairwise comparisons). We also computed formal effect size estimates for both clinical groups relative to HCS45 (figure 1b), confirming marked reductions in amygdala-OFC coupling across both C-SCZ and EC-SCZ samples (Cohen’s d C-SCZ vs HCS = 0.97, P < .0001; Cohen’s d EC-SCZ vs HCS = 1.0, P < .0001). However, the difference between HR group and HCS was not significant (illustrated by completely overlapping distributions in figure 1b). Importantly, however, the HR group differed significantly from both clinical groups across the OFC cluster (Cohen’s d EC-SCZ vs HR = 1.08, P < .0015; Cohen’s d C-SCZ vs HR = 1.05, P < .0015) (see table 2). To facilitate qualitative inspection of these effects, we also computed whole-brain amygdala connectivity maps for each group that highlight the amygdala-OFC connectivity patterns without a direct contrast (figure 4). These threshold-free patterns further illustrate that the effect was driven by a reduction in connectivity for C-SCZ and EC-SCZ groups (but not for HR group). Collectively, these results not only confirm hypothesized amygdala-prefrontal connectivity alterations in schizophrenia but also suggest that identified disturbances are present across EC-SCZ and C-SCZ groups, even when explicitly controlling for age (see figures 6 and 5). While these effects did not change when covarying for CPZ equivalents, we further verified that medication did not impact these findings. Among the EC-SCZ sample, a few patients (N = 16) were not receiving any medication at the time of the scan (see table 1). This provided an additional opportunity to directly test if medication is changing the identified effect. Moreover, examining this in the first-episode sample removes the further concern that long-term polypharmacy may be driving the effect in chronic patients (irrespective of the immediate medication status at the time of the scan). Therefore, if medication was, in any way, driving the observed effects, we would predict that medicated first-episode patients would show a difference relative to unmedicated first-episode patients. To this end, we directly compared medicated vs unmedicated first- episode subjects, which did not reveal a significant difference [t(26) = 1.3, P = .2].
Pairwise Comparisons: Region Coordinates, P values, and Effect Sizes
| x | y | z | Hemisphere | Anatomical Landmark | Cohen’s d | t Value | P Value | |
|---|---|---|---|---|---|---|---|---|
| HCS vs C-SCZ | 0.97 | 3.93 | .000 | |||||
| HCS vs EC-SCZ | 1.00 | 4.75 | .000 | |||||
| −17 | 35 | −2 | Left | Medial OFC (BA 47/10) | HCS vs HR | 0.01 | 0.06 | .954 |
| 18 | 34 | −1 | Right | Medial OFC (BA 47/10) | HR vs C-SCZ | 1.05 | 3.35 | .002 |
| HR vs EC-SCZ | 1.08 | 3.66 | .001 | |||||
| C-SCZ vs EC-SCZ | 0.07 | 0.24 | .814 | |||||
| 2 | −40 | −26 | Midline | Brainstem | HCS vs C-SCZ | 0.48 | 2.04 | .044 |
| HCS vs EC-SCZ | 0.59 | 2.68 | .008 | |||||
| HCS vs HR | 1.55 | 6.90 | .000 | |||||
| HR vs C-SCZ | 1.00 | 3.21 | .003 | |||||
| HR vs EC-SCZ | 1.09 | 3.82 | .000 | |||||
| C-SCZ vs EC-SCZ | 0.04 | 0.15 | .878 |
Note: OFC, orbitofrontal cortex. Abbreviations are explained in the first footnote to table 1. Effect sizes reflect standard Cohen’s d estimates for each group relative to the HCS group.45 For parsimony, we collapsed estimates across left and right OFC clusters given highly comparable effect sizes. All effect size calculations were computed via standard approaches across subjects via Cohen’s d45 to characterize the magnitude of between-group effects across voxels surviving the whole-brain correction.
Schizophrenia is associated with reductions in amygdala-orbitofrontal connectivity. (a) Red foci mark the regions surviving the whole-brain 1-way ANOVA F-test. Both chronic (C-SCZ) and early-course (EC-SCZ) schizophrenia groups showed significantly decreased amygdala connectivity relative to healthy comparison subjects (HCS), whereas high-risk (HR) individuals showed no significant alterations. This pattern was centered on the bilateral medial orbitofrontal cortex (OFC) (left OFC: x = −17, y = 35, z = −2; right OFC: x = 18, y = 34, z = −1). (b) Effect sizes (Cohen’s d) verify robust amygdala-OFC connectivity reductions for C-SCZ (green histogram) and EC-SCZ (red histogram) groups, whereas the HR (yellow histogram) did not exhibit changes relative to HCS (yellow histogram completely beneath the blue histogram). Blue vertical dashed line marks the mean for the HCS group. Note: the voxel counts on the y-axis reflect the mean voxel number for each group at a given connectivity strength within the identified region.
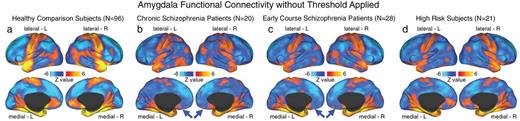
Unthresholded whole-brain amygdala functional connectivity patterns across groups. We highlight amygdala connectivity at the whole-brain level for (a) healthy comparison subjects (HCS; N = 96); (b) chronic schizophrenia patients (C-SCZ; N = 20); (c) early-course schizophrenia patients (EC-SCZ; N = 28); and (d) High-risk subjects (HR; N = 21). The purpose of this unthresholded analysis was to facilitate visual inspection of normative amygdala connectivity patterns relative to connectivity patterns across the 2 patient groups and HR individuals. This allows qualitative visualization of orbitofrontal cortex (OFC) connectivity reductions across clinical groups (blue arrows). These patterns further support the hypothesis that there exists a reduction in amygdala-OFC connectivity for C-SCZ and EC-SCZ groups, relative to HCS. Importantly, HCS showed robust positive amygdala-OFC connectivity consistent with primate anatomy studies22 (see panel a).
HR Individuals Show Increased Amygdala-Brainstem Connectivity
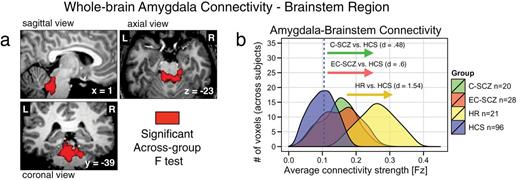
The whole-brain type I error-corrected amygdala connectivity analyses also revealed a brainstem region localized around arousal nuclei encompassing the locus coeruleus (LC: x = 2, y = −40, z = −26) (figure 2a). Somewhat unexpectedly, the effect was driven by an increase in amygdala-brainstem coupling, which was prominent for the HR group relative to HCS (Cohen’s d HR vs HCS = 1.54, P < .0001). A significant elevation in amygdala-brainstem coupling was present for the 2 clinical groups (Cohen’s d C-SCZ vs HCS = 0.48, P < .05; Cohen’s d EC-SCZ vs HCS = 0.6, P < .01), but the effect for clinical groups was attenuated relative to that found for the HR group (Cohen’s d C-SCZ vs HR = 1.00, P < .003; Cohen’s d EC-SCZ vs HR = 1.09, P < .001). Although not predicted a priori, this finding was identified using identical whole-brain stringency criteria as for the amygdala-OFC result and was highly robust for the HR group (evident from effect size calculations, see table 2). Given that age was a key possible moderating variable here (reflecting brain maturation), we conducted follow-up analyses, ruling out age as a likely confound (figures 5 and 6). Post hoc exploratory age-matched analyses using the brainstem region as a seed suggest that the elevated brainstem-amygdala connectivity in HR individuals may be related to alterations in prefrontal function (even when explicitly compared with age-matched HCS; figure 6). As for the OFC effect, we verified that the patterns did not differ for medicated vs unmedicated EC-SCZ patients [t(26) = 1.16, P = .26].
High-risk (HR) individuals show increased amygdala-brainstem connectivity. (a) The red focus marks a brainstem region (x = 2, y = −40, z = −26) surviving the whole-brain 1-way ANOVA F-test where the HR group showed increased amygdala connectivity relative to HCS, but a more modest increase was found for C-SCZ and EC-SCZ patient groups. (b) Effect size calculations (Cohen’s d) highlight marked increases in amygdala-brainstem connectivity for the HR group (yellow histogram), around a brainstem region typically implicated in arousal and stress response. Blue vertical dashed line marks the mean for the HCS group. Groups: C-SCZ, chronic schizophrenia; EC-SCZ, early-course schizophrenia; HCS, healthy comparison subjects.
BPRS Symptom Severity Predicts Reduced Amygdala-Prefrontal Connectivity
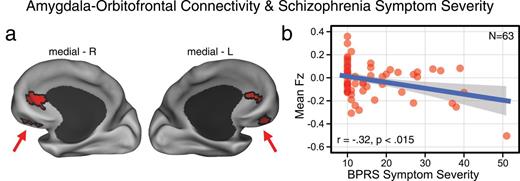
Here, we focused symptom correlation analyses on the amygdala-OFC findings because the brainstem findings were largely driven by the HR group, as opposed to symptomatic groups (ie, EC-SCZ and C-SCZ). Moreover, we avoided examining brainstem symptom effects to reduce the need for more stringent multiple comparisons protection. We specifically correlated BPRS-derived measure of schizophrenia symptoms47 (see figure 3 legend for detail) with the average signal from OFC regions that revealed significant group effects, extracted for each subject. Findings revealed a significant negative linear relationship between BPRS symptoms and amygdala-OFC connectivity across subjects (r = −.32, P < .015, 2 tailed). Since a number of HR subjects had few measurable symptoms at the time of assessment, the data were non-normally distributed. Thus, we verified results via a Spearman’s correlation (ρ = −0.25, P < .05, 2 tailed). Of note, the Spearman’s correlation (ρ = −0.21) and the Pearson’s correlation (r = −.17) were attenuated at trend level when controlling for outlier effects. Together, findings indicate that those individuals with lowest amygdala-OFC connectivity exhibited the most severe symptoms as measured via BPRS. Lending validity to this observation, there was no significant relationship between severity of all other (nonschizophrenia related) BPRS symptoms and amygdala-OFC connectivity. Also, post hoc exploratory positive symptom analyses revealed significant relationships with amygdala-OFC connectivity for the conceptual disorganization (r = −.36, P < .005) and unusual thought content (r = −.33, P < .01) items (surviving Bonferroni correction), but not suspiciousness or hallucinatory behavior.
Amygdala-prefrontal connectivity and Brief Psychiatric Rating Scale (BPRS) schizophrenia symptom severity. (a) Group-level statistical map as shown in figure 1. Average coupling with the amygdala was extracted out of these clusters across all subjects for C-SCZ, EC-SCZ and high-risk (HR) groups. (b) Inverse relationship between bilateral amygdala-orbitofrontal cortex (OFC) coupling and a subset of BPRS symptoms related to schizophrenia psychopathology (both positive and negative32) captured across all patients and HR subjects (r = −.32, P < .015, 2 tailed), which remained significant when adjusting for nonnormality (ρ = −0.25, P = .05, 2 tailed). The scale on the x-axis captures a BPRS severity index that is the sum of 10 items relating to schizophrenia psychopathology (unusual thought content, hallucinations, blunted affect, emotional withdrawal, conceptual disorganization, suspiciousness, mannerisms and posturing, uncooperativeness, hostility, and grandiosity) ranging from 10 (absent) to 100.47 Of note, 6 subjects did not have complete BPRS scores and were excluded from this analysis. Groups: C-SCZ, chronic schizophrenia; EC-SCZ, early-course schizophrenia.
Discussion
The principal finding revealed reductions in amygdala-OFC connectivity for the EC-SCZ and C-SCZ groups, but not HR subjects. Further, the extent to which amygdala-OFC connectivity was decreased correlated with symptom severity, particularly conceptual disorganization (ie, disturbances in the organization of thought), and unusual thought content. These cross-sectional data suggest that emergence of psychosis may reflect the development of a disturbance in amygdala functional connectivity with the OFC. Moreover, symptom severity was associated with the magnitude of this connectivity alteration, possibly suggesting a state-dependent alteration. We also found increased amygdala-brainstem coupling, around the LC, especially for HR subjects. Therefore, in HR individuals, there appears to be particularly increased connectivity along a circuit implicated in stress response (ie, amygdala-brainstem), a factor implicated in risk for psychiatric disorders.20
Amygdala-Orbitofrontal Connectivity Is Altered in Chronic and Early-Course Patients
The schizophrenia literature widely implicates the prefrontal cortex as a source of circuit dysfunction and functional impairment in schizophrenia.48 Indeed, there is evidence from structural diffusion tensor imaging studies in schizophrenia that loss of structural integrity in prefrontal pathways may impair the regulation of limbic regions.49,50 Additional studies identify amygdala as a source of local circuit impairment in schizophrenia.18,51–53 Importantly, the current study did not identify a distributed global impairment of amygdala functional connectivity in schizophrenia across widespread cortical regions, as one may have predicted if amygdalar function with distributed cortical systems was grossly abnormal. Therefore, the current data suggest that the primary abnormality in symptomatic patients may occur in amygdala-OFC connectivity, in line with meta-analyses suggesting possible subtle alterations in amygdala activation in schizophrenia.7,54 Our findings are also consistent with prior amygdala connectivity studies in C-SCZ patients,14 studies comparing patients and their unaffected parents,13 as well as investigations comparing bipolar illness to schizophrenia.28 All of these recent investigations reported alterations in amygdala-prefrontal circuits. Yet, to our knowledge, this is the first investigation to show similar patterns of disturbances in amygdala-OFC coupling during early course and more chronic illness phases.
This study also raises the question of why amygdala-OFC functional connectivity is so different for HR subjects (who are at risk for developing schizophrenia or possibly other psychiatric conditions) and the EC-SCZ subjects (who have recently transitioned to overt illness). One possibility is that subjects in the HR group will never develop schizophrenia or any psychiatric illness. Alternatively, a percentage of HR individuals may progress to schizophrenia55,56 or may transition to other psychiatric disorders.57 Thus, it is possible that within the HR group, there is a subset of individuals who would show a connectivity pattern more similar to that of the EC-SCZ group eventually. A corollary of this hypothesis is that the subgroup that may convert to schizophrenia would similarly show progressive changes in amygdala functional connectivity, in line with the findings in the EC-SCZ/C-SCZ groups. Prospective longitudinal studies examining prodromal samples are needed to address this hypothesis.
The data also suggest that the connectivity changes scale with symptom severity rather than with other dimensions explored in this study, as the findings did not change when adjusted for age, sex, medication status, and socioeconomic status. Further, exploratory analyses show that the relationships held strongly for unusual thought content and conceptual disorganization. The absence of differences between the EC-SCZ and C-SCZ groups in this study suggests that this dimension of amygdala connectivity dysfunction may not exhibit markedly progressive alterations. Nevertheless, illness progression may be captured by other features of distributed cortical functional connectivity,58 not examined here.
It is also important to briefly acknowledge some similarities and differences between a recent focused amygdala study comparing schizophrenia and bipolar illness conducted by Liu and colleagues.28 Liu and colleagues studied different amygdala subdivisions (ie, laterobasal and centromedial vs superficial amygdala) and found that patients with schizophrenia showed lower connectivity with medial prefrontal cortical areas that were somewhat superior from the ones reported here. Segmenting the amygdala into specific subregions may have produced a different and perhaps more complex pattern of findings, given the known differences in functional connectivity across the subnuclei.25 Moreover, the samples differed between these 2 experiments, resulting in possible heterogeneity. Finally, present effects were driven by 2 clinical groups (early-course and chronic patients, N = 48 subjects), nearly 3 times the sample size reported by Liu and colleagues. In that sense, it may be possible that differences in the size and composition of the samples as well as the design of the present study resulted in more specific power to detect OFC alterations in schizophrenia.
Amygdala-Brainstem Connectivity Is Increased in HR Individuals
This study identified a somewhat unexpected, but distinctive pattern of increased amygdala connectivity in the HR group in a circuit implicated in the stress response.59–61 The finding of prominently increased amygdala-brainstem functional connectivity for the HR group is consistent with the well-known interplay of these regions in stress response, which could be altered in HR subjects.61 Put simply, the limbic-brainstem circuitry may be altered in individuals at increased risk for developing any psychiatric illness.
The present investigation did not evaluate LC function directly and is, thus, limited to specifically inform our understanding of the functional significance of this observation. However, these brainstem nuclei are the primary location of noradrenergic innervation for the cortex.61 Moreover, limbic system and noradrenergic input have been implicated in cortical signal processing related to attention, salience, and anxiety.62–68 Critically, the LC is also known to densely project to the amygdala59,60 and is innervated by the central nucleus of the amygdala.69–72 One possibility is that the marked increase in amygdala-brainstem coupling for the HR group reflects an elevated response to stressful stimuli (or a potentially compromised regulation of the stress response pathways more broadly). Also, a number of studies have found that stimulating the LC induces elevated anxiety.62–68 Prior work postulated that such increases in anxiety and/or stress may reflect the LC potentiation of excitatory pathways onto the amygdala.61 It was also demonstrated that cells in the central nucleus of the amygdala containing corticotrophin-releasing factor may in turn stimulate LC activity in response to stress,73 providing one mechanism for how stressful stimuli could potentiate this circuit. This circuit could be compromised in HR individuals (for a detailed review of LC projections and functional anatomy, see Samuels and Szabadi61). Thus, the distinctive enhancement of connectivity between these nodes of arousal and stress response in HR individuals may contribute to or reflect the exquisite stress sensitivity of individuals at this period of psychiatric vulnerability.74 However, we did not assess elevated anxiety and/or stress-vulnerability while prescreening the HR group. Therefore, studies with more detailed measures of stress-related symptoms will be critical to address these hypotheses. Another compelling possibility is that elevations in limbic-brainstem circuit connectivity is associated with the stress burden the HR individuals face while living with a parent suffering from severe mental illness (although the same may be true for some subjects in the EC-SCZ group; however, we did not have access to this information). Also, presumably some of the EC-SCZ patients may have been themselves at HR just a few years ago. This implies that the elevated amygdalar-brainstem coupling may decrease after a psychotic break or alter due to other factors—longitudinal studies are needed to fully address this issue.
Limitations
The biggest limitation of this study is that it is a cross-sectional rather than a longitudinal study design, where we cannot differentiate HR individuals along the progression of illness. While our study provides compelling clues, focused longitudinal investigations building on these observations could fully address the chronicity issue. We collected only a single symptom severity measure (BPRS), which was not optimized to capture the complexity of schizophrenia symptoms. Therefore, symptom analyses should be treated as provisional and await prospective replication using detailed symptom severity measures. As with all resting-state approaches, present findings are correlational, and thus it is unclear whether changes in connectivity reflect the cause or the consequence of the illness. This relates to the prior point: We did not find amygdala-prefrontal alterations in HR subjects. The present study did not include a prodromal population (ie, while prodromal symptoms were not exclusionary, the HR group did not formally meet criteria for prodrome). Therefore, it is difficult to determine whether the OFC finding would exhibit a “graded” severity index, especially as the EC-SCZ group was quite symptomatic. Examining a prodromal population will be important to determine if observed alterations in amygdala-prefrontal coupling become apparent only when the full-blown illness manifests or if they appear in less symptomatic individuals.
Although our analyses help rule out age effects, replication studies need to ensure independence of brainstem region selection75 to circumvent circularity (which applies to our brainstem post hoc analyses). Also, the amygdala subnuclei show distinct functional connectivity in healthy adults. With our spatial resolution, we cannot reliably isolate amygdala subnuclei, which calls for optimized studies to carry out such finer-grained analyses. Another limitation is the lack of measurement of emotional state/trait characteristics, which would have aided interpretation of limbic effects. We acknowledge that history of nicotine/alcohol use may affect present effects to a certain extent. Here, we included subjects with nicotine/alcohol use history to provide a representative sample. Also, imaging the orbitofrontal region is problematic because of field inhomogeneity near sinus cavities. However, our results replicate prior studies,14 and we took great care to match groups on SNR/movement, yet reductions were specific for the clinical groups. Nonetheless, future studies with optimized imaging protocols should replicate these effects. Finally, we briefly acknowledge above that GMS removal is an ongoing issue in functional connectivity studies. We opted for GMS removal, given evidence that it optimizes specificity of findings.38 However, future studies should carefully consider whether GMS can possibly differentially drive some observed clinical effects.37
Conclusion
To our knowledge, this is the first cross-sectional study to characterize whole-brain amygdala connectivity across schizophrenia stages and subjects at risk. Present findings revealed robust alterations in the amygdala-OFC network in schizophrenia, but not for HR subjects, possibly reflecting severely compromised limbic-prefrontal function in overt illness. Conversely, we found elevated amygdala-brainstem coupling for HR subjects, suggesting alterations in stress response systems. Collectively, these results implicate compromised frontal-limbic connectivity in schizophrenia, as well as profound alterations in amygdala-brainstem connectivity in individuals at risk to develop psychiatric illness. These amygdala circuit alterations could provide a marker for tracking risk and conversion to full-blown psychosis.
Funding
National Institutes of Health (DP5OD012109-01 to A.A.); National Institute on Alcohol Abuse and Alcoholism (2P50AA012870-11 to J.H.K., K01MH086621 to F.W.); National Natural Science Foundation of China (81071099 and 81271499 to Y.T.); National Alliance for Research on Schizophrenia and Depression to A.A. and F.W.; Fulbright Foundation to A.S.
Acknowledgments
We thank Dr Deanna M. Barch for helpful comments and feedback during preparation of the manuscript. F.W. and A.A. had full access to all of the data in the study and take responsibility for the integrity of the data and the accuracy of the data analysis.
J.H.K. consults for several pharmaceutical and biotechnology companies with compensation less than $10 000 per year. All other authors declare that they have no conflict of interest.
References
