


Abstract
Schizophrenia is a heterogeneous disorder normally diagnosed using the Diagnostic and Statistical Manual of Mental Disorders criteria. However, these criteria do not necessarily reflect differences in underlying molecular abnormalities of the disorder. Here, we have used multiplexed immunoassay analyses to measure immune molecules, growth factors, and hormones important to schizophrenia in acutely ill antipsychotic-naive patients (n = 180) and matched controls (n = 398). We found that using the resulting molecular profiles, we were capable of separating schizophrenia patients into 2 significantly distinct subgroups with predominant molecular abnormalities in either immune molecules or growth factors and hormones. These molecular profiles were tested using an independent cohort, and this showed the same separation into 2 subgroups. This suggests that distinct abnormalities occur in specific molecular pathways in schizophrenia patients. This may be of relevance for intervention studies that specifically target particular molecular mechanisms and could be a first step to further define the complex schizophrenia syndrome based on molecular profiles.
Introduction
Schizophrenia is a severe neuropsychiatric syndrome characterized by a wide spectrum of symptoms. The diagnosis and treatment of this disorder are complicated by the heterogeneity of the syndrome. Current research suggests that schizophrenia can arise from an interaction between various neurodevelopmental processes, subtle perinatal alterations in cortical organization or environmental effects.1–4 Converging results from postmortem research, neuroimaging, genetic association studies, and blood molecular profiling analyses have led to the suggestion that several biological mechanisms may be involved, which may or may not be linked via homeostatic mechanisms. These include widely reported effects on immunological function, growth factor, and hormone signaling pathways.5–7
Current estimates indicate that less than 50% of schizophrenia patients respond favorably to treatment with antipsychotics,8 and this may be due to heterogeneous pathophysiologies. Therefore, recent studies have targeted specific biological pathways with either add-on or monotherapies. For example, Müller and coworkers9 showed that anti-inflammatory cyclooxygenase-2 (COX-2) inhibitors have efficacy in treatment of some schizophrenia symptoms. Similarly, application of the anti-inflammatory agent minocycline has been reported to be efficacious for treatment of negative and cognitive deficits in schizophrenia.10 Ehrenreich and coworkers11 have shown that administration of the growth factor erythropoietin has efficacy in improving cognitive disturbances in schizophrenia. However, these approaches have shown only limited effect sizes. This may be due to the fact that patient selection for both studies was based on Diagnostic and Statistical Manual of Mental Disorders (DSM) criteria, which does not necessarily take into account the underlying molecular pathophysiologies. Although schizophrenia is classified by DSM-IV into different subtypes, these are based on displayed symptoms and have limited use in clinical or biological validation studies.12 This is most likely due to the probability that schizophrenia is comprised of multiple overlapping etiologies that contribute to the interindividual variability of treatment responses in clinical trials and the observed low efficacy of treatment with antipsychotics.13,14
Several studies have now demonstrated the presence of altered molecular profiles in serum or plasma from schizophrenia patients compared with controls using multiplex immunoassays.15,16 These abnormalities include changes in levels of inflammatory markers,17,18 growth factors such as brain-derived neurotrophic factor (BDNF),19 and hormones including prolactin and growth hormone.20 Here, we have attempted to determine whether molecular subclasses of schizophrenia patients can be identified by applying a novel classification method employed previously to address heterogeneity in oncological syndromes.21,22 We have analyzed the serum levels of 23 immune molecules and 30 growth factors/hormones that are known to be altered in some schizophrenia patients compared with healthy controls using the same multiplex immunoassay system described above. We next grouped the patients on the basis of whether they showed predominant changes in either of these 2 molecular subclasses. Finally, we tested whether the findings were reproducible using a separate cohort of patients.
Methods
Clinical Samples
Subjects were recruited from 3 clinical centers in Germany (cohort 1: Central Institute of Mental Health in Mannheim, cohorts 2 and 3: University of Magdeburg, and cohort 4: University of Muenster) and one in Rotterdam, the Netherlands (cohort 5: Erasmus University Medical Centre). The respective institutional ethical committees approved the study protocols, informed written consent was given by all participants, and studies were conducted according to the Declaration of Helsinki. Diagnoses were carried out using DSM-IV (23) and clinical tests including Positive and Negative Syndrome scale (PANSS)23 performed by psychiatrists according to Good Clinical Practice guidelines. Eighty-six patients were diagnosed with the paranoid subtype of schizophrenia (DSM 295.3), 68 were diagnosed with general schizophrenia (295.x), and the remaining 26 patients were comprised of other subtypes (295.1, disorganized, n = 4; 295.4, schizophreniform disorder, n = 13; 295.7, schizoaffective disorder, n = 2; 295.9, undifferentiated, n = 5; 297.1, delusional disorder, n = 1; and 298.8, brief psychotic disorder, n = 1; table 1). All patients were antipsychotic naive at the time of sample collection. Control subjects (n = 398) were recruited from the same institutions matching the respective patient populations for age, gender, and social demographics. Those with a family history of mental disease or with other medical conditions such as type 2 diabetes mellitus, hypertension, cardiovascular, or autoimmune diseases were not used in the study. Schizophrenia subjects with any of these other features were also excluded. Apart from antipsychotic use, no data of medication use prior to hospitalization was available and could, therefore, not be controlled for.
Demographic Details of Subjects Used for Analysis
| Total | Discovery | Validation | P value | ||||
|---|---|---|---|---|---|---|---|
| Schiz | Control | Group 1 | Group 2 | Group 1 | Group 2 | ||
| Number | 180 | 398 | 28 | 62 | 28 | 62 | — |
| Males/Females | 118/62 | 232/166 | 19/9 | 40/22 | 21/7 | 38/24 | .816 |
| Age (y) | 30±10 | 33±10 | 30±10 | 30±11 | 28±9 | 31±10 | .645 |
| Body mass index (kg/m2) | 24±5 | 25±4 | 23±4 | 24±5 | 25±6 | 23±4 | .863 |
| Cohort 1–5 (number) | 71/46/16/33/14 | 59/46/55/198/40 | 14/4/1/7/2 | 18/24/6/10/4 | 9/8/3/6/2 | 30/10/6/10/6 | .536 |
| Positive and Negative Syndrome Scale | |||||||
| Positive | 20±7 | — | 20±8 | 22±7 | 19±8 | 22±6 | .118 |
| Negative | 21±8 | — | 24±9 | 21±8 | 20±10 | 22±8 | .273 |
| General | 44±12 | — | 45±8 | 43±12 | 41±13 | 45±10 | .746 |
| Total | 85±23 | — | 89±20 | 85±25 | 80±29 | 89±20 | .897 |
| 295.1 | 4 | — | 1 | 2 | 1 | 0 | — |
| 295.3 | 86 | — | 11 | 32 | 16 | 27 | — |
| 295.4 | 13 | — | 4 | 4 | 1 | 4 | — |
| 295.7 | 2 | — | 1 | 1 | 0 | 0 | — |
| 295.9 | 5 | — | 2 | 0 | 1 | 2 | — |
| 297.1 | 1 | — | 1 | 0 | 0 | 0 | — |
| 298.8 | 1 | — | 0 | 1 | 0 | 0 | — |
| 295.x | 68 | — | 8 | 22 | 9 | 29 | — |
Note: Values are shown as mean ± SD. Schizophrenia (Schiz) subjects were divided into discovery and validation sets to determine the reproducibility of the molecular profiles observed in group 1 (main changes in immune factors) and group 2 (main changes in growth factors and hormones). Cohorts 1–5 are defined in “Methods” section and the number of individuals in each cohort are indicated.
Blood samples were collected from all patients and controls into S-Monovette 7.5 ml serum tubes (Sarstedt). Serum was prepared using standard protocols by leaving samples at room temperature for 2 hours to allow clotting, followed by centrifugation at 4000g for 5 minutes to remove clotted cells and other particulate material. The resulting supernatants were stored at −80°C in LoBind Eppendorf tubes. The study protocol, analysis of clinical samples, and test methods were in compliance with the Standards for Reporting of Diagnostic Accuracy initiative.24
Multiplexed Immunoassays and Data Processing
The Multi-Analyte Profiling multiplex immunoassay platform was used to measure the concentrations of 23 immune molecules and 30 growth factors and hormones (table 2) in a Clinical Laboratory Improvement Amendments–certified laboratory at Myriad-RBM, as described previously.16 Assays were calibrated, absolute protein concentrations determined using standards, and performance was verified using quality control samples. To avoid potential artifacts, the control analyte levels were normalized across all clinical centers so that each had the same mean measurement for each analyte. Next, patient values were adjusted using the normalization factors from each center. Across all analytes, 17% (median) showed measurement values below the lower limits of detection, and these were replaced with half the lowest measured value for that analyte.
Immune Molecules and Growth Factors Selected for Analysis
| Immune Factors | Growth Factors/Hormones |
|---|---|
| CD40 ligand | Adiponectin |
| Endothelin-1 | Amphiregulin |
| Fas ligand | Angiopoietin 2 |
| Interferon (IFN)-gamma | Angiotensinogen |
| Interleukin (IL)-10 | Betacellulin |
| IL-11 | Bone morphogenetic protein (BMP)-6 |
| IL-12p40 | Brain-derived neurotrophicfactor (BDNF) |
| IL-12p70 | Cortisol |
| IL-13 | Connective tissue growth factor (CTGF) |
| IL-15 | Epidermal growth factor (EGF) |
| IL-16 | Erythropoietin |
| IL-18 | Fibroblast growth factor (FGF)-4 |
| IL-1 alpha | FGF basic |
| IL-1 beta | Follicle stimulating hormone (FSH) |
| IL-1ra | Growth hormone |
| IL-2 | HB-epidermal growth factor |
| IL-4 | Insulin |
| IL-5 | Leptin |
| IL-7 | Luteinizing hormone (LH) |
| IL-8 | Pancreatic polypeptide |
| Macrophage migration inhibitory factor (MIF) | Platelet-derived growth factor (PDGF) |
| Tumor necrosis factor (TNF)-alpha | Progesterone |
| TNF-beta | Prolactin |
| Resistin | |
| Testosterone | |
| Transforming growth factor (TGF)-alpha | |
| TGF-beta3 | |
| Thrombopoietin | |
| Thyroid stimulating hormone (TSH) | |
| Vascular endothelial growth factor (VEGF) |
Note: Classification was based on biological functions identified by ingenuity pathway analysis among all 138 measured analytes.
The clustering approach used in this study was based on the presence of differences in the levels of molecules between patients and controls. Due to the nonnormal distribution of several analytes, abnormality was defined as a concentration outside the 0.025–0.975 percentile range in controls. To assess reproducibility, the samples were divided randomly into discovery and validation test sets as indicated in the legend for table 1.
Molecular Classification and Clustering Approach
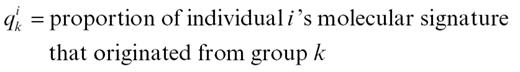
Molecular class assignments of the immune molecules, growth factors, and hormones were made using Gene Ontology terms (http://geneontology.org/). Specifically, all measured molecules that could be classified as “immune molecules” or “growth factors/hormones” were included in the study. For the analysis, we adapted an approach that was developed previously to infer population structure in multilocus genotype data.21 This approach aims to infer the populations of origin of a given group of subjects based on a set of measured variables and works best if subgroups with specific patterns in these variables exist. Here, we divided patients and controls using a random 50:50 split into training and validation sets stratified by diagnosis. The clustering was then performed on patients only, given their difference to the respective control group. This tested whether patients could be separated into distinct groups based on whether they had predominant changes in either immune molecules or in growth factors and hormones. We also tested the possibility that they were admixed with changes in both classes of molecules. We used a Bayesian clustering approach to determine the extent to which patients formed subgroups based on changes in these classes of molecules. Specifically, the quantities of interest were (1) the population of origin for each molecular abnormality in each patient, (2) the frequency of alteration for a given molecule from the immune or growth factor/hormone classes in each subject’s population of origin, and (3) the proportion of a given individual’s molecular signature that can be attributed to the immune or growth factor/hormone classes (admixing proportion). Starting from a noninformative prior distribution (equal probability that a molecular abnormality in a given molecule and subject originated from a given population of origin), a Markov Chain Monte Carlo (MCMC) method was then iteratively applied to infer these quantities of interest. Subsequently, a cutoff (median split) was applied to the admixing proportion determined for each subject to split patients into 2 subgroups. We then quantified the extent to which immune or growth factor alterations were over/underrepresented in these subgroups.
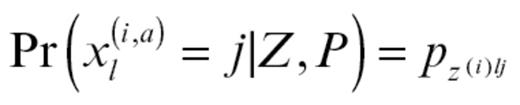
In detail, the MCMC method was used to infer the joint posterior probability π(θ) = Pr(Z, P, Q|X), where X contains the molecular changes measured in each subject (Z describes the group of origin for each abnormality in each patient):

P gives the frequency of alteration type a (growth factor or immune) for a molecule l in the group of origin of individual i:
Q describes the proportion of admixing in each patient:
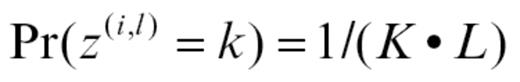
The MCMC method starts with a noninformative prior distributions for Z. We chose a uniform prior for each (i and l) combination. This indicated equal probability that a molecular abnormality in molecule l in a given subject i came from the group of origin k:
P was modeled using the Dirichlet distribution, giving the probability of a specific set of abnormality frequencies pkl for alteration type a in population k and molecule l:
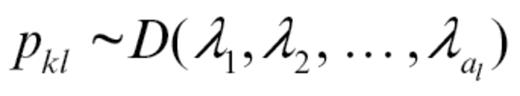
Independently for each k and l, we also chose each λ = 1, giving a uniform distribution on the abnormality frequencies. The MCMC procedure was iterated through 3 different steps with m indexing the current iteration:
1. Samples P(m) and Q(m) from Pr(pkl|X, Z) and Pr(q(i)|X, Z), respectively
2. Sample Z(m) from Pr(Z|X, P(m), Q(m))
Step 1 was performed by simulating pkl independently for each (k and l) from
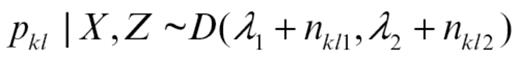
where
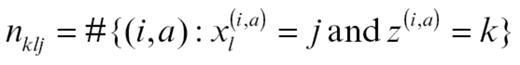
is the number of abnormalities of abnormality type a (immune vs growth factor) for molecule l observed in patients assigned by Z to group k. Q is updated by simulating from
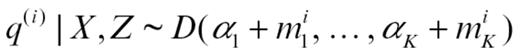
where mk(i) is the number of molecular abnormalities in patient i that originated according to Z in group k:
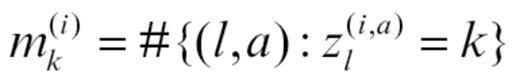
Similar to λ, we set α1 = α2 = αK = 1. Step 2 was performed by simulating zl(i,a) independently for each i, a, l from
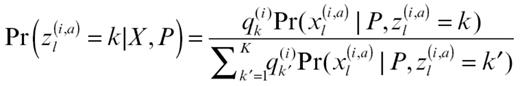
where
The MCMC algorithm was run for 5000 iterations with a burn-in of 3000. The correlation between the mean admixture proportions of subjects in independent chains was >0.99, indicating good convergence.
Results
Identification of Patient Subgroups
The admixture proportions obtained from the clustering procedure for all subjects showed a broad distribution, suggesting the presence of patient subgroups with different immune factor and growth factor/hormone profiles. To further evaluate this, we investigated how far the admixture proportions were related to the overrepresentation of the 2 classes of molecular changes in patient subgroups. We categorized patients into 2 groups with mean admixture proportions either higher or lower than 0.5 compared with patients in the opposite group. Patients with an admixture proportion higher than 0.5 had a 2.7-fold increased frequency of immune abnormalities (group 1 compared with group 2; 95% CI: 2.1–3.8) and patients with admixture proportions of less than 0.5 had a 1.7-fold increased frequency of growth factor or hormone alterations (group 2 compared with group 1; 95% CI: 1.2–2.4).The odds ratios in the validation data were 2.0 (95% CI: 1.5–2.6) and 2.9 (95% CI: 1.9–4.4), respectively. In contrast, factors such as age (P = .645, Wilcoxon test), body mass index (P = .863), and gender (P = .816, Fisher’s exact test) did not differ between the 2 patient groups in either the discovery or validation data sets. In addition, there was no association of patients in either group with diagnostic subtypes of schizophrenia (data not shown).
Identification of Molecular Changes in Patient Subgroups
To illustrate patient differences at the individual analyte level, we plotted the percentage of individuals with alterations for each molecule in both groups of patients (figure 1). Analytes with more frequent changes in group 1 were macrophage, migration inhibitory factor (MIF), interleukin (IL)-8, IL-1ra, IL-18, and IL-16. All of these were affected at a lower frequency or showed no change in patients assigned to group 2. Conversely, group 2 patients showed a higher frequency of changes in molecules such as prolactin, resistin, testosterone, insulin, platelet-derived growth factor, leptin, and angiotensinogen, and these molecules were affected with a lower frequency or changes were completely absent in group 1 patients.
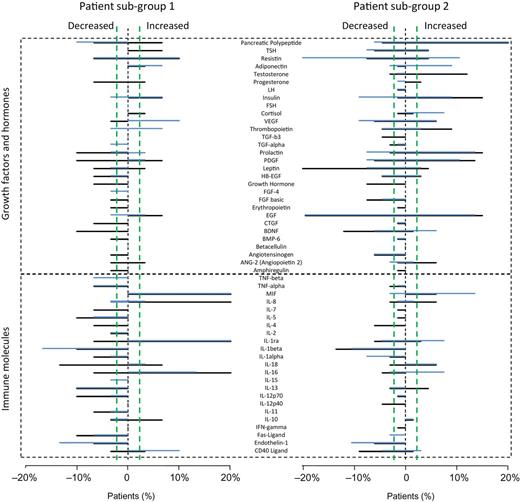
Individual serum protein changes in the discovery (black) and validation (blue) datasets in patient group 1 (left) and 2 (right) defined by admixture proportions. Each panel shows the percentage of patients with nonnormal levels of the indicated proteins (outside the 2.5–97.5 percentile of control distributions). The top section shows that patients in group 2 showed more differences in growth factors and hormones and the bottom section shows that group 1 patients had more changes in immune factors. Plots were truncated at ±20% to improve visualization. Patient percentages are not plotted for IL-4 because the abnormalities in this molecule were caused by a large number of values measured below the lower limit of quantitation. Vertical green lines indicate the range of normal levels found in control subjects.
Reproducibility
We repeated the clustering analyses within the discovery and validation sets 20 times with random assignments of subjects. This yielded results that were consistent with the above findings, with immune alterations more prominent in group 1 (2.3 ± 0.4-fold) and growth factor and hormone changes more frequent in group 2 (2.8 ± 0.6-fold). We also tested the effect of making the cutoff values for molecular differences more stringent (0.5%–99.5%) using different random selections of discovery and validation data. This resulted in an even stronger overrepresentation of immune alterations in group 1 (3.1 ± 0.9-fold) and of growth factor/hormone differences in group 2 (5.7 ± 2.8-fold).
Discussion
This is the first study that has identified molecular profiles in serum, which can be used to classify antipsychotic-naive schizophrenia patients. The application of multiplex immunoassay analyses and a Bayesian clustering method resulted in identification of distinct patient subpopulations with either predominant immune factor or growth factor and hormone alterations. This finding has at least 2 potential applications for improved treatment of patients. First, distinguishing patients based on alterations in these 2 general molecular pathways could be useful in patient selection for clinical trials. In this way, the right patients could be targeted with the right drugs to maximize effect sizes. Second, it may be conceptually relevant to diagnostics and personalized medicine approaches. Further advances in this area could lead to the development of novel treatment approaches, which, in turn, will lead to a better outcome for a higher proportion of patients.
The present findings of perturbations in either immune or growth factor and hormonal pathways in some patients have potential applications for personalized medicine approaches. For example, patients exhibiting changes in either of these pathways could be given corresponding therapies either alone or as adjunctive treatments in addition to standard antipsychotics. Recently, investigations have targeted the immune- and inflammation-related pathways as a potential alternative treatment approach in schizophrenia. Clinical studies investigating the effects of anti-inflammatory agents have shown that COX-2 inhibitors may have efficacy in treatment of the illness.9 These results have been supported by the finding that intracranial injection of epidermal growth factor application into rats leads to increased COX-2 expression accompanied by schizophrenia-like behavioral abnormalities, and these effects could be ameliorated by treatment with COX-2 inhibitors.25 Likewise, application of growth factors, such as erythropoietin, has been shown to have efficacy in improving cognitive disturbances in schizophrenia.11 Interestingly, recent studies have shown that addition of recombinant erythropoietin can sustain or increase BDNF levels, which may explain how it exerts its neuroprotective effects.26,27
Previous studies have indicated that 30%–50% of first-onset schizophrenia patients show signs of insulin resistance.28 Therefore, therapeutic strategies that target the underlying metabolic dysfunction may provide an effective alternative treatment. This may be possible as the insulin-sensitizing agents metformin and rosiglitazone have been used to correct the antipsychotic-induced insulin resistance typically associated with antipsychotic treatment without compromising the psychotropic benefits.29 The use of antidiabetic drugs has thus far not been tested as a monotherapy in schizophrenia although this approach has already shown some promise for treatment of memory deficits in Alzheimer’s disease. As in schizophrenia, a significant proportion of Alzheimer’s disease patients show signs of insulin resistance.30 Clinical trials have focussed on the use of rosiglitazone and pioglitazone as an alternative therapy to enhance cognition.30 One group conducted a 6-month, randomized, open-controlled trial in patients with mild Alzheimer disease accompanied with type 2 diabetes mellitus and found that pioglitazone treatment improved cognition and increased regional cerebral blood flow in the parietal lobe.31
Medical decisions including choice of drug treatments are dependent on valid diagnostic methods for classification of patients such as DSM-IV.32 However, there are some limitations with the DSM system as it dichotomizes continuous phenomena, does not take into account the previous course of the disorder or severity of symptoms, and has no predictive value with respect to the course of the disorder or response to therapy. It should be noted that the above novel treatment approaches, which targeted inflammation and growth factor pathways, showed only limited effect sizes. This was most likely due to the enrolment of patients in these studies with heterogeneity at both the symptomatic and molecular levels. The current findings suggest that it may be feasible to classify schizophrenia patients into subcategories taking into account the heterogeneity of molecular changes in peripheral blood. This concept has been described as “deconstructing schizophrenia.”33,34
The finding that schizophrenia patients may differ in their degree of changes in either immune factors or in growth factors and hormones is interesting as several of these molecules have already been found to be altered in first-onset schizophrenia patients, albeit not in specific patient subgroups. For example, MIF was one of the most robust changes seen in patients in group 1, and several previous studies have shown similar changes in this molecule.16,35 Other studies have found changes in IL-8, which we also found to be changed predominantly in group 1 subjects.36 Likewise, we found strong changes predominantly in group 2 patients in growth factors including epidermal growth factor and hormones such as leptin, insulin, and prolactin, which have all been identified as changing molecules in previous studies of first-onset schizophrenia patients.15,16,20,35,37 As all patients were antipsychotic free at the time of sample collection, these findings could be related to etiological differences between the 2 groups.
We also attempted to determine whether either class of molecular abnormalities associated with the 2 groups of patients were linked to different symptom domains. We found that patients in group 1 with more predominant immune factor changes also had significantly higher scores in PANSS positive psychopathology scores. This finding was not reproducible across the discovery and validation sets (data not shown) although it is consistent with a recent study, which found that differences in clinical characteristics or psychopathology could be observed between the DSM-defined subcategories of paranoid, disorganized, and undifferentiated schizophrenia.12
An important limitation is that due to the design of the study, we cannot resolve whether patient subgroups reflect disease state or trait dependent properties. It will be important to investigate how long prior to disease onset molecular subgrouping effects can be detected, whether specific biomarkers are associated with certain symptoms, and if these are affected by treatment. Although all patients were antipsychotic naïve at the time of presentation when samples were collected, the records did not include any information on other drug treatments, so we cannot account for such potential effects on the results. Another limitation is the potential bias in the selection and the molecular class assignment of the investigated molecules. Analyte selection was based on the commercial availability of a multiplexed immunoassay platform and did not specifically target all key regulators of immune, growth factor, or hormonal functions. Therefore, it is possible that a different selection of molecules would lead to different conclusions from those drawn in this study. Molecular class assignment of the measured analytes was based on gene ontology criteria. It should be noted that for some molecules, the class assignment is not unambiguous. However, because each individual molecule represents only a small fraction of the overall profile, assignments inconsistent with the true molecular subgroup profile would be expected to add noise to an otherwise robust clustering of subjects. Consistent with previous studies, our results indicated that effect sizes of alterations in schizophrenia were small. In this case, the abnormalities in any given molecular readout were present in only 10%–20% of patients. However, given the findings of this study, it may be useful to broaden the search by looking at other classes of molecules, which have been implicated in schizophrenia such as the apolipoproteins, clotting factors, and vasoactive molecules.
In conclusion, we have identified subgroups of schizophrenia patients based on distinct differences in their molecular serum profiles. One group showed predominant changes in immune molecules, whereas the other showed more significant changes in growth factors and hormones. Future research in this area should incorporate the use of follow-up data to determine whether the given molecular changes are trait markers, which change with time. It will also be important to compare these findings with those in other mental disorders such as major depressive disorder or bipolar disorder, both of which have also been associated with alterations in immune molecules, growth factors, and hormones.38–41 Such investigations may show how molecular subgroup patterns are shared across diagnostic boundaries giving new insights into etiological commonalities of psychiatric disorders. The ability to stratify patient populations using molecular readouts may also be beneficial for guiding treatment decisions and the development of novel pharmacological agents and companion diagnostics.
Funding
Stanley Medical Research Institute; European Union FP7 SchizDX research programme (223427); NeuroBasic grant from the Dutch government.
Acknowledgments
We want to thank Dr Laura Kranaster, Dr Patricia Ohrmann, Dr Thomas Suslow, Anke Dudeck, Jeanette Schadow, Dr Wolfgang Jordan, Dr Bernd Hahndorf, Dr Florian Kästner, Dr Anya Pedersen, Dr Ansgar Siegmund, Dr Katja Kölkebeck, Torsten Schoenborn, Dr Christoph W. Gerth, Dr Christian Mauss, Dr Brit M. Nolden, and Dr M. A. Neatby for their participation in sample characterization and collection. Thanks to all members of the Bahn Laboratory as well as Dr Richard Noll for discussions, help, and encouragement. Most of all, we thank all patients and healthy volunteers for their selfless donation of samples used in this study. E.S., P.C.G., and S.B. are consultants for Myriad-RBM Inc although this does not affect data sharing and ownership regulations of Schizophrenia Bulletin. The other authors have no disclosures.
References
