


Abstract
How people experience their own aging is more strongly linked to well-being than chronological age. This study examined associations of awareness of age-related change (AARC) with between-person differences and longitudinal changes in psychological well-being (PWB). We expected that higher AARC gains would be associated with higher PWB and increases in PWB over time. Conversely, we expected higher AARC losses would be associated with lower PWB and a steeper decline in PWB over time. Furthermore, we tested the interaction of AARC gains and AARC losses to examine whether negative associations between AARC losses and PWB would be weaker among those reporting higher AARC gains.
Data were collected in 3 waves from a 12-month longitudinal study of 408 community-dwelling older adults (aged 60 and older). Multilevel growth models were used to analyze associations between AARC and a composite measure of PWB which included key components of PWB identified in self-determination theory (satisfaction and frustration of basic psychological needs), as well as vitality, and life engagement.
At the between-person level, higher AARC gains and lower AARC losses was consistently associated with higher PWB. Furthermore, associations between AARC losses and lower PWB were weaker among those with higher AARC gains. There was no evidence to suggest the interplay of AARC gains and AARC losses had implications for change in PWB over time.
Appreciation of age-related gains may buffer the impact of AARC losses on PWB. However, longitudinal studies conducted over varying macro- and micro-time scales are needed to better understand the developmental significance of AARC for later life.
Later in life, experiencing negative age-related change becomes a reality for many (Baltes & Smith, 2003). Subjective perceptions of age-related change have been of interest in recent research and have been linked to depressive symptoms (Dutt et al., 2018a) and psychological (Brothers et al., 2016) and physical well-being (Dutt & Wahl, 2019). Using longitudinal data from a community-based sample of 408 older adults (aged 60 and older), we extend recent work in the field of awareness of aging and implications for well-being in two ways. First, we examined longitudinal associations between awareness of age-related change (AARC) and psychological well-being (PWB). Here we conceptualized PWB as broadly reflecting attributes consistent with full human functioning and realization of potential (Ryan & Deci, 2000). PWB was operationalized in this study using measures of basic psychological need satisfaction and frustration, vitality, and life engagement. Second, we extend conceptual advances related to AARC outlined in an earlier cross-sectional examination (Wilton-Harding & Windsor, 2021) by examining whether perceptions of positive and negative aspects of aging interact in their associations with PWB.
AARC and Well-Being
Subjective aging has been of interest to gerontological researchers for some time (Bennett & Eckman, 1973; Levy et al., 2002). Comparatively recently, Diehl and Wahl (2010) refined previous conceptualizations of subjective aging by developing the concept of AARC, which refers to “a person’s state of awareness that his or her behavior, level of performance, or way of experiencing life has changed as a consequence of having grown older” (Diehl & Wahl, 2010, p. 342). AARC differs from previous unidimensional subjective aging constructs by capturing both positive (AARC gains) and negative (AARC losses) evaluations of individuals’ own aging. For example, AARC losses may involve recognition of having to limit activities, whereas AARC gains may involve having a greater appreciation for the value of close personal relationships with advancing age (Diehl & Wahl, 2010).
A recent systematic review and meta-analysis (Sabatini et al., 2020) found that AARC consistently predicts subjective, psychological, and physical well-being outcomes. Overall, higher AARC gains and lower AARC losses is associated with greater well-being. AARC gains may enhance well-being by facilitating appreciation of valued life experiences and accumulated resources (Hobfoll, 2001) and encouraging effective processes of self-regulation (Diehl & Wahl, 2010; Wrosch et al., 2003). Additionally, AARC losses may threaten well-being by undermining self-representation (Diehl, 2006) or highlighting limits to a remaining lifetime (Brothers et al., 2016). Another possible mechanism linking AARC losses to poorer outcomes may be increased identification with generally negative stereotypes regarding aging and older adults in general (Levy, 2009).
AARC may also have implications for change in well-being over time. The Conservation of Resources Theory states that while resource loss can trigger distress, it may also lead to further loss (Hobfoll, 2001). Therefore, those with higher AARC losses may not only show lower levels of well-being overall, but also show a steeper decline in well-being over time compared to those with lower AARC losses. Hobfoll (2001) further argues that gain also begets gain. Hence, those with higher AARC gains may be more likely to increase in PWB over time compared to those with lower AARC gains.
Brothers et al. (2016) found that higher AARC gains and lower AARC losses was associated with greater PWB assessed using a composite measure based on Ryff’s (1989) PWB scales. However, to the best of our knowledge, AARC has not previously been examined as a predictor of change in PWB over time. Our aims for this study are to add to the understanding of links between AARC and change in PWB and to examine the interaction of AARC gains and AARC losses and possible implications for between- and within-person differences in PWB.
AARC Gains as a Potential Moderator of Associations Between AARC Losses and PWB
Previous research has shown that the separate dimensions of AARC gains and AARC losses is not strongly correlated (Brothers et al., 2016; Dutt et al., 2018a, 2018b; Kaspar et al., 2019). This supports the view that AARC is multidimensional and suggests that for any given individual, AARC gains and AARC losses may combine to affect well-being in different ways. For example, an individual perceiving age-related loss in one domain (e.g., health and physical functioning) may be simultaneously perceiving gain in another (e.g., interpersonal relations). While AARC losses is linked to lower well-being overall, such associations may be weaker among those with higher AARC gains. In the presence of age-related losses, AARC gains may support beliefs about personal competence (Ryan & Deci, 2000) or self-efficacy (Bandura et al., 1999; Diehl & Wahl, 2010), which are linked to higher well-being (Holahan & Holahan, 1987). Being aware of one’s own age-related strengths or resources might also facilitate self-regulatory processes (e.g., compensatory strategies in response to loss) that facilitate ongoing adaptation and development into later life (Diehl & Wahl, 2010).
Furthermore, AARC gains may have implications for how adults evaluate their own aging experience. As mentioned, AARC losses may lead to identification with negative age stereotypes that become increasingly self-relevant with age (Levy, 2009). However, recognition of gains that accompany aging may encourage individuals to view aging more favorably and as an ongoing context for continued growth and development (Diehl et al., 2014). According to Hobfoll (2001), gains may be particularly important in instances of loss, as an appreciation of gains can provide emotional respite from loss-related experiences. Our research group has begun to examine the interactions of AARC gains with AARC losses in the prediction of adaptive aging outcomes. Our work has found that AARC gains may play a protective role in relationships between AARC losses and components of goal adjustment (Wilton-Harding & Windsor, 2021), self-reported physical functioning, life engagement, and subjective well-being (Windsor et al., 2021).
In this study, we also anticipate that the between-person interplay of AARC gains and AARC losses may have implications for change in PWB over time. As mentioned, we expected those with higher AARC losses would show a steeper decline in PWB over time. However, as AARC gains may buffer the impact of AARC losses on PWB, this decline may be weaker among those with higher AARC gains.
The Present Study
In this study, we considered individual components of PWB which may be of particular relevance in older adulthood, in addition to overall PWB as reflected in a composite measure. In choosing outcome measures representing PWB (a major outcome of AARC; Diehl & Wahl, 2010), we were guided by self-determination theory (Ryan & Deci, 2000), which focuses on both satisfaction and frustration of basic psychological needs for autonomy (feeling in control of one’s life and outcomes), competence (perceived mastery and being effective in one’s life and environment), and relatedness (a sense of belonging and connection with others) as crucial for personal growth and well-being. Empirical support for the centrality of basic psychological needs in supporting well-being is evident in numerous studies (Church et al., 2013; Martela & Ryan, 2016). The importance of basic psychological needs is proposed to remain constant over the life span (Ryan & Deci, 2000), yet satisfaction of these needs may become more challenging in older adulthood resulting from declines in energy or resources (e.g., social status or physical health; Coleman, 2000; Schaie & Willis, 2010). Moreover, studies have only recently begun to examine the relative importance of satisfaction and frustration of different needs for late-life subjective well-being (Neubauer et al., 2017). The challenges for need satisfaction that arise in later life and the relative paucity of studies in the area point to the value of taking a perspective grounded in self-determination theory as a means of better understanding life-span implications for PWB.
We also considered vitality as an additional marker of PWB. Vitality is closely aligned with subjective energy (Ryan & Frederick, 1997), which has been identified as an important yet understudied component of healthy aging and a resource for adaptation (Cardini & Freund, 2020). Finally, we considered engagement with life in terms of the extent to which individuals perceive purpose through engaging in activities that are subjectively valued and meaningful (Scheier et al., 2006). Engagement with life is recognized as a key component of aging well (Rowe & Kahn, 1997) and is specified as a major developmental outcome of AARC in Diehl and Wahl’s (2010) conceptual model. A degree of conceptual overlap between domains of PWB is widely recognized (Ryff & Singer, 2008), and our data showed substantial intercorrelations among the PWB indicators (rs at baseline ranged from 0.58 to 0.89). Hence, consistent with Brothers et al. (2016), we base our main analysis on a composite measure of PWB; however, we also report results for individual indicators in follow-up analyses.
Aims and Hypotheses
Our aims for the current research were to (a) examine relationships between AARC and both between-person differences and longitudinal changes in PWB and (b) examine whether the interaction of AARC gains and AARC losses accounts for between- and within-person differences in PWB over and above their main effects. Consistent with previous research and theory, we expected AARC gains would be linked to higher levels of PWB and increases in PWB over time. Conversely, we expected AARC losses would be linked with lower levels of PWB and decreases in PWB over time. Finally, we expected that poorer outcomes for those with higher AARC losses would be less evident among those with relatively higher AARC gains.
Although our main analysis focused on a composite measure of PWB as the dependent variable, we also conducted follow-up analyses to provide initial information on whether AARC gains and AARC losses was relatively stronger or weaker predictors of individual components of PWB. In the absence of previous empirical research, we regarded these analyses as exploratory.
Method
Study Design and Participants
Following approval from the Institutional Research Ethics Committee, an advertisement was placed on CloudResearch, an online crowdsourcing platform (Litman et al., 2017). American CloudResearch workers aged older than 60, who had completed more than 100 previous studies, with job approval ratings more than 95% were invited to participate in a 15-min online study examining coping and well-being across the life span (data from this baseline assessment were used for our earlier cross-sectional study; Wilton-Harding & Windsor, 2021). Participants (N = 408) were invited to complete follow-up assessments after approximately 6 (N = 361) and 12 (N = 311) months. Participants who responded to all three assessments (N = 298) were on average 0.33 years older than those who completed fewer than three assessments (N = 110). However, the selectivity effect amounted to less than 0.08 SD units for all study variables, suggesting negligible bias resulting from attrition (Lindenberger et al., 2002).
At T1, participants were aged between 60 and 88 years (M = 67.07, SD = 4.57). Almost two thirds of participants were female (65.9% female; 34.1% male; 0% nonbinary), and over half were retired (53.5%). About 58.3% of participants reported completion of tertiary education. Participants were approximately 90% Caucasian, 5% African American, 2% Asian American, and 3% other (e.g., multiracial, Native American, or undisclosed). Approximately half of the respondents were partnered (49.6%). In the absence of widely established and accessible methods for power calculations in the multilevel modeling context, our sample size considerations were based on similar studies that have reported reliable associations of AARC indices with well-being (Brothers et al., 2016; Dutt et al., 2018a, 2018b).
Measures
Awareness of age-related change
AARC was assessed with the AARC-10SF (Kaspar et al., 2019). This measure consists of two 5-item subscales measuring AARC gains and AARC losses across the five domains of health and physical functioning, cognitive functioning, interpersonal relations, social–cognitive and social–emotional functioning, and lifestyle and engagement (Diehl & Wahl, 2010). Participants responded to items regarding how their life may have changed as a result of growing older (e.g., “I have a better sense of what is important to me” or “I have less energy”) on a 5-point scale (1 = not at all, 5 = very much). Scores for each subscale were summed, with higher scores reflecting greater AARC gains (baseline α = 0.74) and AARC losses (baseline α = 0.83), respectively.
Need satisfaction and need frustration
Need satisfaction and need frustration were assessed with the Basic Psychological Need Satisfaction and Frustration Scale (Chen et al., 2015). This measure consists of two 12-item subscales measuring both satisfaction (e.g., “I feel confident that I can do things well”) and frustration (e.g., “I feel insecure about my abilities”) of basic psychological needs for autonomy, competence, and relatedness on a 5-point scale (1 = not at all true, 5 = completely true). Scores from each subscale were summed, with higher scores reflecting higher need satisfaction and frustration, respectively (α ranged from 0.91 to 0.92 for need satisfaction, and from 0.89 to 0.90 for need frustration across the three time points).
Vitality
Vitality was measured using the Subjective Vitality Scale (Bostic et al., 2000; Ryan & Frederick, 1997). Participants indicated their agreement to six statements regarding their energy (e.g., “I nearly always feel alert and awake”) on a scale from 1 (not at all true) to 5 (very true). Scores were summed, with higher scores representing higher subjective vitality (α ranged between 0.92 and 0.93). This measure of vitality has previously shown utility in older samples (Solberg et al., 2013) including those with chronic illnesses (Yu et al., 2015).
Life engagement
Life engagement was measured using the Life Engagement Test (Scheier et al., 2006). Participants indicated their agreement with six statements regarding how much purpose they perceived in their life (e.g., “to me, the things I do are all worthwhile”) on a scale from 1 (strongly disagree) to 5 (strongly agree). The appropriate items were reverse-coded, and all items were summed, with higher scores indicating higher life engagement (α ranged between 0.88 and 0.90).
Covariates
Consistent with previous studies examining associations of subjective aging with well-being (Brothers et al., 2016; Dutt et al., 2018a, 2018b), all analyses controlled for T1 chronological age, gender (coded as male = 0, female = 1), education (0 = did not complete tertiary education, 1 = did complete tertiary education), and time-varying employment status (0 = in the labor force, 1 = not in the labor force) and mean-centered physical functioning, as previous research has found associations between these variables and the constructs of interest (Brandtstädter & Renner, 1990; Henning et al., 2019; Steptoe et al., 2015). Using the 10-item physical functioning subscale from the RAND health survey (Ware & Sherbourne, 1992), participants were asked to rate the extent to which their health limits them from participating in certain activities (e.g., walking several blocks, carrying groceries) on a 3-point scale with answers ranging from “no, not limited at all” to “yes, limited a lot” (recoded scores range 0–100, with higher scores reflecting better physical functioning, α = 0.93).
As our study intersected coronavirus disease 2019 (COVID-19) being declared a global pandemic by the World Health Organization (baseline, July 2020; Wave January 2, 2019; final wave, July 2020), we included a measure assessing increased stress/worry due to COVID-19 in the final assessment (July 2020). Participants indicated which of the listed experiences applied to them (e.g., “reduction of face-to-face contact with friends and family” or “increased worry regarding my health”; range 0–7, M = 3.16, SD = 1.66; see Supplementary Table 1 for the full measure).
Statistical Analysis
To examine associations of AARC with levels (intercepts) and rates of change (slopes) in PWB, a series of multilevel models were fitted. Multilevel models allow examination of longitudinal data comprised of measurement points (Level 1) nested within individuals (Level 2). Average rates of change in PWB outcomes were investigated by fitting unconditional linear growth models which included PWB outcomes as dependent variables and time modeled at Level 1 as the sample average of time (in months) elapsed since baseline (measurement 1 = 0, measurement 2 = 6, measurement 3 = 12). Random effects for the intercept were included in each model, and for time (if significantly contributing to model fit), to account for differences in level and slope for PWB outcomes. All available data contributed to growth model estimation via maximum likelihood estimation under the usual data missing-at-random assumptions.
To generate a composite measure of PWB, the need frustration scale was first reversed, then each outcome variable (need satisfaction, need frustration, vitality, and life engagement) was standardized at each assessment using baseline values for the M and SD. The standardized scores were then converted to a T-metric (M = 50, SD = 10), and we took the mean of the T-scores across all four PWB components at each assessment (range 17.01–64.39; Linley et al., 2009; Mackinnon & Sherry, 2012).
Results
Associations of AARC With PWB Main Effects
Descriptive statistics and bivariate correlations among key study variables at T1 are provided in Table 1. Results of multilevel models testing associations of individual differences in AARC with levels and rates of change in PWB are given in Table 2. Both AARC gains and AARC losses was reliably associated with the intercept for overall PWB (Model 1), with individuals with higher AARC gains and lower AARC losses reporting greater PWB, compared to those with lower AARC gains and higher AARC losses, respectively.
Descriptive Statistics and Bivariate Correlations Among the Study Variables at Time 1
| Variable | M (SD) or % | 1 | 2 | 3 | 4 | 5 | 6 | 7 | 8 | 9 | 10 | 11 |
|---|---|---|---|---|---|---|---|---|---|---|---|---|
| Age | 67.07 (4.57) | — | ||||||||||
| Gender (female)a | 66.0% | −0.003 | — | |||||||||
| Education (university)b | 58.4% | 0.08 | −0.13** | — | ||||||||
| Employment (in the labor force)c | 42.7% | 0.24** | 0.01 | −0.03 | — | |||||||
| Physical functioningd | 70.96 (26.55) | −0.09** | −0.10 | 0.15** | −0.15** | — | ||||||
| AARC gains | 21.42 (2.89) | −0.01 | 0.17** | −0.06 | −0.01 | 0.11* | — | |||||
| AARC losses | 13.66 (4.67) | 0.08 | 0.03 | −0.13** | 0.14** | −0.58** | −0.15** | — | ||||
| Psychological well-beinge | 50 (8.77) | 0.04 | 0.07 | −0.01 | −0.10* | 0.33** | 0.55** | −0.56** | — | |||
| Need satisfaction | 48.41 (7.80) | 0.02 | 0.08 | −0.04 | −0.13** | 0.27** | 0.59** | −0.43** | 0.92** | — | ||
| Need frustration | 23.98 (8.75) | −0.05 | −0.08 | 0.03 | 0.05 | −0.27** | −0.41** | 0.47** | −0.76** | −0.86** | — | |
| Vitalityf | 20.58 (5.65) | 0.03 | 0.01 | 0.02 | 0.12* | 0.41** | 0.45** | −0.62** | 0.70** | −0.85** | −0.58** | — |
| Life engagement | 24.45 (4.53) | 0.05 | 0.07 | 0.01 | −0.05 | 0.22** | 0.48** | −0.46** | 0.75** | 0.89** | −0.66** | 0.70** |
Notes: N = 408 at baseline. M = mean; SD = standard deviation; AARC = awareness of age-related change.
a0 = male, 1 = female.
b0 = did not complete tertiary education, 1 = completed tertiary education.
c0 = in the labor force, 1 = not in the labor force.
dHigher values = higher physical functioning.
eComposite measure.
fVitality was measured on a 5-point scale in the current study. Therefore, the mean for vitality is not comparable to studies where vitality was measured using the standard 7-point scale.
**p < .01, *p < .05.
Awareness of Age-Related Change (gains and losses) as Predictors of Psychological Well-Being (composite measure; N = 408 at baseline)
| Psychological well-being (composite measure) | ||||||||
|---|---|---|---|---|---|---|---|---|
| Model 1 | Model 2 | |||||||
| Intercept | Slope | Intercept | Slope | |||||
| Parameter | Est. | SE | Est. | SE | Est. | SE | Est. | SE |
| Fixed effects | ||||||||
| Mean intercept/slope | 51.90* | 0.71 | −0.21* | 0.06 | 51.98* | 0.70 | −0.22* | 0.06 |
| Control variables | ||||||||
| Age at T1 | 0.19* | 0.07 | 0.001 | 0.01 | 0.18* | 0.06 | 0.003 | 0.01 |
| Gender | 0.04 | 0.63 | 0.04 | 0.05 | 0.12 | 0.62 | 0.03 | 0.05 |
| Education | −1.10 | 0.61 | 0.03 | 0.05 | −1.10 | 0.60 | 0.03 | 0.05 |
| Employment | −1.01* | 0.46 | 0.01 | 0.05 | −0.99* | 0.45 | −0.001 | 0.05 |
| Physical functioning | 0.01 | 0.01 | 0.003* | 0.001 | 0.01 | 0.01 | 0.003* | 0.001 |
| Main predictors | ||||||||
| AARC gains | 1.02* | 0.08 | −0.02* | 0.01 | 0.97* | 0.08 | −0.02* | 0.01 |
| AARC losses | −0.75* | 0.06 | −0.01 | 0.01 | −0.77* | 0.06 | −0.01 | 0.01 |
| AARC gains × AARC losses | — | — | — | — | 0.05* | 0.01 | −0.003 | 0.002 |
| Random effects | ||||||||
| Variance | 25.46* | 2.68 | 0.01 | 0.09 | 24.50* | 2.63 | 0.01 | 0.02 |
| Intercept–slope covariance | 0.25 | 0.16 | — | — | 0.32 | 0.15 | — | — |
| Residual | 10.80* | 0.88 | — | — | 10.85* | 0.89 | — | — |
| Pseudo R2Level 1 | 0.19 | — | — | — | 0.20 | — | — | — |
| Pseudo R2Level 2 | 0.59 | — | — | — | 0.60 | — | — | — |
Notes: AARC = awareness of age-related change; Est. = estimate; SE = standard error. Pseudo R2 was calculated based on the proportional change in covariance parameters at Levels 1 and 2 (Singer & Willett, 2003).
*p < .05.
In terms of predicting change in PWB over time (associations with the slope), AARC gains showed associations with overall PWB. Those with higher AARC gains—although showing substantially higher PWB at the between-person level—also showed marginally steeper rates of decline over the study period (Supplementary Figure 1). AARC losses was unrelated to rates of change in the composite PWB measure.
AARC Gains as a Moderator of Associations Between AARC Losses and PWB
The interaction term for AARC gains and AARC losses showed associations with the intercept for overall PWB. As predicted, while those with higher AARC losses showed lower levels of PWB, this relationship was weaker among those with higher AARC gains. To display the nature of this interaction, we plotted predicted values for PWB for hypothetical individuals with different combinations of low (−1 SD) and high (+1 SD) AARC gains and AARC losses (Figure 1). No evidence was found suggesting AARC gains buffered the relationship between AARC losses and change in PWB over time.
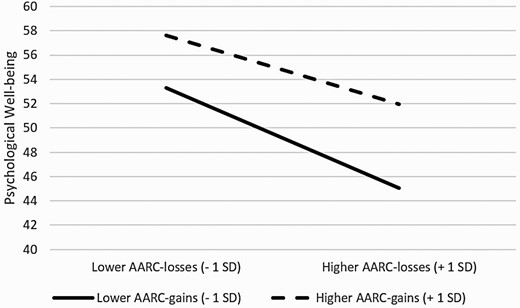
Interaction of AARC gains and AARC losses in the prediction of psychological well-being. Higher AARC losses was associated with lower levels of psychological well-being. However, this association was weaker among those with higher AARC gains. AARC = awareness of age-related change.
Follow-Up Analyses
Follow-up analyses showed that the patterns described above for overall PWB were relatively consistent across individual PWB components (Table 3). For main effects, higher PWB was linked to higher AARC gains and lower AARC losses consistently across all outcome variables. When predicting change in PWB over time, AARC gains was associated with need satisfaction and life engagement (but not need frustration or vitality), with those with higher AARC gains showing overall higher PWB on these indices, but marginally steeper rates of decline. Those with higher AARC losses showed relative stability in need frustration compared to those with lower AARC losses, who showed a slight decline in need frustration over time (indicating a relative increase in PWB; Supplementary Figure 2). The interaction term for AARC gains and AARC losses showed associations with the intercept for need satisfaction, need frustration, and life engagement (but not vitality). Consistent with the PWB composite, higher AARC losses was associated with lower PWB, but this relationship was weaker among those with higher AARC gains (Supplementary Figure 3).
Awareness of Age-Related Change (gains and losses) as Predictors of Psychological Well-Being Components (N = 408 at baseline)
| Model 1 | Model 2 | Model 1 | Model 2 | |||||||||||||
|---|---|---|---|---|---|---|---|---|---|---|---|---|---|---|---|---|
| Intercept | Slope | Intercept | Slope | Intercept | Slope | Intercept | Slope | |||||||||
| Parameter | Est. | SE | Est. | SE | Est. | SE | Est. | SE | Est. | SE | Est. | SE | Est. | SE | Est. | SE |
| Need satisfaction | Need frustration | |||||||||||||||
| Fixed effects | ||||||||||||||||
| Mean intercept/ slope | 50.07* | 0.68 | −0.11 | 0.06 | 50.13* | 0.67 | −0.12 | 0.06 | 23.14* | 0.84 | 0.06 | 0.07 | 23.05* | 0.82 | 0.06 | 0.07 |
| Control variables | ||||||||||||||||
| Age at T1 | 0.12 | 0.06 | −0.001 | 0.01 | 0.11 | 0.06 | <0.001 | 0.01 | −0.18* | 0.08 | −0.001 | 0.006 | −0.17* | 0.08 | −0.002 | 0.01 |
| Gender | 0.95 | 0.60 | 0.01 | 0.05 | 0.17 | 0.59 | 0.01 | 0.05 | −0.69 | 0.74 | 0.02 | 0.06 | −0.79 | 0.73 | 0.02 | 0.06 |
| Education | −1.06 | 0.58 | 0.002 | 0.05 | −1.06 | 0.57 | −0.001 | 0.05 | 1.21 | 0.71 | 0.04 | 0.06 | 1.22 | 0.70 | −0.04 | 0.06 |
| Employment | −1.12* | 0.46 | −0.004 | 0.05 | −1.10* | 0.46 | −0.01 | 0.05 | 0.13 | 0.55 | <0.001 | 0.05 | 0.10 | 0.54 | 0.01 | 0.05 |
| Physical functioning | 0.01 | 0.01 | 0.002 | 0.001 | 0.01 | 0.01 | 0.002* | 0.001 | −0.02 | 0.01 | −0.001 | 0.001 | −0.01 | 0.01 | −0.002 | 0.001 |
| Main predictors | ||||||||||||||||
| AARC gains | 1.04* | 0.08 | −0.02* | 0.01 | 1.00* | 0.78 | −0.02 | 0.01 | −0.72* | 0.09 | 0.01 | 0.01 | −0.66* | 0.09 | 0.01 | 0.01 |
| AARC losses | −0.49* | 0.06 | −0.01 | 0.01 | −0.51* | 0.06 | 0.01 | 0.01 | 0.62* | 0.07 | 0.02* | 0.01 | 0.65* | 0.07 | 0.02* | 0.01 |
| AARC gains × AARC losses | — | — | — | — | 0.05* | 0.01 | −0.003 | 0.002 | — | — | — | — | −0.06* | 0.02 | 0.003 | 0.002 |
| Random effects | ||||||||||||||||
| Variance | 21.41* | 2.44 | 0.02 | 0.02 | 20.63* | 2.39* | 0.01 | 0.02 | 35.99* | 3.61 | 0.03 | 0.03 | 34.57* | 3.53 | 0.03 | 0.03 |
| Intercept–slope covariance | 0.30 | 0.16 | — | — | 0.36* | 0.16 | — | — | −0.05 | 0.22 | — | — | 0.03 | 0.21 | — | — |
| Residual | 11.75* | 0.93 | — | — | 11.75* | 0.93 | — | — | 14.09* | 1.14 | — | — | 14.12* | 1.15 | — | — |
| Pseudo R2Level 1 | 0.15 | — | — | — | 0.16 | — | — | — | 0.07 | — | — | — | 0.08 | — | — | — |
| Pseudo R2Level 2 | 0.55 | — | — | — | 0.55 | — | — | — | 0.43 | — | — | — | 0.44 | — | — | — |
| Vitality | Life engagement | |||||||||||||||
| Fixed effects | ||||||||||||||||
| Mean intercept/ slope | 22.50* | 0.46 | −0.17* | 0.04 | 22.52* | 0.46 | 0.10* | 0.04 | 25.28* | 0.42 | −0.16* | 0.04 | 25.31* | 0.42 | −0.16* | 0.04 |
| Control variables | ||||||||||||||||
| Age at T1 | 0.10* | 0.04 | −0.001 | 0.003 | 0.10* | 0.04 | <0.001 | 0.003 | 0.09* | 0.04 | 0.003 | 0.003 | 0.09* | 0.04 | 0.003 | 0.003 |
| Gender | −0.56 | 0.40 | 0.003 | 0.03 | −0.54 | 0.40 | −0.001 | 0.03 | 0.03 | 0.37 | 0.05 | 0.03 | 0.06 | 0.36 | 0.05 | 0.03 |
| Education | 0.52 | 0.39 | 0.02 | 0.03 | −0.52 | 0.39 | 0.02 | 0.03 | −0.30 | 0.35 | 0.02 | 0.03 | −0.30 | 0.35 | 0.02 | 0.03 |
| Employment | −0.63* | 0.32 | −0.02 | 0.03 | 0.63* | 0.32 | −0.02 | 0.03 | −0.53 | 0.29 | 0.03 | 0.03 | −0.52 | 0.29 | 0.02 | 0.03 |
| Physical functioning | 0.02* | 0.01 | 0.002* | 0.001 | 0.02* | 0.01 | −0.002* | 0.001 | −0.01 | 0.01 | 0.002* | 0.001 | −0.01 | 0.01 | 0.002* | 0.001 |
| Main predictors | ||||||||||||||||
| AARC gains | 0.56* | 0.05 | −0.004 | 0.01 | 0.55* | 0.05 | −0.004 | 0.01 | 0.50* | 0.05 | −0.01* | 0.01 | 0.48* | 0.05 | −0.01 | 0.01 |
| AARC losses | −0.49* | 0.04 | −0.01 | 0.01 | −0.49* | 0.04 | 0.01 | 0.01 | −0.38* | 0.04 | 0.001 | 0.004 | −0.39* | 0.04 | 0.002 | 0.004 |
| AARC gains × AARC losses | — | — | — | — | 0.01 | 0.01 | −0.002 | 0.001 | — | — | — | — | 0.02* | 0.01 | −0.001 | 0.001 |
| Random effects | ||||||||||||||||
| Variance | 9.37* | 0.87 | — | — | 9.39* | 0.87 | — | — | 7.76* | 0.91 | 0.01 | 0.01 | 7.54* | 0.90 | 0.01 | 0.01 |
| Intercept–slope covariance | — | — | — | — | — | — | — | — | 0.03 | 0.07 | — | — | 0.04 | 0.06 | — | — |
| Residual | 5.62* | 0.31 | — | — | 5.59* | 0.31 | — | — | 4.69* | 0.37 | — | — | 4.72* | 0.38 | — | — |
| Pseudo R2Level 1 | 0.14 | — | — | — | 0.14 | — | — | — | 0.09 | — | — | — | 0.09 | — | — | — |
| Pseudo R2Level 2 | 0.62 | — | — | — | 0.62 | — | — | — | 0.48 | — | — | — | 0.49 | — | — | — |
Notes: AARC = awareness of age-related change; Est. = estimate; SE = standard error. Pseudo R2 was calculated based on the proportional change in covariance parameters at Levels 1 and 2 (Singer & Willett, 2003).
*p < .05.
To control for the possible impact COVID-19 may have had on our pattern of findings, we re-ran all aforementioned models with our COVID-19-specific stressor variable (see Method) included as a covariate. Overall, the pattern of results remained consistent.
Discussion
This research aimed to provide a better understanding of how subjective perceptions of both gains and losses attributed to aging are associated with PWB in older adulthood. Findings suggest AARC gains, AARC losses, and their interaction reliably accounted for between-person differences using a composite measure of PWB. Furthermore, those with higher AARC gains showed higher PWB overall, but also showed a marginally steeper decline in PWB over time.
AARC and Associations With PWB
Consistent with previous research, findings support that in terms of individual differences, greater well-being is linked to higher AARC gains and lower AARC losses. AARC gains may bring cognizance to older adulthood providing opportunities for growth and development (Diehl & Wahl, 2010), whereas AARC losses may compromise well-being by highlighting limited lifetime (Brothers et al., 2016) or undermining self-concept (Diehl & Wahl, 2010), possibly via identification with internalized negative stereotypes regarding aging (Levy, 2009). Our exploratory follow-up analyses did not reveal any clear differentials in associations of AARC with the individual PWB measures. This suggests that AARC is broadly relevant to processes of need fulfillment and effective functioning in older adulthood and likely also reflects the substantial degree of conceptual and statistical overlap in our measures.
Overall, AARC showed relatively few associations with change in PWB over time. Those with higher AARC gains showed a relative decline in PWB over the study period compared to those with lower AARC gains. However, this is unlikely to reflect any causal relationship between AARC gains and well-being, as those with higher AARC gains also showed significantly higher levels of PWB compared to those with lower AARC gains, and extreme scorers are more likely to regress toward the mean over time (Nesselroade et al., 1980). Re-running previous models including standardized scores for both AARC gains and outcome variables showed that those 1 SD unit higher in AARC gains showed only a 0.01 SD decrease in PWB, need satisfaction, and life engagement per month.
The Interplay Between AARC Gains and AARC Losses and Implications for Between-Person Differences in PWB
As predicted, at the between-person level, AARC gains was shown to buffer associations between AARC losses and individual differences in PWB (for overall PWB, and all individual PWB components except vitality). Overall, while AARC losses was consistently associated with lower PWB, this association was weaker in the presence of higher AARC gains. According to Diehl and Wahl (2010), AARC may hinder healthy development if the awareness aligns with purely negative aging stereotypes (Levy et al., 2002). However, AARC gains may promote identification of opportunities for development and motivate the pursuit of meaningful goals (Dutt et al., 2018b; Wilton-Harding & Windsor, 2021). Hence, when perceiving positive age-related changes (even in the presence of losses), individuals may retain relatively higher levels of PWB, as perceived gains may reinforce feelings of competence (Ryan & Deci, 2000), self-efficacy (Bandura et al., 1999), or positive self-image (Levy et al., 2002) which may act as a motivational force for effective self-regulation (Diehl & Wahl, 2010). It is worth noting that in contrast to some previous studies (Brothers et al., 2016; Dutt et al., 2018b), AARC gains and AARC losses was negatively (albeit weakly) correlated. Further research is needed to establish the consistency of the strength and directionality of relationships between AARC gains and AARC losses, especially when using the more recently developed AARC-10SF (Kaspar et al., 2019).
Despite statistically reliable main effects of both AARC gains and AARC losses, their interaction did not predict vitality. Energy levels are often reported to decline in older adulthood (Avlund, 2010), and lower energy is in part captured within the AARC-10SF scale (Kaspar et al., 2019). Although our results support a possible protective function of AARC gains in terms of how people respond to negative aspects of aging in cognitive–evaluative terms (as reflected by the AARC gains × AARC losses interaction consistently predicting the other PWB outcomes), we speculate that protective effects of AARC gains may be less evident in the case of vitality as this measure more directly taps into physiological aspects of experience that are less subject to change through cognitive reappraisal than other regulatory processes facilitated by AARC gains described above.
The Interplay Between AARC Gains and AARC Losses and Implications for Longitudinal Changes in PWB
There was no evidence to suggest that the interplay of AARC gains and AARC losses had implications for change in PWB over time. This association may not have been found for several reasons. One possibility is there may not have been sufficient time over the study interval to capture the proposed developmental changes which may occur over years rather than months. Research with longer time intervals is needed to further explore the extent to which AARC gains may protect well-being in the presence of age-related losses over time. Furthermore, unmeasured confounding variables may exist which could underlie the association between AARC and change in well-being (e.g., neuroticism or age stereotypes). Furthermore, recent research has shown AARC can vary from day to day (Neupert & Bellingtier, 2017). Experience sampling methods may be another informative approach when considering AARC and change in well-being, while ruling out personality or environmental variables that are relatively stable over time (Almeida, 2005). Overall, longitudinal studies conducted over varying macro- and micro-time scales are needed to gain further understanding regarding the developmental significance of AARC for well-being in later life.
Limitations and Future Directions
Caution regarding the broad generalizability of the current findings is important for several reasons. First, the time period in which the study was conducted may have been too short to capture meaningful change in well-being. Future research should consider examination of change in well-being over a longer time period and/or in samples of oldest-old adults, among whom more significant age-related losses (Baltes & Smith, 2003) may result in stronger associations of AARC with well-being that are detectable over shorter time scales. Better representation of those in late life in studies of AARC would also allow examination of whether possible protective effects of AARC gains is consistently observable when age-related losses are more common and processes of self-regulation less effective (Gerstorf & Ram, 2009).
Second, the current sample scored relatively high on education and physical functioning, both of which are associated with adaptive aging (Brandtstadter & Renner, 1990). Individuals with resources such as higher education and better health may subjectively notice more age-related gains but may also be more likely to have a lifestyle conducive to experiencing positive age-related change (such as greater financial stability and ability/opportunity to participate in activities). Furthermore, although internet usage is high among older adults in the United States with 75% of adults aged older than 65 years reporting that they use the internet (Pew Research Center, 2017), online samples have been found to differ from the general population in certain characteristics related to adaptive aging. Older adults who participate in online research overall showed higher verbal fluency, depression, and self-rated health and memory compared to a national probability sample (Ogletree & Katz, 2021). Consequently, we advise caution when generalizing our findings to non-Internet users.
Finally, AARC is an emerging construct, and there are multiple characteristics that may influence AARC itself, as well as how AARC may inform well-being (e.g., personality traits, age-related stereotypes, chronic illness, depression, loneliness, experiences of ageism). In this study, we controlled for chronological age, gender, education, employment, and physical functioning, but further research is needed to examine if there are additional individual difference characteristics that may have implications for AARC and well-being.
Conclusions
This research adds to the field of subjective aging by examining combinations of AARC gains and AARC losses and the implications for between-person differences and longitudinal changes in well-being. Our findings were generally consistent with those of previous cross-sectional studies, showing that older adults with greater perceptions of age-related gains and lower perceptions of age-related losses consistently showed higher PWB on a composite measure and across individual indices. Moreover, our results were consistent with those of emerging research (Wilton-Harding & Windsor, 2021), suggesting that negative associations of AARC losses with PWB might be partially offset by high AARC gains. Future research should focus on the interaction of AARC gains and AARC losses predicting well-being across different stages of older adulthood, among older adults from more diverse backgrounds, and using varying time scales.
Funding
B. Wilton-Harding was supported by the Australian Government Research Training Program Scholarship.
Conflict of Interest
None declared.
Data Availability
Data and study materials will be made available upon reasonable request to the first author. This study was not preregistered.

