


Abstract
Purpose of the study: To investigate the effects of 2 different health-promoting interventions on physical performance, fear of falling, and physical activity at 3-month, 1-year, and 2-year follow-ups of the study Elderly Persons in the Risk Zone. Design and Methods: A randomized, three-armed, single-blind, and controlled study in which 459 independent and community-dwelling people aged 80 years or older were included. A single preventive home visit including health-promoting information and advice and 4 weekly senior group meetings focused on health strategies and peer learning, with a follow-up home visit, were compared with control. Functional balance, walking speed, fear of falling, falls efficacy, and frequency of physical activities were measured 3 months, 1 year, and 2 years after baseline. Results: There were no or limited differences between the groups at the 3-month and 1-year follow-ups. At 2 years, the odds ratio for having a total score of 48 or more on the Berg Balance scale compared with control was 1.80 (confidence interval 1.11–2.90) for a preventive home visit and 1.96 (confidence interval 1.21–3.17) for the senior meetings. A significantly larger proportion of intervention participants than controls maintained walking speed and reported higher falls efficacy. At 1 and 2 years, a significantly higher proportion of intervention participants performed regular physical activities than control. Implications: Both a preventive home visit and senior meetings reduced the deterioration in functional balance, walking speed, and falls efficacy after 2 years. The long-term effects of both interventions indicate a positive impact on postponement of physical frailty among independent older people.
The challenge of maintaining health in old age is a growing topic within health care. For the older person, feeling healthy and independently managing daily activities are crucial factors for optimal aging. The process of physical frailty has been described as a transitional state in the dynamic progression from robustness to functional decline (Lang, Michel, & Zekry, 2009). Most models of physical frailty include muscle weakness, weight loss, impaired balance, decreased walking speed, fatigue, and low level of physical activity (Fried et al., 2001; Walston et al., 2006). Negative factors such as impaired physical performance and falls tend to activate the negative spiral of frailty (Lang, Michel, & Zekry, 2009). Different interventions to counteract the frailty process have been described, such as referrals and recommendations (Hébert, Robichaud, Roy, Bravo, & Voyer, 2001), treatment and care (Cohen et al., 2002; Gitlin et al., 2006), or physical exercise (Gill et al., 2002; Luukinen et al., 2006). However, few interventions have shown positive effects on functional performance (Daniels, Metzelthin, van Rossum, de Witte, & van den Heuvel, 2010). According to a recent overview, promising interventions to reduce frailty are multidisciplinary and multifactorial, make use of technology, and provide individualized assessment and intervention, case management, long-term follow-up, and physical exercise (Daniels et al., 2010).
Studies of preventive home visits (PHVs) for frail community-dwelling older people have shown varying effects on physical outcome measures. A review of such interventions (Huss, Stuck, Rubenstein, Egger, & Clough-Gorr, 2008) reported heterogeneous results on functional decline, but found that that PHVs including multidimensional assessment had potential for reducing disability burden among older adults.
Although few studies have evaluated group-based health-promoting interventions for frail older people, one review (Beswick et al., 2008) concluded that group education for older people was advantageous in maintaining independent living. Moreover, it appears that health-promoting interventions for older people have more impact when implemented at an earlier stage in the development of frailty or disability (Fried, Ferrucci, Darer, Williamson, & Anderson, 2004; Hardy, Dubin, Holford, & Gill, 2005). Despite this evidence, studies that have examined the long-term impact of interventions to postpone functional decline in older adults are scarce. A recently completed study “Elderly Persons in the Risk Zone” (Dahlin-Ivanoff et al., 2010) was a health-promoting intervention study with the overall aim to slow down the progression of frailty in independent community-living people aged 80 years or older. The study consisted of two interventions: a PHV or four multiprofessional senior group meetings with one follow-up home visit (SM), in addition to a control group.
Prior publications from this investigation have demonstrated that at the 3-month follow-up, both interventions delayed deterioration of self-rated health, and SM postponed dependence in ADL, i.e., larger proportion of participants had no deterioration in ADLs, measured as the sum of nine activities (cleaning, shopping, transportation, cooking, bathing, dressing, going to the toilet, transferring, and feeding) compared to PHV and control (Gustafsson et al., 2012b). Both PHV and SM groups showed a reduction of dependence in ADL at 1 year, and SM was more effective than PHV at 2 years (Gustafsson et al., 2012a). Results from focus groups conducted following participation in the interventions showed that SM served a key to action, as participants expressed that the meetings inspired them to be physically and socially active (Behm, Zidén, Dunér, Falk, & Dahlin-Ivanoff, 2013), whereas follow-up interviews indicated that the PHV could be experienced as either empowering and self-strengthening or as being of no value (Behm, Ivanoff, & Zidén, 2013).
This present study investigated the short- and long-term effects of PHV and SM on factors associated with frailty, (including physical function, fear of falling, and frequency of physical activities), compared with a control group. Our hypotheses were that, over 2 years’ follow-up: (a) both SM and PHV will prevent or delay progression of frailty, and (b) SM will be more effective for preventing or delaying frailty than PHV.
Design and Method
Participants
Inclusion criteria for the “Elderly Persons in the Risk Zone” randomized controlled trial (RCT) (Dahlin-Ivanoff et al., 2010) were as follows: age 80 years or older, living in ordinary housing in two municipalities in Gothenburg, independent in daily activities, and cognitively intact. An independent researcher organized the allocation into the three study arms. Eligible persons for the study were drawn from official registers of all persons aged over 80 years in the two municipalities. Equal numbers from the two municipalities were listed in random order. The persons were included in the sample consecutively using the simple random sampling chart until the intended sample size was reached. Invitation letters were then sent to all persons in the sample (n = 2,031) asking them to participate in the study.
Of 546 persons who were assessed for eligibility, 459 persons met the inclusion criteria, consented to participate, and were randomized to one of three groups: 114 to the control group, 174 to the PHV group, and 171 to the SM group (the flow of participants through the study is shown in Figure 1). The recruitment process is described in detail elsewhere (Dahlin-Ivanoff et al., 2010). The recruitment and allocation of participants was organized by an independent researcher and carried out by the staff in the respective municipality. Baseline and follow-up data at 3, 12, and 24 months were collected in the participants’ homes by trained research assistants. The assessors did not participate in the intervention and were blind to group assignment. To enhance the quality of outcome measurements, study protocol meetings were held throughout the study (Dahlin-Ivanoff et al., 2010).
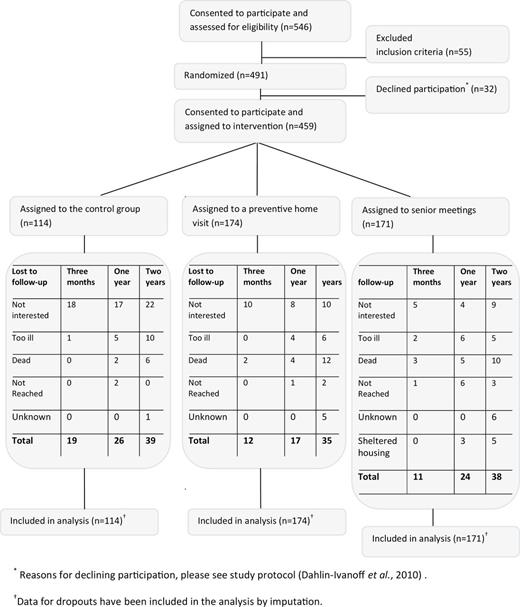
The flow of participants through the study Elderly Persons in the Risk Zone and the reasons for lost to follow-up at 3-month, 1-year, and 2-year follow-up occasions. *Reasons for declining participation, please see study protocol (Dahlin-Ivanoff et al., 2010). †Data for dropouts have been included in the analysis by imputation.
At baseline, there were no statistically significant differences between the intervention groups and controls (Table 1). All participants assigned to PHV (n = 174) received the intervention. Ninety-seven percent of the participants in SM (n = 165) attended all four meetings, whereas 2% (n = 4) attended three meetings and 1% (n = 2) attended two meetings. No adverse events were reported, and no known organized co-intervention took place during the time between the baseline interviews and the follow-ups.
Baseline Data for Controls and the Two Intervention Groups
| Control | Preventive home visits | Senior meetings | |
|---|---|---|---|
| n = 114 | n = 174 | n = 171 | |
| Age, mean/median, years | 85/85 | 85/85 | 85/85 |
| Female, n (%) | 69 (61) | 113 (66) | 111 (64) |
| Married/living together, n (%) | 61 (54) | 71 (42) | 73 (42) |
| Higher education, n (%) | 25 (22) | 33 (19) | 40 (23) |
| Berg Balance scale, median score (quartiles 1 and 3)a | 53 (49, 55) | 52 (48, 55) | 53 (50, 55) |
| Mean walking speed, m/s | 0.75 | 0.74 | 0.75 |
| Walking unaided indoor, n (%) | 109 (96) | 168 (97) | 164 (96) |
| Walking unaided outdoor, n (%) | 92 (81) | 126 (72) | 136 (80) |
| One or more fall in the last 3 months, n (%) | 24 (21) | 34 (20) | 30 (18) |
| Not at all or a little afraid to fall, n (%) | 104 (91) | 155 (89) | 153 (90) |
| Self-rated health good to excellent, n (%) | 90 (79) | 139 (80) | 142 (83) |
Notes: Chi-square test or Fisher exact test for dichotomous variables, Mann-Whitney U-test for ordinal data, and t-test for continuous variables. All differences were nonsignificant.
aMaximum score = 56. A higher score on the BBS indicates higher degree of functional balance.
As shown in Figure 1, the total dropout rate at 3 months was 9% (n = 42), at 1 year was 15% (n = 67), and at 2 years was 24% (n = 112), with dropouts in all groups, but with a significantly larger proportion in the control group at all follow-ups (Figure 1). “Not interested” was the main reason for dropping out. No significant differences in age, gender, marital status, academic education, or living conditions were found between participants and dropouts. However, the 3-month and 1-year dropouts had significantly lower self-rated health at baseline (p = .004 and p = .045, respectively). At 2 years, the dropouts were significantly older (p = .001). A total of five persons (1%) at 3 months, 11 persons (2%) at 1 year, and 28 persons (6%) at 2 years had died.
The Three Arms of the RCT
No intervention (control) was compared with PHV and SM.
Control Group.
The control group had access to the ordinary range of services from the municipal care for old people on their own initiative. The general aim of these services is to ensure that older persons are able to live as independently as possible in their own homes. In Sweden, people who are in need of help to manage daily life can apply for assistance from the municipal home help service. The extent of need for such support is assessed and may include safety alarms, meals on wheels, help with cleaning, assistance with personal care, and health care. In this study, participants who asked for such services were informed at the follow-up visits where to obtain assistance.
Preventive Home Visit.
Participants in PHV received a single home visit from an occupational therapist (ROT), a physical therapist (RPT), a nurse (RN), or a social worker (SW). The PHV was guided by a structured protocol. The personnel were prepared by joint training, and regular staff meetings were held to maintain quality and standardization of the PHV. The visit aimed to establish contact and to answer any queries, as well as to identify unmet needs that could be met by the municipality or voluntary associations. The visit included a structured interview in which the older person’s perceived health problems and resources were discussed. Participants were offered verbal and written information about activities such as local senior municipal centers, different activities run by local associations, physical training for seniors, walking groups, and other resources (Table 2). Information about available help and support could be offered either by voluntary associations or by the municipality, as well as information about assistive devices and adaptation of housing was also offered. In addition, screening of environmental fall risk factors and advice on how to prevent falls were included in the home visit (Table 2).
Visit Protocol Showing Information and Discussion Areas Included in the Preventive Home Visit Intervention
| Common health problems connected with advancing age |
| The range of help and support available in Gothenburg and in the municipality, such as volunteers, churches, mission fellow human, health centers, and where to turn to for help with health problems and illness, opening hours, phone times, and phone numbers |
| The Social Services Act and how to apply for home care service |
| How to prevent identified fall risks and how to continue be active; assessment of the fall prevention checklist and in adequate cases a “safety walk” in the home |
| Technical aids and housing modifications and how to apply or purchase them |
| A basic home exercise program including balance exercises |
| Senior activities provided by the municipality, for instance local meeting places, activities run by local associations, physical training for seniors, walking groups for seniors, and possibility of receiving or providing volunteer interventions |
| An offer for “try out” of activities including a group visit to local meeting places such as petanque clubs, gyms for seniors, Nordic walking groups, a short introduction to computer knowledge, and other activities |
| Public transportation, busses adapted for older adults and mobility service for the disabled |
| Smoking alarms and offer to check the alarm |
| An offer of having your driving capacity assessed by professionals, and a brochure on the Swedish legislation |
| The local lifestyle magazine “Senior Life,” with information on local activities for seniors |
| Possibility to meet a pharmacist for counselling on medicines |
Multiprofessional Senior Group Meetings With One Follow-Up Home Visit.
This intervention comprised a total of four weekly group meetings, each lasting 2hr, focused on the process of aging and health. Before the start of the study, discussions with reference groups of older people were performed in order to identify essential topics to cover during the meetings. The four group meetings were led by an RPT, an RN, an ROT, or a SW, depending on the topic of each meeting. The RPT was responsible for the topics of aging, physical activity, and food; the RN was responsible for how to take care of health problems and medicines; the ROT was responsible for coping with everyday life, how to feel more secure, and how to use technology in daily life; and the SW was responsible for coping with life events, quality of life during aging, and how to apply for help to manage daily life. Group leaders were trained in group process theory and how to lead group discussions. The role of the leader was to encourage and to guide the participants in the learning process, focused on health-promoting behavior. One aim with the small-group learning environment was to use group process and peer learning to inspire participants to test and maintain new activities, as well as to adopt safety strategies in their everyday lives, in order to avoid, for instance, future falls. Thus, SM provided an arena for knowledge exchange, and the exact content of the group discussions varied according to the participants’ needs. A booklet called “Life Pilot for Seniors,” written specifically for the intervention, was used as base material during the four meetings (Dahlin-Ivanoff, 2009). Within 3 weeks of completion of the groups, each participant was offered a follow-up home visit to address questions that might have arisen after the groups were completed.
Outcome Measures
Physical Functioning.
Functional balance was measured by the Berg Balance scale (BBS) (Berg, Williams, & Gayton, 1989), which includes 14 items, each scored using a 5-point scale (0–4), with a total maximum score of 56. The scale has been tested for validity, reliability, and sensitivity to change (Berg, Wood-Dauphinee, Williams, & Maki, 1992). In this study, a score of 48 or more was considered high-functional balance (Chiu, Au-Yeung, & Lo, 2003).
Walking speed was measured by walking 4 m at a comfortable speed indoors. The participants did two tests, and the best value was used. Walking speed has been reported as a reliable measure predicting death, hospitalization, mobility decline, and cognitive impairment (Rydwik, Bergland, Forsén, & Frändin, 2012).
Fear of Falling.
Fear of falling was measured by asking “Are you afraid of falling?” with four alternative answers: no not at all afraid, yes a little afraid, yes afraid, or yes very afraid.
Falls efficacy was measured by the short Falls Efficacy Scale International (FES-I) (Yardley et al., 2005). The FES-I measures concern about falling during seven different activities (getting dressed or undressed, taking a bath or shower, getting in or out of a chair, going up or down stairs, reaching for something above your head or on the ground, walking up or down a slope, and going out to a social event), with four answering alternatives: (a) not at all concerned, (b) somewhat concerned, (c) fairly concerned, or (d) very concerned. The maximum score is 28; a total score of 7 indicates no concern about falling, and a total score of 28 indicates severe concern about falling. The short FES-I has been found to be a feasible measure to assess concerns about falling in older persons (Kempen et al., 2008).
Physical Activity.
Physical activity was measured by asking “How often do you take outdoor walks or perform similar physical activities?” with six response alternatives ranging from “never” to “almost every day.” The proportion of participants who had preserved or increased their physical activities between baseline and follow-up was calculated.
Two-Sided Significance Statistics
Statistical analysis was based on intention to treat (ITT; Altman, 1999) and included all persons who completed baseline measurements. The basic assumption for imputing data was that older people are expected to deteriorate over time as a natural course of the aging process. Therefore, as described in an earlier article (Gustafsson et al., 2012b), missing values were replaced with a value based on the median change of deterioration (MCD) between two measuring points (baseline and the 3-month follow-up or between two follow-ups) of all who participated at both measuring points. Missing values due to death were imputed with the worst-case rank at respective follow-up. Sensitivity analyses comparing the results with complete case analyses were performed (Bennett, 2001) and showed similar trends to the ITT analysis (data not presented). Baseline and dropout data were compared using chi-square or Fisher exact test for dichotomous variables (gender, living with someone, education, walking unaided, and one or more fall), Mann-Whitney U-test for ordinal data (balance score, self-rated health, and fear of falling), and t-test for continuous variables (age and walking speed). Comparisons of means at baseline and follow-up were made using intergroup analysis of variance test. For tests of changes over time, the Mann-Whitney U-test was used for comparisons between the groups. Outcome measures were dichotomized for the primary study outcome (nondeteriorated or deteriorated) and analyzed using chi-square test, and group-wise comparisons were performed; tests were performed using odds ratios (OR). Two-sided significance tests were used. A p value of .05 or less was considered significant, and a 95% confidence interval (CI) is provided, using normal approximation of the log-OR. Predictive Analytics Software Statistics, version 18.0 (IBM SPSS, Inc., Chicago, IL, 2009) was used.
A power calculation was based on the expected relative change over time, from baseline to follow-up, a significance level of alpha = 0.05, and a power of 80% in a two-sided test. Thus, at least 112 persons were required in each intervention group to be able to detect a difference of at least 15% between the groups. A comparison between the control group and the intervention groups would require 72 persons in the control group, assuming a difference of at least 20%. Accordingly, at least 300 persons were needed for the analyses, and to allow for dropouts, a total of 459 persons were included.
Results
Physical Function
Functional Balance.
Mean total score of the BBS was significantly higher for PHV at 1 year, and for SM at 1 and 2 year follow-up, compared to control (Table 4). At 2 years, a significantly larger proportion of participants of the PHV and SM reached a total score of 48 or more on the BBS (indicating a high degree of functional balance) with an OR for the PHV group of 1.80 (95%CI 1.11–2.90) and with an OR for the SM group of 1.96 (95% CI 1.21–3.17) compared with control (Figure 2). However, there was no significant difference between the interventions and control in change scores from baseline to follow-ups (data not shown).
Mean Total Scores of the Short Falls Efficacy Scale International (FES-I) and Berg Balance scale (BBS)
| Control | Preventive home visit | Senior meetings | ||||
|---|---|---|---|---|---|---|
| n = 114 | n = 174 | n = 171 | ||||
| FES-I | BBS | FES-I | BBS | FES-I | BBS | |
| M (SD) | M (SD) | M (SD) | M (SD) | M (SD) | M (SD) | |
| Baseline | 8.3 (1.9) | 51.0 (6.0) | 8.8 (2.1) | 51.4 (4.5) | 8.8 (1.8) | 51.8 (4.4) |
| 3 months | 9.4 (3.0) | 49.9 (6.5) | 9.3 (2.5) | 50.4 (6.4) | 8.8 (2.1) | 51.0 (6.3) |
| 12 months | 11.0 (4.7) | 46.2 (10.6) | 10.4 (4.1) | 48.1 (9.1)* | 10.3 (3.4) | 47.8 (8.9)* |
| 24 months | 13.0 (7.1) | 41.1 (13.2) | 11.1 (5.4)* | 44.5 (11.7) | 9.0 (7.0)* | 45.1 (11.3)* |
Notes: Analysis of variance test was used for comparisons between means of the groups. Maximum score for the FES-I = 28, with a higher score indicating a higher degree of concern to fall, or a lower degree of falls efficacy. Maximum score for the BBS = 56, with a higher score indicating a higher degree of functional balance.
*p ≤ 0.05.
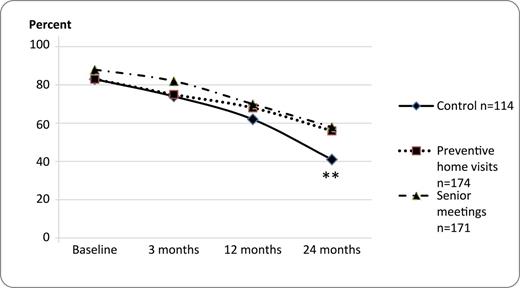
Proportion of participants with a total score of 48 or more on the Berg Balance scale at baseline and follow-ups. Chi-square test, **p ≤ .01.
Walking Speed.
At 2 years, the proportion of participants who had preserved or improved indoor walking speed was significantly larger in the PHV and SM groups than in the control group (Figure 3). The OR for maintained or improved walking speed at 2 years for PHV was 1.64 (95%CI 1.00–2.67) and for SM was 2.09 (95%CI 1.28–3.41) compared with control group. However, there were no significant differences between interventions and control in mean walking speed at follow-ups (Table 3).
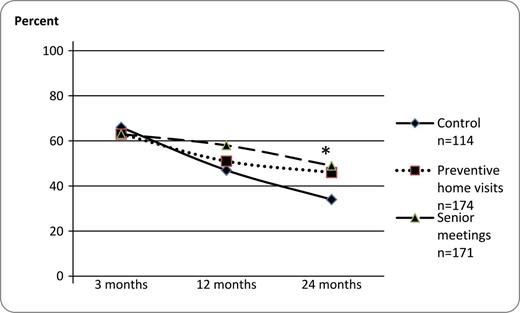
Proportion of participants who had preserved or improved indoor walking speed at follow-ups compared with baseline. Chi-square test, **p ≤ .01.
Mean Walking Speed (meters per second), Proportion (%), and Odds Ratio (OR) for Performing Physical Activities ≥ 3 Times per Week (Physically Active) Control Intervention Versus Control, 95% Confidence Interval (CI)
| Control group | Preventive home visit | Senior meetings | ||||||
|---|---|---|---|---|---|---|---|---|
| n = 114 | n = 174 | n = 171 | ||||||
| Mean walking speed (SD) | Physically active n (%) | Mean walking speed (SD) | Physically active | Mean walking speed (SD) | Physically active | |||
| n (%) | OR (CI) | n (%) | OR (CI) | |||||
| Baseline | 0.8 (0.2) | 83 (83) | 0.8 (0.2) | 142 (82) | 0.89 (0.48–1.66) | 0.8 (0.2) | 149 (87) | 1.35 (0.70–2.64) |
| 3 months | 0.8 (0.2) | 95 (83) | 0.8 (0.3) | 143 (82) | 0.92 (0.49–1.73) | 0.8 (0.2) | 142 (83) | 0.98 (0.52–1.85) |
| 12 months | 0.7 (0.2) | 75 (66) | 0.8 (0.2) | 138 (79) | 1.99 (1.17–3.40)* | 0.8 (0.2) | 133 (78) | 1.82 (1.07–3.09)* |
| 24 months | 0.7 (0.2) | 65 (57) | 0.7 (0.2) | 128 (74) | 2.10 (1.27–3.46)** | 0.7 (0.2) | 119 (70) | 1.73 (1.05–2.83)* |
Note: *p ≤ 0.05. **p ≤ 0.001.
Fear of Falling
There was no significant difference in proportion of participants who reported unchanged or diminished fear of falling at follow-ups (3 months: control 58%, PHV 66%, SM 71%.; 1 year: control 64%, PHV 62%, SM 66%.; 2 years: control 50%, PHV 61%, SM 57%).
Falls efficacy decreased in all three groups during the 2-year study period, manifesting a general increasing concern of falling during daily activities (Table 4). At 2 years, total FES-I score was significantly lower, that is, less concerned, for the two interventions than for the controls (Table 4). Walking on stairs, reaching for something, and walking on a slope were the items on the FES-I, which showed the highest degree of deterioration between baseline and follow-ups for all three groups (data not shown). There were, however, no differences among the three groups concerning change over time on the FES-I (data not shown).
Physical Activity
The OR for performing physical activities such as outdoor walking three or more times per week was significantly larger in the intervention groups than in the control group at 1- and 2-year follow-ups (Table 3).
Discussion
Prior publications of the “Elderly People in the Risk Zone” study have shown that at the 3-month follow-up, both interventions delayed deterioration of self-rated health, and SM postponed dependence in ADL (Gustafsson et al., 2012b). Both PHV and SM groups showed a reduction of dependence in ADL at 1 year, and SM was more effective than PHV at 2 years (Gustafsson et al., 2012a). Despite these positive outcomes in self-rated health and ADL function, the results of the current investigation showed no significant differences between interventions and control in physical function, falls efficacy, or physical activity at the 3-month assessment. However, in a longer perspective both interventions had positive impacts on physical function, falls efficacy, and physical activity at 1- to 2-year follow-up assessments, indicating that these benefits are seen in long-term, rather than short-term outcomes. Mechanisms for these improvements require further clarification. The PHV was focused on promoting social and physical activities, which could act as an activator for healthy behaviors. Similarly, the encouragement from professionals and co-participants in the SM groups may have contributed to the positive impact of the group intervention. A focus on sharing knowledge and experiences, as well as meeting people in the same situation, has been known to help the individual to become more aware of and express his/her own questions and needs, which could benefit health (Hagberth, Sjöberg, & Ivarsson, 2008).
In this study, those who maintained or reached a score of 48 or more on the BBS were assessed as having good functional balance, which has been earlier supported (Chiu et al., 2003). The proportion that reached or exceeded this cut-off at the 2-year follow-up was larger in the intervention groups than in the control group. This could be associated with a higher degree of physical activity, as both intervention groups also showed less deterioration in frequency of physical activity than controls. It is well known that physical activity, for example, maintaining outdoor walking, is essential for general health (Peterson et al., 2009). A main component in both interventions was to encourage and discuss how to keep active and inform participants about available activities within the municipality, as well as to discuss possible obstacles for being physically and socially active and how to overcome these obstacles.
One reason for the long-term benefits of these interventions could be that it takes time to change and incorporate new physical habits. Also, the interventions possibly caught those individuals who had an interest in and desire to maintain or retain earlier activities but who perhaps needed a push in the “right” direction. Furthermore, in our study the PHV and SM groups reported higher degree of falls efficacy than the controls at 2 years. This may be associated with the higher degree of physical activity among intervention participants, as there is a strong association between self-efficacy and physical function (Tinetti, Mendes de Leon, Doucette, & Baker, 1994).
A previous review and meta-analysis on PHVs concluded that there was no clear evidence in favor of the effectiveness of interventions (van Haastregt, Diederiks, van Rossum, de Witte, & Crebolder, 2000), although meta-analyses found that multidimensional, preventive home-visit programs were more effective in a younger population (Huss et al., 2008; Stuck, Egger, Hammer, Minder, & Beck, 2002). Furthermore, a recent study reported that a PHV program including four home visits during 2 years showed no effect on functional and psychosocial status among ambulatory frail older people but significantly improved function in daily activities and depression for those with ADL dependency at baseline (Kono et al., 2012).
In contrast to this, both of our two interventions showed a long-term impact on physical function, falls efficacy, and physical activity level. Our original study hypothesis was that interventions introduced in an early phase of the frailty process could prevent or delay progression of frailty (Dahlin-Ivanoff et al., 2010). During our 2-year follow-up, there was a general decline in both intervention and control participants (with greater decline in the control group), indicating that our enrollment criteria were successful in identifying individuals who were on the verge of frailty. Importantly, results from our study showed that the interventions we tested can mitigate deterioration in these individuals.
Our second hypothesis was that SM would have a greater impact than PHV (Dahlin-Ivanoff et al., 2010). The rationale for this was that the SM was a more extensive intervention including four structured meetings led by different professions and focused on peer learning. In accordance with this, an earlier study from the same RCT has shown that the SM group had significantly less deterioration in ADL than the PHV and control groups (Gustafsson et al., 2012a). In contrast to the earlier findings, our results found equivalent efficacy between both interventions, compared with the control condition, for improved long-term outcomes in physical function, falls efficacy, or physical activity.
A strength of this study was the participants’ adherence to the interventions. In the SM group, 97% of participants attended all four meetings. The content of the four meetings was thoroughly planned and tested with a reference group of seniors, which ensured that it would be relevant for participants. In addition, participants were actively involved in the intervention, and they inspired each other, as well as made new social contacts through the meetings (Behm et al., 2013). Moreover, as this study included people who were independent in daily activities, many study participants already attended other activities outside their homes before the study. It is possible that attendance at the SM meetings might have been different had the participants been more dependent and functionally limited, as this could have meant greater difficulties leaving home.
Another strength compared with other studies was the homogeneity of the study population at baseline. As health status varies considerably with advancing age, most intervention studies in geriatric populations show large differences in physical and psychosocial status, which can make the interpretation of outcome measurements difficult. By choosing a sample of older persons who were independent in daily activities, we tried to minimize these differences.
There are some limitations to this study. Between baseline and all follow-ups, the dropout rate was larger in the control group than in the intervention groups. However, the RCT design and the fact that the participants of the three groups were similar at baseline support the results.
Another limitation was that 24 persons (control n = 7, FHV n = 13, SM n = 4) had missing values on the BBS and 4-m walking test at the 2-year follow-up. The most frequent reasons for missing data on these two tests were pain or fatigue.
The ITT approach was used in order to ensure that participants were analyzed in the groups to which they were randomized (Hollis and Campbell, 1999), that is, all participants who had a baseline measure were included in all follow-up analyses. This approach was chosen to preserve the strengths of randomization, aiming at ensuring that potential prognostic factors were balanced between the treatment groups (Sainani, 2010). However, using ITT potentially could also reduce our power to demonstrate efficacy of the intervention (Feinman, 2009). In our study, the control group had a higher rate of dropout than the two intervention groups, and the missing cases were therefore not randomly distributed. Our assumption was that the expected natural process in an aging population is a gradual physical decline, which is in contrast to clinical drug tests in which improvement in specific aspects of health is expected. This supported the choice of MCD as an imputation method. The optimal situation is certainly avoiding dropouts, but for this age group our dropout rate was relatively low. The data missing were mostly wave nonresponses (Hardy, Allore, & Studenski, 2009) and classified as data missing not at random (Little and Rubin, 1987) as the dropouts had significantly lower self-rated health and higher degree of weight loss at baseline (Gustafsson et al., 2012b).
This study was performed in two municipalities in Gothenburg, with a comparable large proportion of well-educated nonimmigrant inhabitants. The results might have been different if the participants had been recruited elsewhere. In addition, because only functionally independent older persons were included in this study, the results cannot be generalized to a more frail or disabled population, to people with a lower degree of education, or to immigrants.
Both interventions in this study showed positive effects on functional measures. This is in accordance with earlier follow-ups from the “Elderly Persons in the Risk Zone,” showing that both PHV and SM delayed deterioration of self-rated health, (Gustafsson et al., 2012a, 2012b). Also, one focus group study (Behm et al., 2013) with participants from the SM groups and one interview study on experiences of the PHV intervention (Behm, Ivanoff, & Zidén, 2013) have reported that the interventions provided the participants with strategies for managing future problems. As a consequence of the positive results of this study, the municipalities included in our study have recently decided to offer both SM and PHV to their older inhabitants. Thus, the significant positive findings of this investigation have already made an impact on policy and clinical practice in these municipalities. Further research is needed to apply similar programs in other settings.
Ethical Considerations
Ethical approval was obtained for the study “Elderly Persons in the Risk Zone” ref. no: 650-07. After completion of the study, participants in the control group were invited to participate in either of the two interventions which, at that time, had been implemented in the common routines of the municipalities.
Conclusions
The interventions showed long-term positive impact in the sense that the deterioration of physical performance, falls efficacy, and frequency of physical activities was decelerated, thus contributing to postponing the physical frailty process among independently living older people.
Funding
This study was supported by Vårdalinstitutet, the Swedish Institute for Health Sciences .
References
Author notes
Decision Editor: Rachel Pruchno, PhD

