


Abstract
Objective: to test the effect of a 16-week multimodal exercise program on neurocognitive and physical functioning and brain-derived neurotrophic factor (BDNF).
Design: a single-blinded, parallel-group randomised controlled trial.
Settings: university campus and community-based halls.
Subjects: forty-nine women aged 65 to 75 years, with no cognitive impairment and not undertaking more than 1 h of formal exercise training per week.
Methods: the intervention group attended a 60-min multimodal class twice each week which included cardiovascular, strength and motor fitness training. The primary outcome was neurocognitive functioning and secondary outcomes were physical functioning and plasma levels of BDNF.
Results: twenty-five participants were randomised to the intervention group and 24 to the control group. One control participant withdrew before follow-up data collection. The intervention group performed significantly better than the control group at follow-up (when controlled for baseline) in the Trail Making test A and B, the California Older Adult Stroop test (Word, Interference and Total scores), Controlled Oral Word Association test and the Timed Up-and-Go test, Six-Minute Walk test, One-Legged Stance test and plasma BDNF.
Conclusion: this multimodal exercise program resulted in neurocognitive and physical performance improvements and increased levels of plasma BDNF, in older women, when compared with controls. This RCT provides evidence that a multimodal exercise intervention can achieve larger effect sizes than those generally resulting from single modality interventions. Increases in BDNF levels imply neurogenesis may be a component of the mechanism underpinning the cognitive improvements associated with multimodal exercise.
Trial registration: Australian and New Zealand Clinical Trial Registration Number: ANZCTR12612000451808.
Introduction
Age-related cognitive decline (ARCD) is a pattern of deterioration in cognitive functions that gradually impairs the ability to think, reason, concentrate and remember [1]. This process of deterioration is related to a number of structural, metabolic and physiological changes in the brain [2]. It has been identified as a major health threat for older adults because of the profound adverse implications for the critical capacities of independence, social engagement and quality of life [3].
The potential scale of the problem has been magnified by the onset of the predicted global trend towards ageing populations. This demographic shift represents a larger and growing pool of people over the age of 60 years, with an estimated 40% expected to experience some degree of ARCD [4]. Conjointly, the nature, effects and potential magnitude of the problem are expected to have enormous social, economic and service delivery repercussions, at the national and international level [5].
A series of advances in knowledge underpin current interest in the potential for exercise to prevent, reverse or at least delay the onset of ARCD. Significantly, it is now known that deterioration of the ageing brain is not inevitable. The discovery of the concept of positive neuroplasticity (the life-long potential for functional enhancement of the brain) [6] has substantiated the idea that cognitive improvements can be induced in later life. Systematic reviews have identified formal exercise training (that results in increased cardiovascular fitness) as one type of stimulus that can give rise to small to moderate improvements in cognitive function [7, 8]. Recent research suggests that combining different exercises (e.g. cardiovascular, resistance, balance) might achieve even greater gains [9–11]. However, the most beneficial combinations are, as yet, unclear. Research employing functional magnetic resonance imaging in humans has found that motor fitness (balance, flexibility, co-ordination, agility and reaction time ability) is associated with brain activation patterns that differ from those related to cardiovascular fitness [11]. Significantly, motor fitness training entails complexity that requires sustained attention and concentration [12]. Experiences that demand this kind of mental effort, known as cognitive load, may evoke positive neuroplasticity. Animal studies indicate that the process of positive neuroplasticity may be mediated by brain-based new cell growth (neurogenesis) [13] which is said to be reflected in peripheral blood concentration levels of the biomarker brain-derived neurotrophic factor (BDNF) [14].
Based on a synthesis of this profile of findings and in line with the methodological recommendations of a Cochrane systematic review [7] we conducted a randomised controlled trial of a multimodal exercise program that included cardiovascular and motor fitness training. The study was specifically designed to impose cognitive load and was undertaken on an intention-to-treat basis.
Methods
Study design and participants
We conducted this single-blinded, parallel-group, randomised controlled trial between July and December 2012. The previously published study protocol [15] contains details of the study design, population, sampling, randomisation techniques, intervention and data collection methods. This protocol was followed without alteration. All potential participants were screened for cognitive and physical status. Eligible participants were women between the ages of 65 and 75 years, who were doing <60 min of formal exercise each week and could walk 20 m unaided. By confining the study to one gender we sought to eliminate this variable as a potential confounder. In addition, mixed results from the few human studies indicate that poorly understood gender effects may obscure the interpretation of biomarkers of cognitive function such as BDNF [16]. Accordingly this study focused on older women. Exclusion criteria included cognitive impairment (Telephone Interview of Cognitive Status score ≥31), dementia, Parkinson's disease and recent head injury. The ethics committee at the university approved the protocol. Data collection took place at two locations (on the university campus and at a community hall). Collection of follow-up data occurred within 2 weeks of the end of the 16-week intervention delivery period.
Recruitment
Participants were enlisted primarily in response to an advertisement that was placed in a free community newspaper and a prime time television news segment about the study. Respondents initially made telephone contact with a research assistant. Those who met the initial eligibility requirements related to age, gender, amount of weekly exercise, ability to walk 20 m and availability (able to attend classes at the allotted times and location, for the duration of 16 weeks), were then invited to undertake the next stage of screening.
Randomisation, concealment and blinding
Following baseline data collection participants were randomly assigned using an independent randomisation service to either an intervention or a control group (randomisation with 1:1 ratio). A research assistant, not involved in other aspects of the study, contacted each participant by telephone and informed them of their group allocation and provided details of the processes and requirements pertinent to their group. Participants and instructors could not be blinded due to the nature of the intervention. The follow-up data collectors were blinded to group allocation as were the laboratory staff involved in BDNF analysis. Data analysis was conducted by the first author on a de-identified database.
Intervention and comparator
The intervention was a specifically designed, theory-based, 16-week multimodal exercise program that included progressions and variations. For a detailed description of the intervention, see previous protocol publication [15]. Participants in the intervention group attended a 60-min class, in a community hall, twice a week and each session included cardiovascular, strength and motor fitness (balance, co-ordination, flexibility and agility) training and a formal warm-up and cool-down routine.
To maximise intervention fidelity, the same two instructors were present in each class. At random intervals, an independent assessor observed classes and monitored content for consistency using a check-list based on the explicit components of the exercise intervention protocol. Protocol adherence was monitored by documentation of class attendance. The intervention group members were asked to plan to attend at least 85% of classes and were followed up by telephone if they were absent for two consecutive classes.
The members of the control group were on a waiting list to attend the 16-week program which commenced immediately after follow-up data collection for the intervention group. The control group was asked to continue with usual activities during the waiting period and this included refraining from participating in >60 min of formal exercise each week. To enhance the prospect of retention, participants in the control group were contacted by telephone at 4-week intervals by a research assistant.
Screening
Formal telephone screening included the Telephone Interview for Cognitive Status [17] which is a standardised test of global cognitive functioning, and the Pre-Activity Readiness Questionnaire [18] which is designed to identify medical conditions that may require medical advice before exercise can be safely undertaken. Individuals reporting serious medical conditions were sent clearance forms in the post and asked to bring written permission from their General Medical Practitioners to the baseline data collection session.
Baseline measurements
At baseline, information was gathered about age, education level, language spoken at home and marital status. Anthropometric measurement was conducted by registered nurses and included height, weight, waist and hip circumference, blood pressure using a sphygmomanometer (Welch Allyn 767, Skaneateles Falls, NY, USA) and resting heart rate derived from palpation of the radial pulse for 1 min. Participants completed the 21 item Depression, Anxiety and Stress Scale (DASS-21) [19]. The Geriatric Index of Co-morbidity [20] was used to gather information about the numbers and severity of medical conditions for each participant. Baseline levels of physical activity were measured using a pedometer (Omran—Walking Style Pro, Kyoto, Japan) worn for 5 days.
Outcomes
The primary outcome measures were performance scores in a range of neurocognitive tests that are regarded as being indicators of cognitive processes such as inhibition, working memory, verbal fluency, speed of information processing and shifting. These abilities have been found to be highly associated with ARCD, mobility and the ability to perform activities of daily living [21].
The California Older Adult Stroop Test (COAST) was developed specifically for use with older populations and assesses the ability to suppress a habitual response in favour of an unusual response (inhibition) [22]. The Controlled Oral Word Association Test (COWAT) measures verbal fluency and also draws on semantic memory [23]. The Letter-Number Sequencing (LNS) test [23] measures working memory as well as sequencing, attention and concentration abilities. Psychomotor and information processing speed were measured using a computer-based program (Deary-Liewald Reaction Time Task) [24] designed to detect reaction time, defined as the time between stimulus presentation and response initiation. The two-part Trail Making test (TMT) (A and B) assesses attention, motor function, flexibility of thinking and visual search ability. Part B centres on shifting ability or the capacity to adapt to the environment by quickly switching from one mental set to another [23]. In particular, the TMT B, COAST Interference and COWAT (FAS) are considered to be tests of executive function [25].
Secondary outcome measures included the Six-Minute Walk test; the Timed Up-and-Go Test from the Senior Fitness Test [26]; and the One-legged Stance test (OLST) [27] to assess aerobic fitness, mobility, lower extremity function and balance, as aspects of physical functioning. In addition, whole blood samples were collected and processed to obtain plasma which was then analysed for BDNF concentrations [16].
Statistical analyses
We estimated that a sample of 54 participants (27 in each group) would provide an 80% power (with α = 0.05) of detecting differences between group means for an effect size of 0.6 in the TMT B of neurocognitive function. Previous randomised controlled trials of exercise interventions have shown effect sizes between 0.24 and 1.17, in similar populations, for neurocognitive performance outcome measures, as a result of aerobic interventions [7]. All data were double entered by two different research assistants and all analyses were by intention-to-treat. To test the effects of multimodal exercise, between group differences were examined using analysis of covariance (ANCOVA) with baseline scores as covariates. Where data were not normally distributed log-transformed data were used to calculate P-values in the ANCOVA. Cohen's d effect size was calculated based on the partial η2 statistics obtained from the SPSS output [28].
Results
Forty-nine (n = 49) eligible participants were enrolled, of which 25 were randomised to the intervention group and 24 to the control group. Seventeen were required to provide clearance by their general medical practitioner prior to randomisation. All of the 25 participants allocated in the intervention group completed at least 85% of the 32 classes conducted over the 16-week delivery period (mean = 30.0; SD = 1.7). Follow-up data were collected from the entire intervention group and one of the 24 participants randomised to the control group was lost to follow-up. Figure 1 describes the participant flow through the trial.
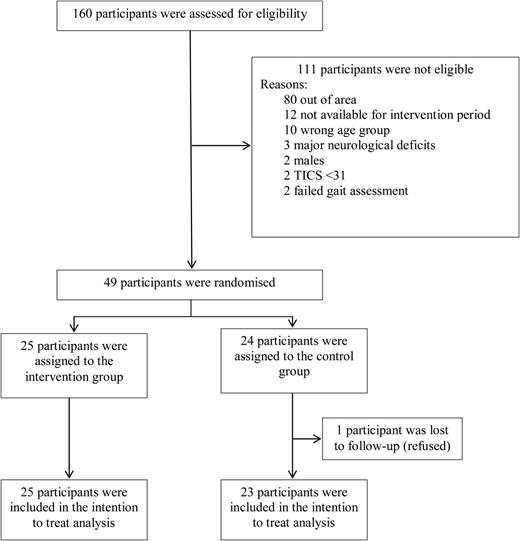
Flow diagram of trial.
Table 1 displays participant characteristics at baseline. The participant characteristics were similar between the groups on entry to the trial. All outcome variables were normally distributed with the exception of the OLST and BDNF levels.
Mean values (SD) of baseline data collection for intervention and control groups
| Variable | Intervention group mean (SD) (n = 25) | Control group mean (SD) (n = 24) |
|---|---|---|
| Baseline sample descriptor variables | ||
| Age (years) | 69.0 (3.1) | 68.8 (3.5) |
| Education in years | 12.3 (2.9) | 12.7 (3.5) |
| Body Mass Index (kg/m2) | 25.8 (4.6) | 28.4 (6.1) |
| Waist-to-hip ratio | 0.8 (0.1) | 0.9 (0.1) |
| Heart rate (beats/min) | 73.9 (12.8) | 73.5 (8.9) |
| Mean blood pressure (mmHg) | 97.8 (7.0) | 101.1 (10.7) |
| Mean daily steps (pedometer) | 5193.6 (2306.0) | 5029.3 (2890.5) |
| TICS | 38.3 (4.1) | 36.9 (3.0) |
| Depression (DASS-21) | 6.8 (7.3) | 7.8 (6.8) |
| Global Co-morbidities Index Score | 4.2 (3.2) | 4.5 (2.7) |
TICS, telephone interview of cognitive status.
Table 2 shows the differences between the intervention and control group, at follow-up, adjusted for baseline. All physical functioning outcomes showed highly statistically significant differences between the groups (OLST was log transformed prior to analysis). The neurocognitive performance scores showed between group differences for TMT A and B tests, COAST Word, Interference and Total and the COWAT. In all cases, the intervention group performed better than the controls when adjusted for baseline. Performance in the COAST colour test showed a difference between the two groups that almost reached statistical significance (P = 0.056). In addition, the intervention group's log-transformed BDNF levels increased while the control's decreased and this difference reached statistical significance. Cohen's d effect sizes were large for the physical outcome measures and moderate to large for the neurocognitive outcomes [28].
ANCOVAs of physical function scores, cognitive function scale scores and BDNF levels
| Variable | Mean (SD) intervention group (n = 25) | Mean (SD) control group (n = 23) | EMM difference between groups | P-value | 95% confidence interval of the mean difference | Effect size (d) | |||
|---|---|---|---|---|---|---|---|---|---|
| Baseline | Follow-up | Baseline | Follow-up | (I − C) | Lower | Upper | |||
| Six-Minute Walk test (m) | 503.9 (93.7) | 602.0 (67.5) | 507.3 (73.6) | 488.7 (101.8) | 113.1 | <0.001 | 73.2 | 153.1 | 1.70 |
| Timed Up & Go (s) | 6.6 (1.4) | 4.9 (0.7) | 6.7 (1.3) | 6.7 (1.4) | −1.7 | <0.001 | −2.3 | −1.2 | 2.04 |
| Trail Making test A (s) | 33.7 (11.8) | 25.5 (6.3) | 30.3 (7.9) | 28.2 (8.2) | −4.2 | 0.024 | −7.8 | −0.6 | 0.70 |
| Trail Making test B (s) | 65.8 (21.0) | 53.0 (20.3) | 69.6 (23.0) | 64.6 (17.3) | −9.3 | 0.037 | −17.9 | −0.6 | 0.63 |
| LNS | 14.9 (3.0) | 16.3 (3.8) | 13.7 (3.1) | 15.2 (3.0) | 0.1 | 0.908 | −1.4 | 1.6 | N/A |
| COAST_Colour (s) | 33.0 (6.4) | 29.5 (3.5) | 31.9 (5.6) | 31.0 (5.4) | −2.2 | 0.056 | −4.4 | 0.1 | N/A |
| COAST_Word (s) | 26.8 (6.4) | 23.3 (3.6) | 24.5 (4.2) | 24.4 (4.0) | −2.1 | 0.013 | −3.8 | −0.4 | 0.77 |
| COAST_Interference (s) | 61.3 (13.0) | 49.0 (9.5) | 65.1 (24.1) | 60.5 (25.2) | −8.5 | 0.002 | −13.7 | −3.3 | 0.97 |
| COAST_Total_Time | 121.1 (21.9) | 101.8 (14.1) | 121.5 (30.2) | 115.9 (31.4) | −14.3 | <0.001 | −21.0 | −7.6 | 1.28 |
| COWAT_FAS_Total | 42.0 (12.6) | 50.0 (16.0) | 42.9 (14.2) | 45.4 (15.1) | 5.2 | 0.024 | 0.7 | 9.7 | 0.70 |
| Simple reaction time (mean—ms) | 308.1 (36.3) | 297.2 (34.0) | 306.1 (33.4) | 301.7 (18.6) | −5.1 | 0.449 | −18.6 | 8.4 | N/A |
| Choice reaction time (mean—ms) | 583.0 (86.0) | 566.8 (80.0) | 565.1 (75.3) | 540.2 (61.2) | 16.3 | 0.257 | −12.3 | 45.0 | N/A |
| One-legged Stance testa | 54.9 (50.7) | 99.1 (60.8) | 22.3 (19.2) | 21.9 (21.3) | N/A | <0.001 | N/A | N/A | N/A |
| Brain-derived neurotrophic factora | 4.5 (2.2) | 5.2 (1.8) | 5.6 (1.8) | 4.7 (2.4) | N/A | 0.023 | N/A | N/A | N/A |
EMM, estimated marginal mean; COWAT, Controlled Oral Word; Association Test; COAST, California Older Adult Stroop Test; N/A, Not Applicable.
aLog-transformed data were used in this ANCOVA as the data were not normally distributed.
Discussion
This multimodal exercise program had a pronounced beneficial effect on tests of physical and cognitive performance and on peripheral blood concentrations of BDNF. Improvements in the primary outcome measures (neurocognitive performance) represent enhanced verbal fluency and information processing speed and a better ability to attend, concentrate, think flexibly and resist distraction. This is important since these particular cognitive functions are amongst those most associated with age-related decline [1]. Changes in the secondary outcome measures represent marked improvements in balancing ability, mobility, lower extremity function, falls risk and exercise capacity. To our knowledge, this is the first time that changes in BDNF levels have been demonstrated, in women, as a result of a multimodal exercise intervention configured to impose cognitive load. This finding suggests that, as in animal studies, neurogenesis or the growth, maintenance and survival of neurons may mediate the process of exercise induced improvement in cognitive functioning in older women [13, 14].
This controlled intervention study clearly demonstrates the positive effect of a multimodal exercise program across a number of aspects of cognitive and physical functioning. Where intervention studies have been employed previously, single or bi-modality exercise has been the overwhelming focus [7]. These studies demonstrated small to moderate effects on neurocognitive function. In contrast, this study has demonstrated moderate to large effects with the application of a multimodal exercise format.
Of the cognitive tests that did not exhibit statistically significant between group differences, the LNS test appears to tap a number of functions rather than representing a pure index of working memory. Education and self-regulation of emotional responses may confound performance in this test [29]. In addition, although participants reported subjective noticeable differences in their overall agility, this was not borne out by the specific reaction time testing device used in this study. It is unclear how well the instrument used to gauge reaction time, which requires upper body dexterity, actually reflects lower body agility. Also, research suggests that this particular demographic may be adversely affected by not being familiar or comfortable with computer-based testing technology [30].
The strengths of this study include the high levels of retention and adherence, objective measurement of activity levels at baseline (previous work generally relies on subjective measures) and the application of a RCT as a robust methodology, capable of establishing causality. The limitations of this study include the fact that it is difficult to calculate the extent to which the success of the program is reliant upon the effect of the particular fitness instructors who conducted the program. There was also no monitoring of physical activity in the control group and the results of this study can only be generalised to older women.
Conclusion
This study represents a breakthrough in our understanding of the role of exercise in promoting cognitive health in older women. It is clear that multimodal exercise conducted in a controlled environment that imposes a high cognitive load on the participants can result in improvements in a number of areas of physical and cognitive performance. A particularly important outcome is the finding that multimodal exercise also results in increased levels of plasma BDNF which implies that, as in animal studies, neurogenesis is a likely component of the mechanism whereby exercise induces improvement in cognitive functioning in humans. Future research is required to establish whether these results can be replicated for men, for other age groups and the dose required to elicit cognitive benefits.
Conflicts of interest
None declared.
ARCD may be ameliorated by exercise.
Multimodal exercise may offer greater benefits than cardiovascular exercise alone.
The mechanism that underlies cognitive enhancement with ageing may be related to neurogenesis as reflected in increases in BDNF.
Funding
This work was supported by a Post-Graduate Scholarship and additional funds provided by Griffith University, QLD, Australia.

Comments