


Abstract
Universal Health Coverage (UHC) is a core element of ensuring healthy lives, marking the third Sustainable Development Goal. It requires providing quality primary health-care (PHC) services. Assessment of quality of care considering a wide variety of contexts is a challenge. This study lists practical indicators to enhance the quality of PHC.
Demonstrating quality indicators for PHC that are feasible, comprehensive and adaptable to wide array of health systems and resource settings.
We applied the research framework: Exploration, Preparation, Implementation and Sustainment. Exploration included a scoping review to identify quality indicators. Preparation included an eDelphi to refine the primary indicators’ list. A panel of 27 experts reviewed the list that was later pilot tested in PHC facilities. The outcomes were presented to two further expert consultations, to refine indicators and plan for broader testing. Implementation included testing the indicators through a five-step process in 40 facilities. A regional consultation in May 2016 discussed the testing outcomes.
Initial efforts identified 83 quality indicators at the PHC level that were then refined to a 34-indicator list covering the six domains of quality. A toolkit was also developed to test the feasibility of each indicator measurement, data availability, challenges and gaps. Pilot testing provided insight into modifying and adding some indicators. Wide variability was encountered within and in between facilities, and timely initiation of antenatal care, for example, ranged 31–90% in Oman and 11–98% in Tunisia. Indicators were highly feasible, and 29 out of 34 were measured in 75% of facilities or more. While challenges included gaps in capacity for data collection, the tool showed high adaptability to the local context and was adopted by countries in the Eastern Mediterranean Region (EMR) including Libya, Oman, Iran, Pakistan, Sudan and Palestine. Stakeholders agreed on the high relevance and applicability of the proposed indicators that have been used to inform improvement.
A cross-regional set of 34 quality indicators of PHC in the EMR was developed and adopted by a diverse group of countries. The toolkit showed high feasibility in pilot testing reflecting the practicality needed to encourage local uptake and sustainability. The core quality indicators are highly adaptable to different local and regional contexts regardless of current PHC strength or available resources. Continuous evaluation and sharing lessons of implementation and use are needed to ascertain the indicators’ effectiveness in driving improvements in PHC and to refine and strengthen the evidence supporting the set of indicators for wider adoption.
Introduction
Over the last decades, low- and middle-income countries (LMICs), with assistance from development partners, have been able to increase access to primary health care (PHC) services. However, in many countries, the network of PHC facilities has remained underutilized and has failed to gain the trust of the population due to inadequate quality [1]. As countries commit to and embark toward Universal Health Coverage (UHC), the overarching target of Sustainable Development Goal 3, there is a growing need for high-quality PHC in LMICs [2, 3]. Integrated People-Centered Health Services is an approach for delivering PHC as recommended by the World Health Organization (WHO), which gives further impetus to enhancing the quality of PHC [4].
The ability to measure PHC quality in LMICs is critical. There are several global initiatives including the Primary Health Care Performance Initiative (PHCPI) [5], the Lancet Global Health Commission [6] and the Organization for Economic Cooperation and Development (OECD) [7] that are working to address these measurement gaps with frameworks and guidance at national and regional levels, reinforced by the call to action by provider groups such as the World Organization of Family Doctors [5, 7–9]. Measuring the quality of PHC is a challenge for LMICs for many reasons including weak data systems [10], the lack of integration between vertical programs and PHC, giving priority to input and numbers in served populations rather than addressing quality and having a systematic culture that does not support decision-making based on data are among key challenges [11].
The OECD has shown the value of a routinely collected set of standardized indicators used across a region, which enables countries to benchmark performance and identify opportunities for learning [7]. To identify PHC quality indicators that are operational within the Eastern Mediterranean Region (EMR), attention was paid to the service regardless of the state of the health-care system itself, given the wide heterogeneity of health systems in the EMR [12]. Donabedian’s framework has defined the relationship between structures, processes and outcomes in achieving quality. The structures of health care are the physical and organizational aspects of care systems; the processes rely on the structures and people to carry outpatient care and improve outcomes including health maintenance or recovery, rehabilitation, survival, prevention and patient satisfaction [13]. The Institute of Medicine (IOM) six dimensions of quality include safety, effectiveness, person-centeredness, timeliness, efficiency and equity, providing additional domains for measurement [14].
However, the ongoing work to improve PHC measurement has resulted in an overwhelming number of indicators, many of which are not contextually appropriate to LMICs. This underscores the need for valid, reliable and feasible indicators for LMICs [1]. The WHO Eastern Mediterranean Regional Office (WHO-EMRO) has been actively working to assess the quality of PHC based on a regional review conducted in 2015 finding major gaps in quality of care, patient satisfaction and health outcomes [15]. Working with regional stakeholders and global experts, EMRO has developed a framework and related tools for assessing and monitoring the quality of PHC using implementation research methods, where knowledge is applied to accelerate development and improve implementation of health policies with practical approaches [16, 17]. This framework can serve as a useful approach that relies on a set of core indicators, lending themselves to improving the quality of PHC delivery in the EMR and the wider beyond.
Methods
Exploration
To develop a quality assessment framework and identify an initial set of indicators, a scoping literature review was conducted using PubMed and Google Scholar to identify articles and existing reviews with search terms ‘quality of care’, ‘primary care’, ‘indicators’, ‘tools’ and ‘measures’. Eligible articles from 2000 onwards (6125 articles) were screened. Seven hundred and thirty-seven articles were selected as they described an existing set of PHC indicators of quality used at the national or regional level, and they were later pooled to a total of 37 papers included in the review [1, 5–7]. Data sources also included WHO reports and relevant publications of earlier work done by EMRO [1, 15, 18]. To develop the initial set of indicators, we combined the conceptual framework developed by the OECD and lessons from the Health Care Quality Indicators Project that includes the continuum of health care from promotion and prevention to curative primary care [7, 19], with the Donabedian’s framework for quality assessment (structures, processes and outcomes) [20]. The framework was then overlaid with the IOM six domains of quality (equity, safety, efficiency, effectiveness, patient-centeredness and timeliness) [14, 21] (Figure 1).
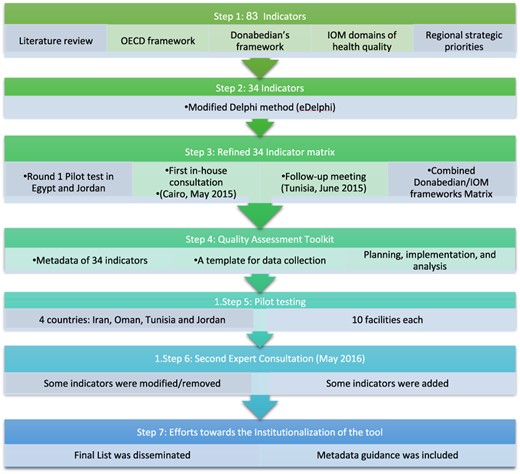
Schematic representation of the methods used to develop the final 34 Quality Indicator List.
Preparation
A modified Delphi research method was followed to ensure strong stakeholder engagement [22]. The goal of e-Delphi survey was to prioritize the PHC quality indicators. A panel of 27 global and regional experts was asked to score the indicators on a 5-point Likert scale (from 1, strongly rejected, to 5, strongly supported). The selection process mainly considered three critical characteristics: scientific strength (face and content validity), relevance and importance (potential for improvement and impact on health and health expenditures) and feasibility (availability of existing data and costs for new collection). Indicators were included in the next stage if relevance and scientific strength were rated at 4 or 5 by 70% or more of the experts and feasibility at 4 or 5 by 50% or more.
Two small-scale pilot tests were conducted in five PHC facilities in Egypt, and United Nations Relief and Works Agency managed facilities in Jordan to determine feasibility, validity and reliability of data collection and data sources, appropriateness, and what adaptations and additional indicators were needed. The drafted indicators’ list and results of the small-scale pilots were critically reviewed by primary care experts and relevant staff in WHO-EMRO responsible for the five strategic priority areas (health system strengthening, maternal and child health (MCH), non-communicable diseases (NCDs), emergency and preparedness, and global health security) in a consultative meeting in Cairo in May 2015 [18]. A follow-up meeting was held in Tunisia, in June 2015, with national focal points for quality and safety from 19 EMR countries and additional quality experts to comment on the list (Figure 1). The full process was mainly participatory relying on discussions and feedback from the field as well as input from experts.
Implementation
A toolkit was subsequently developed for field use to help researchers assess the feasibility of indicator use and identify challenges and gaps. A second round of pilot testing was done in 10 facilities in each of the four piloting countries—Iran, Oman, Tunisia and Jordan—following a five-step process including stakeholder engagement, assembling of a team, training and mapping of data sources, data collection, and analysis. The primary goal of the second pilot testing was to use the results of the implementation of measurement (feasibility, adaptations to the toolkit, measurement process and indicators) in a regional consultation to identify a final set of quality indicators to be offered for application by EMR countries in general and LMICs in particular. This strategy was designed to encourage a wider implementation and allow for continued learning (Figure 1).
Sustainment
A second expert consultation was conducted in May 2016 to review the second pilot results and update the indicators accordingly. It also considered experience from similar initiatives in other regions and planned for wider implementation. Reflecting the commitment to iterative learning, modifications were recommended and made in some of the existing core indicators and approaches to integrate into existing data collection and quality measurement (Figure 1).
Results
Development of quality assessment framework and tools
Eighty-three indicators were initially identified. The e-Delphi, preliminary piloting in Egypt and Jordan, and the two consultations pooled 34 indicators covering Donabedian’s three categories: structure, process and outcomes, and IOM quality domains. Indicators were not uniformly distributed, with the greatest representation in the process and outcome categories of Donabedian’s and Safety and Effectiveness domains of IOM frameworks (Table 1). Moreover, the selected indicators represented both the perspective of patients and providers as well as the processes of care.
Final selected list of 34 quality indicators overlaid on the six quality domains and Donabedian’s three categories (structure, process and outcome). Feasibility of measurement from four country pilot testing is also reported
| Level | Indicators | % of facilities where the indicator could be measured | |
|---|---|---|---|
| Access and equity | Structure | % of catchment population registered with the facilitya | 90 |
| Process | % of patients seen in PH being managed for mental health conditionsc | 37 | |
| Outcome | Staff satisfaction ratea | 86.5 | |
| % of women visiting for the first time during the first trimestera | 100 | ||
| Safety | Structure | % of individual patient file with unique identifier within the health-care facilitya | 98.5 |
| Process | % of health facility staff fully immunized for hepatitis Ba | 100 | |
| % of safe injections in the health-care facilitya | 100 | ||
| % of staff who attended quality and patient safety training in last yeara | 100 | ||
| % of injections given with a new sterile standard safety syringea | 91.5 | ||
| % of injections with the used needle/device disposed immediatelya | 94 | ||
| % compliance with hand hygiene guidelinesa | 90 | ||
| Outcome | Number of adverse events reported (immunization/medication)a | 94 | |
| Efficiency | Process | % of prescriptions that include antibiotics in out-patient clinicsa | 100 |
| Outcome | # days stock outs/year for identified 15 essential medicines in facilitya | 100 | |
| % of the eight essential Cardio-Vascular Disease (CVD) and Diabetes Mellitus (DM) medicines with no stock out in last 3 monthsa | 100 | ||
| Effectiveness | Process | % of registered hypertension patients with initial laboratory investigationsa | 98.5 |
| % of registered hypertension patients with Blood Pressure (BP) >140/90 at last 2 follow-up (F/U) visitsa | 100 | ||
| % of registered diabetic patients with fasting blood sugar controlled at last 2 follow-up (F/U) visitsa | 98.5 | ||
| % of NCD patients with 10-year cardiovascular risk recorded in the past yeard | 23.5 | ||
| % of NCD patients with Blood Pressure (BP) recorded twice at last follow-up visitb | 70 | ||
| % of children screened for anemiac | 36.5 | ||
| % of smokers attending cessation counselingc | 48.5 | ||
| Outcome | % of children under 23 months immunized according to the national protocola | 83.5 | |
| % of high-risk group immunized against influenzaa | 83.5 | ||
| % of pregnant women fully vaccinated against tetanusa | 100 | ||
| % of Diabetes Mellitus (DM) patients with HbA1C < 7%a | 96.5 | ||
| % of Diabetes Mellitus (DM) patients with fundus eye examination during last yearb | 71.5 | ||
| % of pregnant women with ≥4 Antenatal Care (ANC)a | 100 | ||
| % of pregnant women who received health educationa | 100 | ||
| % of under 5 children with weight and height measured in the past yeara | 100 | ||
| Patient-centeredness | Outcome | % of patients aware about patients’ rights and responsibilitiesa | 100 |
| Patient satisfaction rate (%)a | 88.5 | ||
| Timeliness | Process | % of appropriate (upward) referrals during last 6 months (by specific conditions)a | 90 |
| Average waiting time (min) at out-patient clinicsa | 100 |
Above 75%.
Above 50%.
Above 25%.
Below 25%.
Developing a toolkit for field use prior to piloting was important to aid in planning, implementation and analysis of the measurement work. The toolkit included a metadata dictionary with operational definitions of indicators, information about potential sources of data and a template for data collection. IT helped in optimizing and standardizing data collection, provided insights into the gaps in PHC quality and allowed for pre- and post-assessment with comparison across countries.
The final list including percentage of population registered at the facility and patient satisfaction rate among others (Table 1). The second expert consultation produced some modifications based on the second pilot, for example, expanding from smoking cessation to broader substance use counseling. Additionally, some indicatopagers were added, such as percentage of infants exclusively breastfed for the first 6 months. Consensus was achieved on the PHC indicators quality list to be used for within-country measurement and across the region to identify successful models for spread.
Outcomes of quality assessment
The second round of pilot testing (Table 2) highlighted that majority of the indicators showed high feasibility being measured in >75% of the facilities. Only five indicators were measured in <75% of the facilities. The lowest measured indicator was the percentage of NCD patients with a 10-year cardiovascular risk recorded in the past year being measured in only 24% of the facilities, staff satisfaction was only assessed in 21 of 40 facilities (52.5%), and only two countries had enough data to measure patient-centeredness. Noticeably, no facility appeared to have adequate data on the percentage of smokers attending smoking cessation counseling. Moreover, wide variability was observed between and within countries in terms of data availability. For example, effectiveness, measured by 16 indicators, showed variations in the estimated measurements. Variability was also seen between the facilities of each individual country. For instance, timely initiation of antenatal care ranged 31–90% in Oman and 11–98% in Tunisia, and waiting times in Iran and Oman were 20 min, while Tunisia findings showed an average of 75 min (Tables 1–3).
Pilot testing in four different EMR countries
| Tunisia | Iran | Oman | Jordan | |
|---|---|---|---|---|
| Stakeholder involvement | Basic Health Care Directorate of the Ministry of Health (MOH), regional officials | Director and team from Tabriz district network, directors from provincial health center, Information technology leads | Focal point from governorate, DG PHC services and supervisors for selected PHC | Engagement with the Basic Health Care Directorate of the Ministry of Health, regional officials and basic health services in choosing the sites, pilot testing and review of the resulting data |
| Sites | 10 PHC sites, across 5 governorates | Tabriz district: 4 public urban Health Centers (HCs), 4 private urban HCs and 2 rural Health Centers (HCs) | 10 PHC sites across 7 directorates. Urban/rural mix | 5 Ministry of Health (MOH) clinics 5 The United Nations Relief and Works Agency (UNWRA) clinics |
| Pre-data collection | Reviewed existing data and developed additional data collection tools. Training of data collectors | Development and testing additional four data collection tools (e.g. safe injection checklist); training of data collectors | Development and testing additional data collection tools, training for collection | Additional tools for hand hygiene and patient exit surveys developed to complement EMRO tools and unstructured interviews |
| Team | Two Doctor of Medicine (MDs), two technicians, drive and secretary | 10 data collectors with experience in PHC (physicians, nurses, pharmacists, managers) | Focal point from governorates | Consultant and one Ministry of Health (MOH) representative |
| Existing Routine Health Management Information System (RHMIS) | Routine data collection for routine curative and preventive activities | Existing household file and health information System | Electronic medical record (EMR) at each site | National system for performance indicators Ministry of Health (MOH). The United Nations Relief and Works Agency (UNWRA) e-Health program including performance indicators |
| Time at sites | ½ day | 3 days | 4–8 weeks/center | Two or more dates |
Implementation of pilot testing of the assessment tool and quality indicators in four countries—Tunisia, Iran, Oman and Jordan—following a five-step process including stakeholder engagement, assembling of a team, training and mapping of data sources, data collection, and analysis.
Intra-country variability in the EMRO primary health care core indicator pilot testing in Oman and Tunisia
| Oman | Tunisia | |
|---|---|---|
| % of pregnant women with 1st Antenatal Care (ANC) in 1st trimester | 31–90 (4 ANC: 57–100) | 11–98 (4 ANC: 15–84) |
| % of Hypertension (HTN) pts with initial labs | 23–100 | 62–98 |
| % of Hypertension (HTN) patients with Blood Pressure (BP) < 140/90 | 26–91 | 41–71 |
| % of patients with diabetes with controlled fasting blood sugar | 7–90 (A1C < 7: 3–70) | 66–97 |
| % of children fully immunized | 98–100 | 41–99 (1 > 100) |
| % of appropriate (upward) referrals during last 6 months (by specific conditions) | 7–100 | 14–49 |
| Average wait time (min) | 10–60 | 39–111 |
Identified gaps and challenges in measuring quality indicators
Several contextual factors influencing feasibility and appropriateness were identified. Countries with fragmented health systems are challenged in data collection and quality measurement. Another barrier is the lack of political commitment to address quality. The baseline capacity around quality improvement was missing in some facilities, particularly the absence of standardized quality parameters as safe injection, adverse events’ documentation and anemia screening. There were cross-cutting challenges in data collection and absence of locally adapted tools including staff and patients’ satisfaction, waiting time and tracking upwards referrals to specialists.
Scaling up and efforts toward institutionalization of quality indicators for PHC
Important steps were taken to address these contextual barriers. The Regional Committee of EMRO at its 63rd meeting in 2016 approved a resolution on adopting quality indicators for improving PHC quality, which provided wider support and national and regional endorsement [23]. Following the meeting, several countries including Iran, Libya, Oman, Pakistan, Palestine and Sudan began implementation. Oman managed data collection gaps by building local capacity for data collection and reporting. In Libya, a capacity-building workshop and development of a national road map for implementation ensued. In Pakistan, 45 focal points were trained on assessing and implementing the indicators and targeted a short-term roadmap for the implementation. Palestine began to develop a software to address some identified gaps in routine reporting. Sudan has included translation of the indicators list while focusing on training local focal points and identifying provinces to establish demonstration projects [24]. In Iran, remarkable work has been commissioned for the development of a national quality assessment framework for primary health care Primary health care quality assessment framework (PHCQAF) to address local priorities [25] (Figure 2).
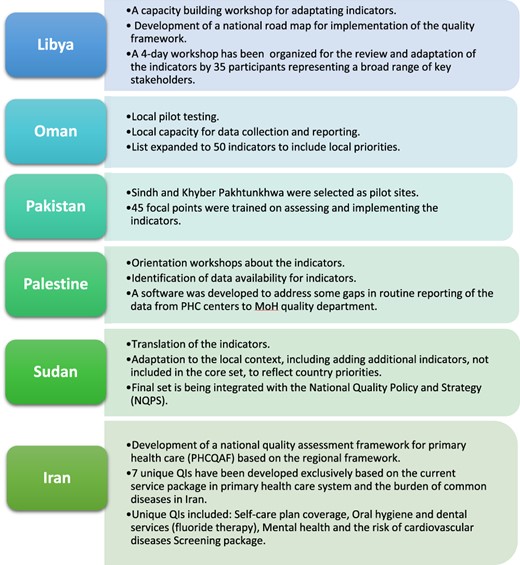
Schematic representation of adaption and implementation of the quality indicators in different countries in the EMR (Libya, Oman, Pakistan, Palestine, Sudan and Iran).
Discussion
Statement of principal findings
We describe the successful application of implementation research using Exploration, Preparation, Implementation and Sustainment framework to address gaps in measuring and monitoring PHC quality in EMR. A careful stepwise approach was employed to ensure feasibility, acceptability and appropriateness in different contexts. The final list resulted from a deeply inclusive and rigorous process designed to ensure country ownership through the Delphi process and feasibility through testing resulting in this list. The refined list of primary care metrics expanded the existing measurement to include provider competency, patient-reported experiences and safety [26]. This included early and frequent engagement of stakeholders, leveraging regional and global expertise, iterative testing and refinement based on rapid cycle pilot testing with early adoption by countries. The final set was not meant to be comprehensive but rather to represent priority areas for starting PHC quality measurement.
There was an agreement from the regional consultations that the core indicators and accompanying tools represent an opportunity for improving PHC. They will also allow benchmarking identifying practical models within and between countries. Importantly, this tool increased the focus on people-centeredness, reflecting global efforts to ensure the voices of the patients and providers are a priority [4, 5]. Recommendations for WHO included continuing to serve as a technical advisor and facilitator for exchange within and beyond the region.
Strengths and limitations
EMR countries have a diverse set of PHC systems and resources, and work to investigate the balance between local adaptations versus standardizing tools is underway to enhance national uptake. The flexibility and adaptability of this toolkit to local contexts are vital. Success in countries like Iran supports the possibility of using the toolkit in other countries and regions. The indicators were also designed to facilitate and encourage peer-to-peer learning through comparison and cross-country learning [9]. Moreover, LMICs in the EMR are especially challenged by underdeveloped health information systems that may impede measurement of quality. Therefore, the final set has defined areas for improvement, and some indicators were developed with deep considerations to what is feasible from a measurement perspective; yet, with the learning coming from the field aided by the continuous improvement, they can be updated. The list was not meant to be comprehensive but rather feasible as a starting point with the potential of the wide range of measurement capacity reflecting individual country’s capacity and priorities.
Not surprisingly, cross-cutting challenges in data collection were identified, including lack of electronic medical records, weak or inconsistent health information systems and a wide range of diversity in record-keeping practices [27]. In addition, a few indicators were not recorded either at all or in a reliable fashion in most or all countries. A wide range of quality standards even between sites in a single country reflected the absence of some standard practices (anemia screening and safe injections) and the absence of locally adapted tools that could feasibly and reliably measure core areas including staff and patients’ satisfaction, waiting times and tracking referrals to specialists. Based on the results, some countries started work to address measurement gaps. For example, Iran developed an injection safety five-item checklist and used existing validated surveys to measure staff and patient satisfaction and patient right’s assessment.
The EMR includes countries with significant conflicts, highlighting the need for better understanding of how to measure PHC quality in these settings; recent reports have highlighted the need to tailor measuring strategies of PHC quality in settings of extreme adversity [6]. Only one country piloted in a private PHC facility, while some have a more involved private sector in providing PHC; this calls for engaging private providers, voluntarily or through mandates, to share their results and increase accountability.
Interpretation within the context of the wider literature
Comparing this toolkit with other quality measurement tools is valuable for broader scope, continuous improvement and cross-regional learning. Although most of the tools are interconnected and developed using similar methods, they clearly reflect the context and priorities of health systems they were originally designed for. Similar to our tool, Rios-Zertuche et al. created metrics to measure the quality for MCH in LMICs from Latin and Central America. Having been tested in eight different LMICs, metrics were transferable, modifiable, replicable, comparable and can potentially be standardized [27]. Focusing on the impact of health systems, served populations, their needs, confidence and expectations of care processes, workforce and governance are also needed to ensure the effectiveness of the toolkit in improving PHC [28].
Implications for policy, practice and research
High-level political commitment is needed to translate measurement into actions. The metadata dictionary provides a common understanding that unifies care providers and policymakers. Effective collaboration with community partners and the civil society is also critical, including academic institutions driving research, private partners and global initiatives.
The selected indicators did not reflect the equity domain, and this calls on future disaggregation to measure potential inequity among population subgroups. It further highlights the need for strong data systems yet the indicators’ set reflected feasibility when tested in vulnerable settings as refugee camps which ensured measurement as a primary goal for this work.
This project has areas where ongoing work is planned. It is early in the process to determine the impact on improving the quality and sustainability of measurement, although a small subset of EMR countries have undertaken steps to make these indicators sustained. Strategies for sustainability include building measurement as part of National Quality and Policy Strategy and establishing national committees responsible for implementing quality indicators. Evidence of indicators’ sustainability and effectiveness are being followed over the next few years to evaluate and inform the improvement of PHC. Also, disaggregation of the collected data will uncover inequities and vulnerable groups’ needs and brings forward nuances for future integration into measurement.
There is also a need for sharing and integrating the framework with other global initiatives including PHCPI and the WHO Health Data Collaborative to align measurement work and continue the discussion about balancing local ownership with peer learning and regional benchmarking. Future work also includes further refinement of data collection tools as more experience is gained with advocating for exchange of experiences, tools and mutual learning.
Conclusions
Implementation strategies including country engagement, evidence from other measurement initiatives, testing and willingness to adapt based on field experience were successful in developing a core set of PHC quality indicators. Broader adoption is underway highlighting the potential of using the developed toolkit. Further adoption will take time, resources and more strengthening of the PHC. The approach emphasizes the need to encourage local ownership to drive improvement locally while leveraging peer learning. National commitment is needed to ensure the availability of resources and structure empowerment, utilize the data for change, advocate better community engagement and build the capacity to move the work forward to ensure the quality of people-centered PHC.
Acknowledgements
We wish to thank the experts who contributed to the different stages of development of this work:
Abdelmajid Ben Hmida, Ahmed Alboksmaty, Ahmed Mandhari, Ala Alwan, Ali Khader, Charles Shaw, David Wright, Ezzeddine Mohsni, Fouad Nasereddin, Ghada Ragab, Hassan Salah, Kathrin M. Cresswell, Jafar Tabrizi, Jaouad Mahjour, Khalid Saeed, Kid Kohl, Mahi Al Tehewy, Meriam Saweres, Ramez Mahaini, Rashad Massoud, Riham El-Asady, Ronan Glynn, Safa El Qsoos, Salem Al Wahabi, Salma Jaouni, Shanon Barkley, Slim Slama, Wendy Venter and Wesam Atif Mansour.
Funding
This study was funded by the World Health Organization Regional Office of the Eastern Mediterranean.
Ethical approvals
None declared.
Data availability statement
Data sources, results and reports produced from this study will be available upon request.
