


Abstract
Objective Previous studies have suggested complex associations among variables related to parental control of feeding and child/adolescent obesity. The current study examined associations between parental food control variables and weight outcomes in the context of a behaviorally based family treatment program. Methods Parents of youths (n = 93) enrolled in a clinical trial comparing 2 weight management interventions completed the Child Feeding Questionnaire pre- and post-treatment, and at a 12-month follow-up. Results Latent growth curve modeling indicated that mean levels of restriction decreased over the course of treatment in the Positively Fit (PF) condition. Youths in the PF treatment condition whose parents increased their restriction of food experienced greater decreases in zBMI over treatment. Conclusions Results echo previous reports that high and low parental control over food intake are associated with higher zBMI. Moderate parental control can be associated with beneficial outcomes in youths enrolled in behavioral treatment programs for obesity.
Current estimates suggest that approximately 32% of U.S. children and adolescents aged 2–19 years are overweight and 17% are obese (Ogden, Carroll, Kit, & Flegal, 2012). Recognizing the impact of pediatric obesity on children’s physical, emotional, social, and academic functioning (Vivier & Tomkins, 2008; Zeller & Modi, 2008), an Expert Committee convened by the American Medical Association, the Health Resources Services Administration, and the Centers for Disease Control and Prevention (CDC) outlined recommendations for the prevention, assessment, and treatment of overweight and obesity in children and adolescents (Barlow & The Expert Committee, 2007). Guidelines put forth by this committee emphasized changes in diet and physical activity as a central goal of intervention and prevention efforts, as well as the critical role of parents and other family members in effecting behavior change and treatment outcome.
The literature on comprehensive family lifestyle interventions for obesity highlights specific parental behaviors necessary for successful treatment outcome, including increasing the availability of healthy foods in the home, modeling healthy nutritional habits and physical activity, and reinforcing desired health behaviors (Kitzmann et al., 2010). Indeed, some studies have demonstrated that intervening with parents alone is equally effective as providing treatment to children and parents (Janicke et al., 2008).
Reflecting the importance of parental attitudes and behaviors in the development, prevention, and treatment of pediatric obesity, the Child Feeding Questionnaire (CFQ) was initially developed (Johnson & Birch, 1994) and then updated (Birch, Fisher, Grimm-Thomas, Markey, Sawyer, & Johnson, 2001) to assess parental perceptions and concerns about pediatric obesity, child feeding practices, and attitudes surrounding food intake and control. The dimensions measured on the CFQ include monitoring, restricting, and pressure to eat behaviors—collectively referred to hereafter as “parental food control variables.” Specifically, the restricting dimension refers to the degree to which the parent regulates the child’s intake of food, limits intake of high caloric foods, and uses food items as incentives for good behavior. The monitoring dimension assesses the degree to which the parent keeps track of the child’s intake of high-caloric foods, and the pressure dimension captures parental need to make sure that the child eats enough food.
As noted by Crouch, O’Dea, and Battisti (2007), the relationships among parental food control variables and child weight are “complex” (p. 157). In some studies—mostly conducted among nonclinical samples—parental food control variables have been positively associated with higher child food consumption and/or higher body mass index (BMI; Blissett, Meyer, & Haycraft, 2006; Fisher & Birch, 1999a, b, 2000; Francis & Birch, 2005; Jansen, Mulkens, & Jansen, 2007), particularly when food control is “excessive” (Birch & Fisher, 2000, p. 1059). Other studies, however, have found seemingly beneficial associations between parental food control variables (e.g., parental monitoring, restriction) and child weight-related outcomes (e.g., lower BMI or higher fruit/vegetable intake; Bourcier, Bowen, Meischke, & Moinpour, 2003; Faith et al., 2004; Farrow & Blissett, 2008; Musher-Eizenman & Holub, 2006; Rodgers et al., 2013). Still other studies have found no relationship between parental food control variables and child weight (Burrows, Warren, & Collins, 2010; Webber, Cooke, Hill, & Wardle, 2010).
Taken as a whole, the literature supports at least two views of the directionality of the associations among parental food control variables and children’s weight; either suggesting that elevated control techniques represent parental strategies to address perceived child adiposity (Costanzo & Woody, 1985), or, alternatively, that higher BMIs result from greater parental control of food (Musher-Eizenmann, Holub, Hauser, & Young, 2007). Because of the largely cross-sectional nature of the literature, and the reliance on nonclinical samples of children, and the mixed nature of the findings, conclusions regarding the associations among parental food control variables and weight-related health outcomes are limited.
The present study was designed to examine parental food control variables from the CFQ (monitoring, pressure to eat, and restriction) in the context of a randomized clinical trial of a behaviorally based family intervention for children and adolescents with obesity (Positively Fit; PF; Steele et al., n.d.) relative to an active control condition (Brief Family Intervention; BFI). Our earlier work with this program indicated that PF can produce clinically meaningful changes in children’s standardized body mass index (zBMI) and clinically significant changes in health-related quality of life (Steele et al., 2012). The present study allowed the examination of stability and change of CFQ variables across two treatment conditions, as well as the association between changes in CFQ variables and changes in zBMI from pre- to post-treatment assessments and at the 1-year follow-up.
We evaluated two hypotheses specific to outcomes related to the two aforementioned weight management treatments. First, because PF focused on (a) positive reinforcement for healthy nutrition, (b) changes in availability of food in the home, and (c) parental modeling of treatment components (see later for more complete description of the treatment program), we hypothesized treatment-specific increases in parent reported control, as measured by CFQ variables (e.g., restriction of child food intake, monitoring of food consumption), at the conclusion of treatment and at the 1-year follow-up. Specifically, we anticipated increases in pre- to post-treatment CFQ scores among families randomized to the PF condition relative to the BFI condition. Moreover, we hypothesized that the intervention would yield an increase in CFQ control scores from pre- to post-treatment as compared with the BFI group, which would be associated with decreases in child zBMI.
We also examined two hypotheses regarding the view that moderate (not excessive, see Birch & Fisher, 2000) control of food is a necessary precondition for healthy changes in available food in the home. Specifically, we hypothesized that parents who displayed moderate levels of control variables at baseline would demonstrate greatest reduction in zBMI over the PF intervention. We also hypothesized that moderation in control variables (i.e., either increases or decreases to a moderate level) during the active treatment period would be associated with reductions in zBMI.
Method
Participants
The results presented here are secondary analyses from data originally presented by Steele et al. (2012). Participants were recruited for a randomized clinical trial of a behaviorally based family intervention for pediatric obesity compared with an active control condition (Steele et al., 2012). Eligibility criteria for participation in the study included: (a) the participating child or adolescent was between 7 and 17 years of age, (b) the participant’s BMI percentile was categorized as overweight (i.e., BMI ≥ 85th percentile) or obese (i.e., BMI ≥ 95th percentile), (c) one parent was willing to participate in the intervention, (d) the participant did not have any serious mental illness or developmental delays, (e) the parent and child spoke English, (f) the parent provided written informed consent, and (g) the child verbally assented to participation. Demographic information collected from the parent at the initial assessment (N = 93) is presented in Table I.
Sample Characteristics at Pre-treatment Assessment (Time 1) by Treatment Group
| PF (treatment; N = 47) | Enhanced standard of care (ESC; N = 46) | |
|---|---|---|
| Child gender [% (n)] | ||
| Male | 44.7 (21) | 34.8 (16) |
| Female | 53.2 (25) | 65.2 (30) |
| Parent relation to child [% (n)] | ||
| Father | 6.4 (3) | 4.3 (2) |
| Mother | 91.5 (43) | 95.7 (44) |
| Other | 2.1 (1) | 0 |
| Age in years [M (SD)] | ||
| Parent | 40.38 (7.57) | 39.04 (7.15) |
| Child | 11.63 (2.48) | 11.52 (2.82) |
| Ethnicity (child) [% (n)] | ||
| White, not Hispanic | 74.5 (35) | 67.4 (31) |
| Black, not Hispanic | 10.6 (5) | 17.4 (8) |
| Hispanic | 2.1 (1) | 6.5 (3) |
| Native American | 2.1 (1) | 0 (0) |
| Other | 6.4 (3) | 4.3 (2) |
| Biracial | 4.3 (2) | 4.3 (2) |
| Education of parent [% (n)] | ||
| High school diploma or less | 12.8 (6) | 13.0 (6) |
| Vocational school/junior college graduate or some college | 36.0 (17) | 30.4 (14) |
| College graduate | 23.4 (11) | 37.0 (17) |
| Postgraduate work or graduate degree | 27.7 (13) | 19.5 (9) |
| Marital status [% (n)] | ||
| Parent married, living with spouse | 63.8 (30) | 58.7 (27) |
| Divorced | 25.5 (12) | 26.1 (12) |
| Not married, living with partner | 6.4 (3) | 8.7 (4) |
| Single, never married | 4.3 (2) | 4.3 (2) |
| Estimated monthly household income [% (n)] | ||
| <$2,000 | 19.1 (9) | 8.7 (4) |
| $2,000–$5,000 | 40.4 (19) | 45.7 (21) |
| >$5,000 | 21.3 (10) | 15.2 (7) |
| Unreported | 19.1 (9) | 30.4 (14) |
| Child BMI percentile for age [M (SD)] | 98.13 (1.92) | 98.24 (1.67) |
A total of 147 families were screened for eligibility. Of these, four were excluded because the participating child did not meet minimum age criteria (7 years). An additional 16 families (11%) refused to participate when contacted regarding enrollment. Of the remaining 127 families, 34 (23%) did not follow-up with study personnel for an initial appointment. The remaining 93 families were enrolled in the study (see Table I for sample characteristics). Families were stratified by age (i.e., ages 7–12; ages 13–17) and were randomized into intervention and control groups in blocks of four to seven families without replacement using a random number generator. Of the 93 families that were enrolled in the study, 14 (15%) did not complete any treatment sessions, 64 (69%) completed the post-treatment follow-up assessment, and 56 (60%) were available for the 1-year follow-up. A Consort diagram for the study is presented in the paper by Steele et al. (2012).
Procedures
Families seeking treatment for pediatric obesity contacted the project coordinator after being made aware of the study via physician or nurse referral, or after seeing the study advertisements. After completing an initial telephone screen to confirm eligibility, families attended a pre-treatment orientation session, and, if interested, parents provided informed consent and children completed assent. If consent and assent were obtained, pre-treatment data (including anthropometric data and self-report measures; Time 1) were collected from the participating child or adolescent and the parent or guardian most responsible for preparing meals for the child, after which they were block-randomized into either PF or BFI conditions and began treatment. Treatment sessions occurred at one of two clinics: one in an academic medical center and one in a university-based clinic. Participants attended the sessions at the location most convenient for them.
Participants completed an identical post-treatment assessment (Time 2) within 2 weeks of the final treatment session (i.e., 10–12 weeks following initial assessment). All participants were scheduled for another follow-up assessment 1 year following the end of the final treatment session (Time 3). Participants received $20 for completing pre- and immediate post-treatment assessments; participating families received $50 for completing the 1-year follow-up assessment. All study procedures were approved by the first author’s institutional review board.
Description of Interventions
Positively Fit
This manualized intervention (Steele et al., n.d.) is composed of 10 weekly group treatment sessions lasting approximately 90 min each in duration. Each treatment session consisted of nutrition/physical activity education, behaviorally based family therapy, and a goal-setting period. Parents and children attended separate meetings for both nutritional/physical activity education and behavioral components of the treatment and convened for the concluding goal-setting portion of the session. Behavioral treatment sessions addressed topics including stimulus control, rewards for change, modeling, goal setting, and lifestyle change and were conducted by masters-level clinicians under the supervision of a licensed clinical psychologist. Nutritional sessions were conducted by a registered dietician, and focused on understanding nutritional information and portion control, planning for special occasions, and increasing knowledge of and participation in physical activity.
Brief Family Intervention
Participants randomized to the BFI condition participated in the Trim Kids manualized treatment program (Sothern, von Almen, & Schumacher, 2002). Consistent with the authors’ recommendations, participants received three 60-min individual face-to-face visits with a licensed dietitian. Families in this condition received the Trim Kids manual at Time 1 assessment and were instructed to read the first four book chapters prior to their first meeting with the dietitian. Subsequently, participating families attended three meetings with the dietitian over the course of 10 weeks where meal planning, basic nutritional principles, physical activity, and energy balance principles were discussed.
Measures
Demographic Information
Family demographic information, including child age, gender, ethnicity, family income, and number of family members living in the home, was collected by the participating child’s parent or guardian at the pre-treatment orientation session.
Anthropometric Variables
Child weight was measured using a calibrated electronic scale (SECA 813). Height was obtained using a portable stadiometer (SECA 214). Height, weight, and age at Time 1, Time 2, and Time 3 were used to calculate BMI for children and adolescents. Conversion of height, weight, and age values to BMI z-scores was performed using a SAS program provided by the CDC (Centers for Disease Control and Prevention [CDC], 2007).
Child Feeding Questionnaire
The CFQ (Birch et al., 2001) is a 31-item parent self-report measure of attitudes and behaviors toward food, food intake, and child weight issues. Items on the CFQ are scored on a 5-point Likert-type scale with end points of (1) Never and (5) Always. The CFQ has demonstrated construct validity (i.e., in terms of factor structure) across a wide range of age and culture groups (Anderson, Higes, Fisher, & Nicklas, 2005; Boles et al., 2010; Corsini, Danthiir, Kettler, & Wilson, 2008). Validity of the instrument has been further demonstrated by correlations with parental mealtime behaviors (Moens, Braet, & Soetens, 2007); adolescent self-esteem, teasing, and quality of life (Stern et al., 2006); as well as parent and child weight status and level of family conflict (Hooper, Burnham, & Richey, 2009). Previous investigations using this measure have reported good reliability, with internal consistency estimates (Cronbach’s alpha) between 0.60 and 0.93 (Birch et al., 2001; Corsini et al., 2008; Crouch et al., 2007; Kaur et al., 2006). Alpha coefficients for subscales of the CFQ in the present study were .69 (monitoring subscale; e.g., How much do you keep track of the high fat foods that your child eats?), .73 (pressure to eat subscale; e.g., If my child says “I’m not hungry,” I try to get him/her to eat anyway), and .82 [restriction subscale; e.g., I have to be sure that my child does not eat too many sweets (candy, ice cream, cake or pastries)]. Although participants completed the entire CFQ, only items comprising the three food control subscales (i.e., monitoring, pressure to eat, and restriction) were analyzed in the present study.
Statistical Analyses
Latent growth curve modeling (LGCM), an ideal method for examining inter-individual change trajectories and intra-individual differences in trajectories over time (Duncan & Duncan, 2004), was used to examine changes in parental restriction, pressure, and monitoring over time and the association between changes in these variables and zBMI. LGCM offers several advantages over traditional methods of assessing change over time, including avoiding inflation of type I error, accounting for measurement error, and allowing for full-information maximum likelihood (FIML) parameter estimation. To explore potential differences in weight change trajectories associated with CFQ variables, general growth mixture analysis (GGMA) was used. GGMA allows the researcher to specify latent categorical variables to represent subpopulations that are inferred from the data rather than established a priori (Muthén, 2002).
A primary focus of the present study was to assess the influence of parental feeding practices on participant’s zBMI over time. Measurements completed at baseline, post-treatment, and 12-month follow-up were used as observed variables. Therefore, observed slope estimates represent linear increases/decreases in target variables. Consistent with our stated hypotheses, treatment type was used as a grouping variable in analyses. No significant differences between groups at the initial assessment were found for zBMI. Chi-square analyses did not indicate significant differences in ethnicity between treatment conditions (p > .50). All statistical models were tested using MPlus (Muthén & Muthén, 2010). Missing data resulting from participant attrition were accounted for statistically using FIML.
Results
Latent Growth Curve Models
First, three two-group (i.e., PF and BFI) latent growth curve models were constructed to examine changes in the three food control variables parent (i.e., monitoring, pressure to eat, and restriction) and associations between changes in these constructs and changes in zBMI over time. To maximize the power of the parameter estimates, each of the three models included only one of the three CFQ constructs and zBMI, resulting in a parallel process growth model. Estimation of model parameters was based on robust maximum likelihood. Baseline models without equality constraints on the mean or variances of the intercept and slope factors fit the data well according to fit indices (Table II). CFQ scores are presented by treatment group and assessment in Table III.
Overall Model Fit and Growth Trajectory (Slope) for Baseline Growth Models
| Model | PF | BFI | Overall model fit | |||||
|---|---|---|---|---|---|---|---|---|
| Intercept | Slope | Intercept | Slope | χ2(df) | CFI | TLI | RMSEA | |
| Restriction | 11.29 (14) | 1.00 | 1.00 | 0.00 | ||||
| Mean | 4.24** | −0.23** | 4.18** | −0.12 | ||||
| Variance | 0.63** | 0.13 | 0.62** | 0.13 | ||||
| Pressure | 13.00 (15) | 1.00 | 1.00 | 0.00 | ||||
| Mean | 2.22** | 0.07 | 2.28** | 0.15 | ||||
| Variance | 0.17** | 0.05 | 0.34** | 0.01 | ||||
| Monitoring | 11.44 (12) | 1.00 | 1.00 | 0.00 | ||||
| Mean | 3.54** | 0.35** | 3.62** | 0.28** | ||||
| Variance | 0.20 | 1.21 | 0.16 | −0.70 | ||||
| zBMI | ||||||||
| Mean | 2.21** | −0.05** | 2.24** | 0.05** | ||||
| Variance | 0.13** | 0.01 | 0.10* | 0.00 | ||||
Note. All intercept and slope values are unstandardized. CFI = comparative fit index; TLI = Tucker–Lewis index; RMSEA = root mean square error of approximation. *p < .05; **p < .01. Because zBMI was included in each of the three constructs in the parallel process models, fit statistics for each model apply to zBMI.
CFQ Scores (Parent) and zBMI (Child) by Treatment Group
| Group | Assessment | n | CFQ subscale scores | BMI (z-score) | ||
|---|---|---|---|---|---|---|
| Restriction | Pressure | Monitoring | M ± SD | |||
| M ± SD | M ± SD | M ± SD | ||||
| PF | T1 | 47 | 4.23 ± .81 | 2.24 ± .56 | 3.57 ± .86 | 2.18 ± .38 |
| T2 | 32 | 4.12 ± 1.00 | 2.09 ± .48 | 3.91 ± .80 | 2.11 ± .42 | |
| T3 | 29 | 3.78 ± 1.21 | 2.28 ± .67 | 3.44 ± .93 | 1.99 ± .46 | |
| BFI | T1 | 46 | 4.18 ± .94 | 2.26 ± .65 | 3.63 ± .85 | 2.23 ± .30 |
| T2 | 31 | 4.10 ± 1.11 | 2.13 ± .58 | 3.95 ± .63 | 2.18 ± .34 | |
| T3 | 28 | 4.00 ± .84 | 2.74 ± .86 | 3.65 ± .75 | 2.08 ± .61 | |
Note. T1 = pre-treatment assessment, T2 = post-treatment assessment, T3 = 1 year post-treatment assessment. PF = Positively Fit; BFI = Brief Family Intervention. CFQ subscale scores (means of individual items) range from 1 to 5.
To examine potential differences between individuals receiving different treatment types (i.e., PF or BFI), baseline models without equality constraints on the change rate (slope factor) were compared with models that had equality constraints imposed on the change rate parameters. These models were then compared using the chi-square difference test conducted using model fit statistics from the nested models, with degrees of freedom equal to the difference in number of parameters between models (i.e., 1 degree of freedom). These tests were based on the formula described at http://statmodel.com/chidiff.shtml. The chi-square difference test indicated that zBMI decreased significantly faster in the treatment group (i.e., PF) than the control group (i.e., BFI), χ2dif = 786.23, dfdif = 1, p < .00. The correlation between change in restriction and change in zBMI was significant in the PF group (ϕ = −.69, z = 1.87, p < .03, one-tailed test), whereas it was not significantly different from zero in the BFI group (ϕ = −.30, z = 0.37, p > .70). Chi-square difference tests suggested that changes in other two CFQ constructs (i.e., pressure, monitoring) and their correlations with zBMI were not significant. These results indicate that parents in the PF group reported more increases in restriction that were associated with better weight outcomes compared with BFI treatment participants.
Latent Growth Mixture Models
In the second step, evaluating our hypothesis that moderate baseline levels of food control would predict more weight loss than extremely high or low control, the moderating effects of each construct on treatment outcome were examined by fitting a growth mixture model to participants whose parents reported high, moderate, and low levels of each of the three food control constructs at baseline. High, moderate, and low categories were established as part of the growth mixture model (i.e., model-based group specification). The parallel growth mixture model was fit using Bayesian estimation with default maximum likelihood estimates as priors. Results of these tests indicated that among participants receiving the PF intervention (n = 47), moderate baseline levels of restriction (class #2; intercept α = 4.38) were associated with reductions in zBMI (ϕ = −.10*, p < .05: n = 32; 68%), whereas low baseline restriction (class #1; intercept α = 0: n = 6; 13%) and high baseline restriction (class #3; intercept α = 4.70; n = 9; 19%) were not associated with reductions in zBMI. Among participants receiving the BFI intervention (n = 46), high baseline (class #3; intercept α = 4.56; ϕ = −.10*, p < .05; n = 8, 17%) and low baseline (class #1; intercept α = 2.49; ϕ = −.06*, p < .05; n = 14; 31%) levels of restriction were associated with reductions in zBMI, whereas moderate restriction was not (class #1; intercept α = 4.55; n = 24, 52%;). These results are presented graphically in Figures 1 and 2. The proportion of participants in the PF group who demonstrated statistically significant reductions in zBMI (only those who had moderate parent-reported restriction) was significantly larger than those in the BFI group who attained this outcome (both high and low baseline restriction groups; z = 2.25, p = .01).
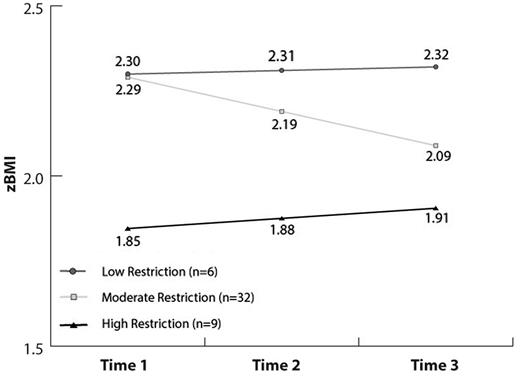
zBMI change trajectories of PF group.
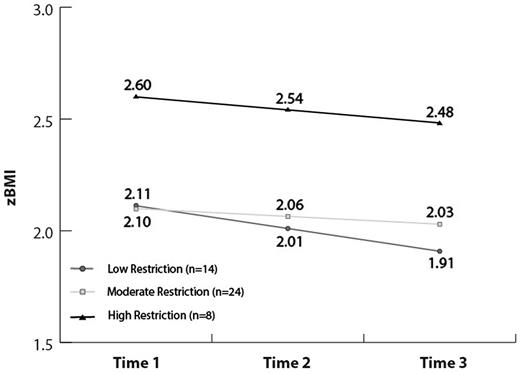
zBMI change trajectories of BFI group.
In the third step, we tested our hypothesis that moderation in CFQ variables over the course of treatment would be associated with reductions in zBMI. Moderation included either increases or decreases in control variables to a moderate level during the 10-week treatment period. zBMI outcomes for participants who began the study reporting moderate levels of control variables and maintained similar values for these variables over time are not evaluated explicitly because the model was designed to examine growth (i.e., change) processes. Because missing data resulting from participant attrition at Time 2 affected power to achieve model convergence and detect statistically significant differences, multiple imputation (with 30 unique imputations) was conducted using Mplus prior to constructing a GGMM. This growth model was also fit using Bayesian estimation. Consistent with the previous model, high, moderate, and low categories were established for change in restriction. Results from this model did not provide evidence in support of this hypothesis for either the PF or BFI groups.
Discussion
The present study was designed to examine associations between parental control of children’s food intake (using the CFQ; Birch et al., 2001) and child weight outcome in a sample of families seeking treatment for pediatric obesity. Previous research has provided conflicting reports of the associations between parental food control variables and child weight and treatment outcomes. The present study adds to the literature by using LGCM to examine intra-individual and inter-individual change in parental monitoring, control, and pressure, as well as the associations among these constructs over the course of treatment and between treatment and control groups.
We hypothesized that participation in PF would be associated with increased levels of parental control of food intake, and that moderate levels of control variables would be associated with decreasing zBMI. Results partially supported these hypotheses. Although mean levels of restriction decreased over the course of treatment, LGCMs indicated that children in PF whose parents increased their restriction of food experienced greater decreases in zBMI over treatment. Consistent with recommendations in the literature (Barlow et al., 2007; Kitzmann et al., 2010), PF helps families work together to monitor caloric intake, to limit access to foods with high caloric density, and to manage portion sizes. Although our results cannot speak to issues of causality, our results most closely mirror the findings of Epstein, Paluch, Beecher, and Roemmich (2008), who suggested that increased parental restriction can have beneficial effects over the course of treatment and a 1-year follow-up. Specifically, Epstein and colleagues found that children in a treatment condition (i.e., increasing healthful foods) showed favorable long-term change if they had high levels of CFQ variables. Our results do not allow specification of which treatment components were most closely associated with parental food control variables, nor which treatment components were associated with outcomes.
Importantly, our results also speak to the degree of parental restriction that can be beneficial. Consistent with our second hypothesis, moderate baseline levels of parental restriction in the PF group were associated with positive health outcomes (i.e., decreased zBMI), whereas high and low levels of restriction were not significantly associated with this outcome. In fact, low levels of parental baseline restriction were associated with static high levels of child zBMI, suggesting that this is a “high needs” group that may be unresponsive to current intervention strategies and may be in need of increased or targeted support. While the high baseline restriction group had lower zBMIs at Time 1 and were able to maintain lower zBMI scores over treatment, they were also not responsive to the intervention. The group whose parents displayed moderate baseline levels of restriction, however, responded well to treatment and lost significant amounts of weight over time.
It is important to underscore that the restriction being contemplated here is in the context of a supportive group intervention. As noted previously, the intervention was designed with a view that some parental control of foods available in the home is necessary for positive outcomes. This finding does not contradict previous results. Indeed the finding that high restriction was not associated with beneficial outcomes is consistent with much of the literature (Fisher & Birch, 2000; Francis & Birch, 2005; Jansen, Mulkens, & Jansen, 2007). However, our results speak to the potentially beneficial impact of moderate control in the context of behaviorally based family interventions (Musher-Eizerman & Holub, 2006). Our results, if confirmed in subsequent studies, suggest that families entering therapy with very low or very high control of child feeding may need to modify their feeding practices to approach moderate control if they are to be successful in behaviorally based interventions for obesity.
In contrast to the aforementioned finding, our results regarding families in the BFI condition (i.e., nutritional education with a self-guided book) indicate a less dynamic relationship among control variables and zBMI. Results suggest that the high restriction group entered with and maintained high levels of zBMI, whereas the low and medium restriction groups entered and maintained lower levels of zBMI. It may be worth noting that the associations between restriction and zBMI outcomes in these extreme groups (high and low) closely mirror findings in the literature (Crouch et al., 2007; Powers, Chamberlin, van Schaick, Sherman, & Whitaker, 2006). In contrast to families in the PF condition, those in the BFI maintained relatively consistent restriction levels across assessments—limiting the degree to which dynamic associations among restriction and zBMI could be identified.
Our results failed to support the hypothesis that moderation of CFQ variables over the course of treatment (i.e., either decreases or increases to a moderate level) would be associated with decreased zBMI. This result is surprising in light of our other finding that participants with moderate levels of restriction were the only group to lose significant amounts of weight over the course of the intervention. One potential explanation for this finding is that model-based extreme subgroups (high and low on control variables) were quite small; a problem that was exacerbated by subdividing the sample by treatment type. This limitation may have affected our power to detect movement toward moderate control and associated changes in weight outcome. Also possible is that the relationship between change in parental control and change in child zBMI is more complex, and is perhaps mediated by other variables that were not addressed in the PF intervention.
The literature as a whole underscores the importance of monitoring levels of parental food control variables before and during the course of pediatric weight loss interventions. Consistent with the larger literature (Epstein et al., 2008), our results highlight that extremely low or high levels of parental control are associated with higher child zBMI, and that moderate levels of control can be associated with decreased child zBMI, particularly in the context of a family-based behavioral treatment for obesity. Although our results cannot directly inform clinical practice, they suggest that efforts to encourage “moderate” parental control may be associated with better clinical outcomes. Given that the literature does not provide metrics for “extreme” or “moderate” control, clinicians are urged to consider parental control variables in the context of child developmental level, clinical presentation, and overall parenting variables.
Methodologically, our study brings a number of important advantages to the literature. First, our use of LGCM allowed a more refined analysis of level of parental control variables than previous studies using linear regression or analysis of variance models. Specifically, this technique revealed an important distinction among three levels of restriction, departing from previous studies that only separated participants into high and low groups (Epstein et al., 2008). To our knowledge, this is the first study on CFQ variables and outcomes in a pediatric weight management study to use these advanced techniques. Furthermore, our study examined unique hypotheses related to an intervention designed to alter parental feeding practices. Our longitudinal study design enabled us to examine parent feeding practices and weight outcomes 1 year after treatment, a design feature that is also unique in the CFQ literature.
Although important, our study is not without limitations. First, our sample size, although sufficient to yield very strong model fit indices, was not adequate to test important potential moderators of parent control–child weight associations. Of particular importance will be future studies that further examine the impact of child age and gender and perhaps broader environmental (family) context on the relationship between parental control variables and weight-related outcomes (Rhee, 2008). Our sample size was also insufficient to examine the impact of culture or ethnicity on the relationships among CFQ variables and child weight-related outcomes.
A few factors limit the generalizability of our findings. First, the generalizability of our findings is limited to children and families seeking treatment for pediatric obesity. As indicated in Table I, the sample was significantly overweight (mean BMI percentile = 98.2 across both groups). Whether the associations among the variables demonstrated here hold in less overweight samples, or in samples of children and families not seeking treatment for obesity, is not known. Second, the generalizability of our findings is limited by our predominantly non-Hispanic Caucasian study sample. Third, the relatively high attrition rate in our sample places some constraints on the generalizability of our findings. Finally, some authors (Vaughn, Tabak, Bryant, & Ward, 2013) have criticized the CFQ for its focus on more “negative” food-related parenting practices. A diversity of instruments measuring the constructs of interest in future studies will ensure the validity of conclusions regarding parenting practices and child weight-related outcomes.
In conclusion, our findings demonstrate that parental levels of restriction are critical contributors to success in a family-based weight management intervention. Our findings suggest that, in particular, participants with moderate levels of parental food restriction seem to respond well to intervention (i.e., demonstrate reductions in BMI), whereas participants with low and high levels of food restriction may require more targeted support to achieve similar success in treatment. Additional research with a larger sample is needed to understand the mechanisms of these relationships and the directionality of the correlations.
Funding
This study was supported, in part, by grant R40 MC 06631 from the Maternal and Child Health Bureau (Title V, Social Security Act), Health Resources and Services Administration, Department of Health and Human Services, awarded to the first author.
Conflicts of interest: None declared.
