


Abstract
Excess body weight is an established cause of postmenopausal breast cancer, but it is unknown if weight loss reduces risk.
Associations between weight change and risk of breast cancer were examined among women aged 50 years and older in the Pooling Project of Prospective Studies of Diet and Cancer. In 10 cohorts, weight assessed on three surveys was used to examine weight change patterns over approximately 10 years (interval 1 median = 5.2 years; interval 2 median = 4.0 years). Sustained weight loss was defined as no less than 2 kg lost in interval 1 that was not regained in interval 2. Among 180 885 women, 6930 invasive breast cancers were identified during follow-up.
Compared with women with stable weight (±2 kg), women with sustained weight loss had a lower risk of breast cancer. This risk reduction was linear and specific to women not using postmenopausal hormones (>2–4.5 kg lost: hazard ratio [HR] = 0.82, 95% confidence interval [CI] = 0.70 to 0.96; >4.5–<9 kg lost: HR = 0.75, 95% CI = 0.63 to 0.90; ≥9 kg lost: HR = 0.68, 95% CI = 0.50 to 0.93). Women who lost at least 9 kg and gained back some (but not all) of it were also at a lower risk of breast cancer. Other patterns of weight loss and gain over the two intervals had a similar risk of breast cancer to women with stable weight.
These results suggest that sustained weight loss, even modest amounts, is associated with lower breast cancer risk for women aged 50 years and older. Breast cancer prevention may be a strong weight-loss motivator for the two-thirds of American women who are overweight or obese.
In 2016, the World Health Organization estimated that 40% of women worldwide were overweight or obese (1). In the United States, more than two of every three adult women were overweight or obese as of 2014 (2). Although high body mass index (BMI) is an established risk factor for postmenopausal breast cancer (3,4), currently there is insufficient evidence to determine if the increased risk from excess body weight is reversible (4). Given that breast cancer is the most commonly diagnosed cancer in women worldwide (5), the question of whether weight loss can reduce breast cancer risk is of great public health importance.
Bariatric surgery studies suggest that weight loss may reduce breast cancer risk (6–9), but results from studies of surgical weight loss may not be applicable to the general population. Bariatric surgery patients are a select group in that they undergo health screening before surgery, have an extremely high body weight before surgery, lose extremely large amounts of weight in a short period of time, and undergo hormonal and metabolic changes from the surgery that induce more pronounced biological responses than shown with the generally modest weight loss obtained through diet and exercise (10). Results on weight loss and breast cancer from most population-based observational studies have been null but were limited by small numbers of women who lost weight (3). Importantly, most of these studies did not assess sustained weight loss and focused on changes in body weight from early (aged 18–20 years, when women tended to be at their leanest) to middle or later (aged 40 years and older) adulthood. Results from three (11–13) of four (11–14) prospective studies that examined weight loss during middle or later adulthood suggested that weight loss during this time period may be associated with lower breast cancer risk. Furthermore, two (11,12) of the studies suggest that sustained weight loss is of particular importance for postmenopausal breast cancer risk. In these studies, however, weight loss was rare, particularly sustained weight loss, and sample size was extremely limited.
Using the Pooling Project of Prospective Studies of Diet and Cancer (DCPP), we set out to estimate the association of sustained weight loss in middle or later adulthood on subsequent breast cancer risk. This analysis includes more than 180 000 women aged 50 years and older from 10 prospective studies with three or more weight measures before breast cancer follow-up. Although some women from previously published reports (11,12,14) are included, this analysis is the first to be sufficiently powered to examine the important question of whether sustained weight loss can impact breast cancer risk.
Methods
Study Population
The DCPP is an international consortium of prospective cohort studies established in 1991 to examine associations between dietary factors and cancer risk among women with no history of cancer (except nonmelanoma skin cancer) (15). The current analysis includes 10 cohorts from the United States, Australia, and Asia (Table 1) that had at least three surveys with reported [or measured (16, 17)] body weights and breast cancer incidence data (16–24). Data were harmonized across studies. Each study was approved by its respective institutional review board. The present study was restricted to women aged 50 years and older at first weight measure. Women who were alive and cancer free at the start of follow-up (between 1996 and 2004 depending on the individual study) were considered for the analytic cohort (n = 232 733). Women who did not report updated weight information (n = 48 039) or reported extreme values for BMI, weight, or height (BMI ≥ 59 kg/m2, height <1.2 m, height ≥2.0 m, or weight ≥225 kg; n = 3809) were excluded from the study population.
Characteristics of the 10 cohorts in the pooled analyses on weight change and breast cancer risk among women aged 50 years and older in the Pooling Project of Prospective Studies of Diet and Cancer (DCPP)
| Cohort | Country | Cohort enrollment year(s) | Analytic cohort size* | Total breast cancer cases | Median (IQR) length of weight change interval 1, y† | Median (IQR) length of weight change interval 2, y† | Median (IQR) breast cancer follow-up, y‡ | Median (IQR) age at weight 1, y | Median (IQR) BMI at weight 1, kg/m2 | Median (IQR) BMI at weight 2, kg/m2 | Median (IQR) BMI at weight 3, kg/m2 |
|---|---|---|---|---|---|---|---|---|---|---|---|
| CLUE II: Campaign Against Cancer and Heart Disease | USA | 1989 | 2263 | 86 | 7.1 (6.9–7.2) | 3.8 (3.8–3.9) | 14.5 (9.8–14.5) | 60 (50–65) | 25.6 (23.0–28.8) | 26.1 (23.5–29.6) | 26.4 (23.5–29.8) |
| Cancer Prevention Study-II Nutrition Cohort | USA | 1992–1993 | 48 280 | 1438 | 5.0 (4.1–5.0) | 3.9 (3.8–4.0) | 8.3 (7.8–8.3) | 61 (57–66) | 24.9 (22.5–28.1) | 25.1 (22.6–28.3) | 25.2 (22.7–28.6) |
| Iowa Women’s Health Study | USA | 1986 | 20 377 | 1117 | 6.7 (6.7–6.7) | 4.9 (4.9–4.9) | 14.3 (9.9–14.3) | 61 (58–64) | 25.9 (23.5–29.3) | 26.4 (23.7–29.8) | 26.5 (23.6–29.9) |
| Japan Public Health Center- Based Study Cohort I | Japan | 1990 | 8111 | 82 | 4.9 (4.7–5.0) | 5.0 (4.9–5.0) | 10.9 (10.9–10.9) | 54 (52–57) | 23.7 (22.0–25.8) | 23.7 (21.9–25.8) | 23.7 (21.8–25.8) |
| Japan Public Health Center- Based Study Cohort II | Japan | 1993–1994 | 11 316 | 74 | 4.9 (4.9–5.0) | 4.8 (4.7–4.9) | 8.0 (7.9–8.0) | 59 (54–63) | 23.8 (22.1–25.9) | 23.7 (21.9–25.8) | 23.5 (21.6–25.6) |
| Melbourne Collaborative Cohort Study | Australia | 1990–1994 | 7125 | 173 | 3.9 (3.7–4.2) | 7.2 (6.3–8.3) | 6.6 (5.6–7.4) | 59 (54–64) | 25.8 (23.4–29.0) | 25.6 (23.2–28.8) | 26.4 (23.6–29.9) |
| Nurses’ Health Study | USA | 1986 | 36 417 | 2154 | 5.9 (5.9–6.0) | 4.0 (4.0–4.0) | 16.5 (13.1–16.5) | 57 (53–61) | 24.7 (22.3–27.9) | 25.3 (22.8–28.7) | 25.6 (23.0–29.1) |
| New York University Women’s Health Study | USA | 1985 | 4745 | 310 | 9.0 (9.0–10.0) | 3.0 (3.0–3.0) | 12.0 (11.0–12.9) | 57 (54–61) | 24.8 (22.7–27.7) | 25.1 (22.7–28.4) | 25.2 (22.8–28.5) |
| Women’s Health Initiative Clinical Trial | USA | 1993–1998 | 22 240 | 903 | 4.2 (4.1–4.2) | 4.0 (4.0–4.0) | 10.9 (6.8–11.9) | 60 (55–66) | 27.6 (24.5–31.7) | 27.9 (24.6–32.0) | 27.7 (24.5–31.8) |
| Women’s Health Study | USA | 1992–1995 | 20 011 | 593 | 5.3 (5.2–5.3) | 5.5 (5.1–5.8) | 5.6 (5.4–5.7) | 56 (53–61) | 25.0 (22.7–28.4) | 25.9 (23.2–29.3) | 25.8 (23.1–29.3) |
| Total | — | 1985–1998 | 180 885 | 6930 | 5.2 (4.4–5.9) | 4.0 (3.9–4.9) | 8.3 (6.9–12.8) | 59 (55–64) | 25.1 (22.7–28.3) | 25.6 (22.9–29.0) | 25.6 (22.9–29.1) |
Cohort size was calculated after excluding participants <50 years old, with a history of cancer (except nonmelanoma skin cancer) prior to the third body weight measure, and missing, extreme, or implausible values for BMI (<18.5 kg/m2 or ≥59 kg/m2), height (<1.22 m or ≥2.0 m), or weight (≥225 kg) on any of the surveys used to calculate weight change along with exclusions previously made by the DCPP for participants who reported extreme or implausible values for energy intake. BMI = body mass index; IQR = interquartile range; USA = United States of America.
Interval 1: Median number of years between weight 2 and weight 1; Interval 2: median years between weight 3 and weight 2.
Median years between the end of interval 2 (weight 3) and the end of follow-up (first of date of incident breast cancer diagnosis, death, loss to follow-up, or administrative end of follow-up for the cohort).
Case Ascertainment
Incident invasive breast cancer cases were confirmed by medical records or cancer registry linkage. Some studies identified additional cases through linkage to mortality registries. Estrogen receptor (ER) status was available for 89.7% of cases.
Weight Change Assessment
Weight change was assessed using surveys at three time points before breast cancer follow-up began (Figure 1). On average, the weight change assessment period was 10 years total, including two approximately 5-year intervals. For a given interval, stable weight was defined as plus or minus 2 kg. Amount of weight change was assigned based on the first interval, whereas the second interval was used only to determine whether the initial weight loss and/or gain was sustained. Weight loss in the first interval was categorized as follows: more than 2 to 4.5 kg, more than 4.5 to less than 9 kg, or more than equal 9 kg lost. Weight gain was categorized as follows: more than 2 to 4.5 kg, more than 4.5 to less than 9 kg, 9 to less than 13.5 kg, or more than equal 13.5 kg gained. These cut points were selected as those that could examine the most extreme amounts of weight change, with as much granularity as possible, while maintaining adequate sample size. We then evaluated whether the weight change that occurred during interval 1 was sustained, somewhat sustained, or not sustained during interval 2. A 24-category variable was used to describe weight change patterns across the two intervals (Table 2). The referent group was women with stable weight across both intervals. Sustained weight loss was weight lost in the first interval that was not regained in the second interval. Likewise, sustained weight gain was weight gain in the first interval that was not subsequently lost. The remaining categories included women whose weight changes showed more fluctuation between interval 1 and interval 2. Women with the same starting and ending weight could end up in different categories depending on whether they gained, lost, or maintained the same weight during the first interval.
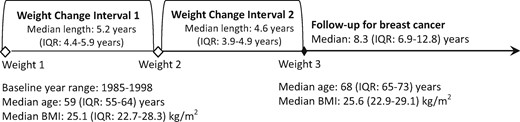
Schematic of weight loss intervals in relation to breast cancer risk among women aged 50 years and older in the Pooling Project of Prospective Studies of Diet and Cancer. BMI = body mass index; IQR = interquartile range (25th percentile–75th percentile).
Association between weight-change patterns over two time intervals (about 5 years each) and risk of breast cancer among 180 855 women aged 50 years or older in 10 cohorts in the Pooling Project of Prospective Studies of Diet and Cancer
| Weight change during interval 1* (weight 2–weight 1)† | Weight change during interval 2*(weight 3–weight 2)† | Total | No. cases | Person-years | HR (95% CI)‡ | MV |
|---|---|---|---|---|---|---|
| No. | HR (95% CI)§ | |||||
| Weight loss >2–4.5 kg | Kept the weight off or lost more weight | 10 169 | 338 | 92 857 | 0.91 (0.81 to 1.03) | 0.87 (0.77 to 0.99) |
| Weight loss >4.5–<9 kg | 7173 | 237 | 64 628 | 0.90 (0.78 to 1.03) | 0.84 (0.73 to 0.96) | |
| Weight loss ≥9 kg | 2352 | 73 | 19 680 | 0.83 (0.66 to 1.06) | 0.74 (0.58 to 0.94) | |
| Weight loss >2–4.5 kg | Some regain of the lost weight | 19 | 0 | 168 | N/A‖ | N/A‖ |
| Weight loss >4.5–<9 kg | 2383 | 105 | 22 647 | 1.13 (0.92 to 1.38) | 1.06 (0.87 to 1.30) | |
| Weight loss ≥9 kg | 2316 | 80 | 21 443 | 0.87 (0.69 to 1.09) | 0.77 (0.62 to 0.97) | |
| Weight loss >2–4.5 kg | Gained back all previously lost weight back or gained more weight | 9304 | 342 | 88 677 | 0.97 (0.86 to 1.10) | 0.94 (0.83 to 1.06) |
| Weight loss >4.5–<9 kg | 4546 | 170 | 42 988 | 0.99 (0.84 to 1.16) | 0.91 (0.78 to 1.07) | |
| Weight loss ≥9 kg | 1109 | 48 | 10 219 | 1.15 (0.86 to 1.54) | 1.02 (0.76 to 1.37) | |
| Stable weight (within +/- 2 kg) | Lost >2 kg | 16 557 | 539 | 147 925 | 0.96 (0.86 to 1.06) | 0.92 (0.83 to 1.02) |
| Stable weight (within +/- 2 kg of baseline) | 36 744 | 1234 | 352 805 | 1.00 Referent | 1.00 Referent | |
| Gained >2 kg | 20 819 | 861 | 203 933 | 1.07 (0.98 to 1.17) | 1.05 (0.96 to 1.15) | |
| Weight gain >2–4.5 kg | Lost all previously gained weight or lost more | 11 252 | 404 | 105 149 | 0.93 (0.83 to 1.05) | 0.90 (0.81 to 1.01) |
| Weight gain >4.5–<9 kg | 5245 | 198 | 47 232 | 0.97 (0.84 to 1.13) | 0.91 (0.78 to 1.06) | |
| Weight gain 9–<13.5 kg | 843 | 29 | 7355 | 0.95 (0.66 to 1.37) | 0.87 (0.60 to 1.26) | |
| Weight gain ≥13.5 kg | 261 | 14 | 2140 | N/A‖ | N/A‖ | |
| Weight gain >2–4.5 kg | Lost some of the weight gained | 27 | 2 | 283 | N/A‖ | N/A‖ |
| Weight gain >4.5–<9 kg | 3450 | 146 | 33 146 | 1.06 (0.90 to 1.27) | 1.02 (0.86 to 1.21) | |
| Weight gain 9–<13.5 kg | 2088 | 85 | 19 937 | 1.00 (0.80 to 1.25) | 0.95 (0.76 to 1.18) | |
| Weight gain ≥13.5 kg | 1316 | 58 | 12 298 | 1.09 (0.83 to 1.42) | 1.01 (0.78 to 1.33) | |
| Weight gain >2–4.5 kg | Kept the gained weight on or gained more weight | 19 821 | 849 | 197 050 | 1.06 (0.97 to 1.16) | 1.04 (0.95 to 1.14) |
| Weight gain >4.5–<9 kg | 17 255 | 832 | 175 806 | 1.15 (1.05 to 1.26) | 1.12 (1.02 to 1.22) | |
| Weight gain 9–<13.5 kg | 4198 | 214 | 42 939 | 1.19 (1.03 to 1.38) | 1.14 (0.99 to 1.33) | |
| Weight gain ≥13.5 kg | 1638 | 72 | 16 489 | 1.03 (0.81 to 1.31) | 0.97 (0.76 to 1.23) |
Weight change over both intervals modeled as a single categorical variable reflecting the weight change pattern over approximately 10 years.
Weight change intervals were each approximately 5 years [median (interquartile range [IQR]) across studies = 5.2 (4.4–5.9) years for interval 1 and 4.0 (3.9–4.9) years for interval 2].
Cox models were stratified by cohort, age, and calendar year at the start of breast cancer follow-up. CI = confidence interval; HR = hazard ratio; N/A = not applicable.
Stratified multivariable Cox models were adjusted for body mass index at the start of interval 1, physical activity at the start of interval 1, and postmenopausal hormone therapy use at start of breast cancer follow-up.
Hazard ratios were not reported for categories with fewer than 15 cases.
Statistical Analysis
Data from all studies were aggregated into a single dataset. Follow-up time began after the last weight assessment and ended at the date of incident invasive breast cancer diagnosis unless the women were first censored for death, loss to follow-up, or administrative end of follow-up. Hazard ratios (HR) and 95% confidence intervals (CI) (25) were estimated using Cox proportional hazards regression (26). Tight control for cohort-of-origin, age, and calendar year at the start of breast cancer follow-up was done by including these variables in the STRATA statement of the model. We further controlled for baseline BMI (normal = 18.5–<25 kg/m2; overweight = 25–<30 kg/m2; obese = ≥30 kg/m2), baseline physical activity (PA; low or no, medium, high as defined by each study), and postmenopausal hormone replacement therapy (HT) use (current at the start of breast cancer follow-up, not current) because we a priori expected them to be associated with both our exposure and outcome and we wanted to assess associations of weight change and breast cancer beyond the impact of BMI, PA, and HT. Furthermore, we found that several of the weight-change hazard ratios changed by more than 10% when controlling for these variables (Table 2). We also evaluated the following additional factors as potential covariates: height, age at first birth, parity, oral contraceptive use, history of benign breast disease, education, race, smoking status, and alcohol intake. We chose, however, the more parsimonious model because there was very little change to the hazard ratios when controlling for these additional variables (Supplementary Table 2, available online). The proportional hazards assumption was assessed using a likelihood ratio test, and no violations were detected.
A variety of subgroup and sensitivity analyses were conducted: stratifying weight change associations by HT, BMI, and PA; examining ER positive and negative tumors separately; recalculating weight-change hazard ratios after dropping one study at a time; limiting studies to the United States only; and examining percent weight change. In sensitivity analyses, we analyzed each study separately and then pooled the study-specific risk estimates using a random effects model. In these analyses, heterogeneity between cohorts was examined using the Q statistic (27) and I2 index (28). All P values were based on two-sided tests and considered statistically significant if the P value was less than .05. All 95% confidence intervals were considered statistically significant if the null value of 1.00 was included. Analyses were conducted using SAS version 9.4 (Cary, NC).
Results
Descriptive Statistics
The final analytic cohort included 180 885 women. Women aged 50 years and older who were part of the DCPP, but not the analytic cohort, were more likely to be current smokers (14.9% vs 9.9%, respectively), in the low physical activity group (48.2% vs 42.9%), and not have a college education (46.1% vs 63.6%). Otherwise the study population was similar to the overall DCPP population (Supplementary Table 3, available online). Among the women in the analytic cohort, 6930 breast cancers were identified during follow-up (Table 1). Median follow-up after the 10-year weight-change period was 8.3 [interquartile range (IQR) = 6.9–12.8] years. At the start of interval 1, the median age and BMI of participants was 59 (IQR = 55–64) years and 25.1 (22.7–28.3) kg/m2, respectively. At the end of interval 2, median BMI was 25.6 (IQR = 22.9–29.1) kg/m2. Of women in the analytic cohort, 20.3% maintained stable weight (±2 kg) over the two study intervals (n = 36 744). Another 21.8% of the cohort lost weight in interval 1 (n = 39 371), but only half of these women sustained it over the second interval (n = 19 694). More than one-third of the cohort gained weight in interval 1 (n = 67 394), and most sustained the weight gain through interval 2 (n = 42 912).
Women with sustained weight loss had a lower risk of breast cancer than women whose weight remained stable (Table 2). The larger the amount of sustained weight loss, the lower the risk of breast cancer (>2–4.5 kg: HR = 0.87, 95% CI = 0.77 to 0.99; >4.5–<9 kg: HR = 0.84, 95% CI = 0.73 to 0.96; ≥9 kg: HR = 0.74, 95% CI = 0.58 to 0.94). Women who lost at least 9 kg in interval 1 and gained back some (but not all) of the weight also had a lower risk of breast cancer compared with stable weight (HR = 0.77, 95% CI = 0.62 to 0.97). Results for women who gained up to 13.4 kg in the first interval but subsequently lost all the gained weight suggested a slightly lower risk of breast cancer also (HR = ∼0.9), but the confidence interval included the null value. Hazard ratios for women with sustained weight gain relative to stable weight were generally greater than 1, but these estimates were largely not statistically significant. All other weight-change patterns had a similar breast cancer risk to stable weight.
Subgroup and Sensitivity Analyses
The breast cancer risk reduction for sustained weight loss was linear (Figure 2) and specific to women not using HT at the start of breast cancer follow-up (>2–4.5 kg lost: HR = 0.82, 95% CI = 0.70 to 0.96; >4.5–<9 kg lost: HR = 0.75, 95% CI = 0.63 to 0.90; ≥9 kg lost: HR = 0.68, 95% CI = 0.50 to 0.93). No associations were observed among HT users. Sustained weight gain was not associated with breast cancer risk for either group (Supplementary Table 4, available online).
![Sustained weight change over approximately 10 years compared with stable weight and risk of breast cancer among women aged 50 years and older not taking postmenopausal hormone therapy in the Pooling Project of Prospective Studies of Diet and Cancer. Weight change was calculated as the difference between reported weight at year 1 and year 2 (interval 1) and year 2 and year 3 (interval 2). The referent group was women with stable weight across both intervals. Sustained weight loss was weight loss in the first interval [median length = 5.2 (interquartile range [IQR] 4.4–5.9) years] that was not regained in the second interval [median length = 4.0 (3.9–4.9) years]. Likewise, sustained weight gain was weight gain in the first interval that was not subsequently lost. Hazard ratios for different amounts of sustained weight loss and gain are indicated by squares, and 95% confidence intervals are indicated by vertical lines.](https://oup.silverchair-cdn.com/oup/backfile/Content_public/Journal/jnci/112/9/10.1093_jnci_djz226/2/m_djz226f2.jpeg?Expires=1716402216&Signature=QRFf02Wr~uWDu2lKwWQPiLjwV3YXpp38LA6I9-ET4nxjVSlcexjPRZXiGw8g1dmAoaiha3K7DhPicxzo26a0n~wG1hgk9QIZ29YmPon3Z~fRVZgNQIm039ezbvQDsAWcOLsiHTqugcedeQ9xhxgVZkrFqMxKznoCmnjn-KWN9Um7QgWGFXXiGb2Z~iqRe5w7LN8B39yzBIKIpqfZsXTlSEQPHDCY9ZcIIXH7WKJL8fsHdqaDKAclq96dAIjTf-JwQONqFIfiaEPezPCwviAMoT-bNMroLL6GNDbnsitzz5ipaXvNRs2NMkoueLb2vCMkuxBt3GbBClHk9lVSbKyCeg__&Key-Pair-Id=APKAIE5G5CRDK6RD3PGA)
Sustained weight change over approximately 10 years compared with stable weight and risk of breast cancer among women aged 50 years and older not taking postmenopausal hormone therapy in the Pooling Project of Prospective Studies of Diet and Cancer. Weight change was calculated as the difference between reported weight at year 1 and year 2 (interval 1) and year 2 and year 3 (interval 2). The referent group was women with stable weight across both intervals. Sustained weight loss was weight loss in the first interval [median length = 5.2 (interquartile range [IQR] 4.4–5.9) years] that was not regained in the second interval [median length = 4.0 (3.9–4.9) years]. Likewise, sustained weight gain was weight gain in the first interval that was not subsequently lost. Hazard ratios for different amounts of sustained weight loss and gain are indicated by squares, and 95% confidence intervals are indicated by vertical lines.
The associations we observed for sustained weight loss were also observed for ER+ tumors; similar but not statistically significant associations were found for ER- tumors, possibly because of limited sample size (Supplementary Table 5, available online). Overall, our results showed stronger associations for weight loss among overweight and obese women compared with women with BMI less than 25 kg/m2 (Supplementary Table 6, available online). For sustained weight loss of at least 9 kg, women with a baseline BMI greater than 25 kg/m2 had a 25% (95% CI = 3% to 42%) lower breast cancer risk compared with women with stable weight. As would be expected, very few women with BMI less than 25 kg/m2 (n = 5 cases) had a sustained weight loss of at least 9 kg, and we did not report hazard ratios for this group because of statistical instability. Among women who lost more than 4.5 kg to less than 9 kg, only overweight women were at a statistically significant lower breast cancer risk compared with stable weight (HR = 0.78, 95% CI = 0.61 to 0.98), but an inverse association was also suggested among obese women (HR = 0.88, 95% CI = 0.67 to 1.16) and less so among normal weight women (HR = 0.93, 95% CI = 0.72 to 1.22). No discernable pattern was observed when results were stratified by baseline physical activity (Supplementary Table 7, available online).
In sensitivity analyses, we found no evidence that any individual study was heavily influencing the results. No statistical evidence of heterogeneity across cohorts was observed (Pheterogeneity > 0.2 for all categories), but sample sizes were extremely small for individual cohorts, and weight change categories had to be collapsed (Supplementary Table 1, available online). Our findings were also extremely consistent when we dropped each study one at a time, and when we restricted to US studies only (results not shown). Sensitivity analyses using percent, instead of absolute, weight change also showed a similar pattern of results (not shown).
Discussion
In this large prospective study of women aged 50 years and older, sustained weight loss of at least 2 kg was associated with a lower risk of breast cancer compared with stable weight. The lowest risk, 32% lower than stable weight, was for women who sustained at least 9 kg of weight loss and were not taking HT. Women who regained some of the weight after losing 9 kg were still at a lower risk of breast cancer than women with stable weight. These results were particularly striking for overweight and obese women. Most other patterns of weight change conferred the same breast cancer risk as maintaining stable weight, including women who gained weight in the first 5 years but subsequently lost weight.
Most previous studies of weight change have focused on weight change from early adulthood (eg, age ∼18 years) to middle or later adulthood (age 40 years and older). Adult weight gain from young adulthood was consistently associated with postmenopausal breast cancer risk in these studies (3). In the present study, we were interested in the impact of weight loss after age 50 years. We did not observe a strong association with weight gain for this age group, consistent with the findings from the Women’s Health Initiative (WHI) Observational Study (not included in this pooled study population). In both studies the weight gain interval was no more than 5 years; therefore, participants did not gain as much weight as they might have over a longer time period. Previously observed associations with weight gain were only noteworthy at no less than 22.7 kg of gain.
Fewer studies have examined weight loss and risk of breast cancer. Studies of weight loss from early to middle or later adulthood have mostly been null. Weight loss during this time period is relatively rare, and the null results may reflect a lack of power. Furthermore, most studies did not examine whether the weight loss was sustained. To our knowledge, four studies (11–14) prospectively examined associations of weight change in middle or later adulthood and breast cancer risk, and only two examined sustained weight loss (11,12). The Nurses’ Health Study (11) reported that sustained weight loss of no less than 10 kg after menopause was associated with a 57% lower breast cancer risk (95% CI = 14% to 79%), although this result was based on only nine exposed cases. The Cancer Prevention Study-II suggested a similar, but not statistically significant, inverse association (12). The WHI Observational Study (not included in the pooled study because it did not have three weight measures) observed an association with weight loss (≥5% loss vs stable weight: HR = 0.88, 95% CI = 0.78 to 0.98), but the (included) WHI Clinical Trial study (14) did not. However, neither WHI study examined sustained weight loss. In our study-specific results, sustained weight loss was associated with a suggestive inverse association with breast cancer risk in the WHI clinical trial population (Supplementary Table 1, available online). Our results underscore the importance of accounting for the subsequent weight gain that often immediately follows weight loss, because only weight loss that was sustained was inversely associated with breast cancer.
Mechanistic studies have consistently shown that blood levels of postmenopausal endogenous estrogens are strongly associated with higher BMI and breast cancer risk (29), and there is evidence to suggest that circulating sex hormone concentrations can be reduced by weight loss. In both weight loss intervention arms of the SHAPE-2 trial, estradiol, free estradiol, and testosterone concentrations were statistically significantly reduced (and sex hormone binding globulin was increased) compared with the control group, which experienced no weight loss (30). Other studies have also shown that weight loss reduces sex steroid hormone concentrations (31,32), as well as C-reactive protein, interleukin 6, tumor necrosis factor alpha, insulin-like growth factor 1, and insulin-like growth factor binding protein (33).
Our finding of a stronger association for non-HT users was not unexpected. This difference by HT use is likely due to the increase in circulating sex hormones caused by exogenous hormone use (34), which may overwhelm more moderate changes in hormones because of adipose tissue alone (35). In women not taking HT, the endogenous hormone shift caused by weight loss may be more influential. The importance of this interaction, however, has lessened in recent years because of the drastic decline in the use of postmenopausal hormones, estimated to be down to less than 5% of US women in 2010 (36). We were also not surprised to find that the greatest benefit of weight loss was among women with BMI greater than 25 kg/m2, because very few women with BMI less than 25 kg/m2 lost substantial amounts of weight.
Limitations of the present study include the varying number of years in each weight-change interval from each of the contributing cohort and the inability to use more than three weight assessments. Although we evaluated the influence of most known breast cancer risk factors, we acknowledge that unknown confounders or survival factors (associated with both weight change and breast cancer risk) may have influenced our results through uncontrolled confounding or selection bias. We also cannot be sure that the weight loss in our study was intentional; however, we do not think reverse causality had a major impact on our results, because weight loss does not typically accompany a breast cancer diagnosis (unlike for other cancers) (37). It is also possible that associations of weight loss and breast cancer may be different today than they were when the women in this study lost weight (mid- to late 1980s and 1990s), given that the prevalence of overweight and obesity has increased for all age groups worldwide (1,38), and women today are more likely to have carried excess adiposity from an earlier age than the women in our study population. We also note that self-reported, rather than measured, weight and height were used in eight of 10 cohorts, and body composition information at the same time points was not available. Although the correlation between self-reported and measured weight has previously been shown to be high (r = 0.97), individual participant reports may be less accurate (39,40). To address this concern, we stratified our results by method of weight and height ascertainment (Supplementary Table 8, available online) and did not detect differences; likewise, in a study of more than 10 million participants from 239 prospective studies, the Global BMI Mortality Collaboration did not detect differences in results by method of weight and height ascertainment (41). In addition, we have no reason to believe that potential misclassification by self-reported weight would be differential by case status, although it is more likely to occur among the obese group (39). We also note that we did not have objectively measured physical activity data in this study, but validation studies have shown that self-reported physical activity can accurately rank adult physical activity levels (42–44). Finally, the study population was predominately white and college educated and largely included US-based cohorts. Future research is needed to confirm these findings in other populations such as women from different countries, nonwhite populations, contemporary cohorts, and women who have a more disadvantaged socioeconomic status. Despite this set of limitations, this study addressed major limitations of previous studies, specifically to prospectively examine sustained weight loss during middle-to-later adulthood with adequate sample size in a general population study.
In conclusion, we found that losing weight—and keeping it off—was associated with lower breast cancer risk for women aged 50 years and older. This message is particularly important for the two-thirds of the US population who are overweight or obese and therefore at higher risk of breast cancer. Perhaps equally as important, these results suggest that gaining weight, and then losing it, confers the same breast cancer risk as keeping a stable body weight. In other words, it is not too late to lower your risk of breast cancer if you have gained weight after 50 years of age. Prevention of the most common cancer worldwide may be a particularly motivating factor for the near epidemic numbers of overweight women.
Funding
This work was supported by grants from the Breast Cancer Research Foundation and National Cancer Institute (NCI) CA55075. The American Cancer Society funds the creation, maintenance, and updating of the Cancer Prevention Study-II (CPS-II) Nutrition cohort. The Iowa Women’s Health Study was supported by NCI R01 CA39742. The Japan Public Health Center-based Study Cohort I and II were supported by the National Cancer Center Research and Development Fund (since 2011) and a Grant-in-Aid for Cancer Research from the Ministry of Health, Labour and Welfare of Japan (from 1989 to 2010). The Melbourne Collaborative Cohort Study (MCCS) cohort recruitment was funded by VicHealth and Cancer Council Victoria. The MCCS was further supported by Australian National Health and Medical Research Council grants 209057 and 396414 and by infrastructure provided by Cancer Council Victoria. The Nurses’ Health Study (NHS) is supported by NCI UM1 CA186107 and P01 CA87969. The New York University Women’s Health Study is supported by National Institutes of Health UM1 CA182934 and center grants P30 CA016087 and P30 ES000260.
The WHI program is funded by the National Heart, Lung, and Blood Institute, National Institutes of Health, US Department of Health and Human Services through contracts HHSN268201600018C, HHSN268201600001C, HHSN268201600002C, HHSN268201600003C, and HHSN268201600004C. CT was funded by University of Arizona CCSG P30 CA23074. The Women’s Health Study is supported by grants CA047988, CA182913, HL043851, HL080467, and HL099355.
Notes
Affiliations of authors: Epidemiology Research Program, American Cancer Society, Atlanta, GA (LRT, AVP, SMG, MMG); Department of Epidemiology (MW, AHE, I-ML, HDS, MJS, RMT, WCW, SAS-W) and Department of Biostatistics (MW) and Department of Nutrition (S-SY, RB, MJS, WCW, SAS-W), Harvard T. H. Chan School of Public Health, Boston, MA; Channing Division of Network Medicine, Department of Medicine, Harvard Medical School, Boston, MA (MW, AHE, MJS, RMT, WCW); Division of Epidemiology and Community Health, University of Minnesota, Minneapolis, MN (KA); Division of Research, Kaiser Permanente of Northern California, Oakland, CA (BJC); Department of Population Health and Environmental Medicine (YC) and New York University Cancer Institute (AZ-J), New York University School of Medicine, New York, NY; Department of Epidemiology, Johns Hopkins Bloomberg School of Public Health, Baltimore, MD (AEC, KV); Department of Epidemiology, Columbia University Medical School of Public Health, New York, NY (JMG); Herbert Irving Comprehensive Cancer Center, Columbia University Medical Center, New York, NY (JMG); Cancer Epidemiology and Intelligence Division, Cancer Council Victoria, Melbourne, VIC, Australia (GGG, RLM); Centre for Epidemiology and Biostatistics, Melbourne School of Population and Global Health, The University of Melbourne, Melbourne, VIC, Australia (GGG, RLM); Division of Preventive Medicine, Brigham and Women’s Hospital, Harvard Medical School, Boston, MA (I-ML, HDS); Department of Exercise and Nutrition Sciences, Milken Institute School of Public Health, George Washington University, Washington, DC (KR); Epidemiology and Prevention Group, Center for Public Health Sciences, National Cancer Center, Tokyo, Japan (NS, ST); Department of Health Promotion Sciences, University of Arizona, Mel & Enid Zuckerman College of Public Health, Tucson, AZ (CAT).
The authors have no conflicts of interest to report. The authors assume full responsibility for all aspects of this study. The funders had no role in the design of the study; collection, analysis, interpretation of these data; writing of the manuscript; or decision to submit the manuscript for publication.
The Cancer Incidence data for the Campaign Against Cancer and Heart Disease (CLUE II) cohorts were provided by the Maryland Cancer Registry, Center for Cancer Surveillance and Control, Department of Health and Mental Hygiene. The CLUE II authors would like to thank the state of Maryland, the Maryland Cigarette Restitution Fund, and the National Program of Cancer Registries of the Centers for Disease Control and Prevention for the funds that helped support the collection and availability of the cancer registry data. The CLUE II authors would also like to thank the CLUE II participants and staff at the George W. Comstock Center for Public Health Research and Prevention.
The CPS-II authors would like to acknowledge the contribution from central cancer registries supported through the Centers for Disease Control and Prevention’s National Program of Cancer Registries and cancer registries supported by the NCI’s Surveillance Epidemiology and End Results Program. The authors also express appreciation to all CPS-II participants and to the CPS-II study and biospecimen management group.
The MCCS cases and their vital status were ascertained through the Victorian Cancer Registry and the Australian Institute of Health and Welfare, including the National Death Index and the Australian Cancer Database.
The NHS investigators would like to thank the participants and staff of the NHS for their valuable contributions as well as the following state cancer registries for their help: AL, AZ, AR, CA, CO, CT, DE, FL, GA, ID, IL, IN, IA, KY, LA, ME, MD, MA, MI, NE, NH, NJ, NY, NC, ND, OH, OK, OR, PA, RI, SC, TN, TX, VA, WA, WY.
References
World Health Organization. Obesity and Overweight Fact Sheet. http://www.who.int/mediacentre/factsheets/fs311/en/. Published February 2018. Accessed April 21, 2018.
World Cancer Research Fund/American Institute for Cancer Research. Food, Nutrition, Physical Activity, and the Prevention of Breast Cancer. Continuous Update Project Report;
Cox DR.

