


Abstract
Short and long sleep durations are linked to reduced kidney function, but little research has examined how sleep is associated with hydration status. Our aim was to assess the relationship between sleep duration and urinary hydration biomarkers among adults in a cross-cultural context.
Three samples of adults aged ≥20 years were analyzed: 2007–2008 National Health and Nutrition Examination Survey (NHANES; n = 4680), 2009–2012 NHANES (n = 9559), and 2012 cross-sectional wave of the Chinese Kailuan Study (n = 11903), excluding pregnant women and adults with failing kidneys. We estimated multiple linear regression models between self-reported usual night-time sleep duration (<6, 6, 7, 8 (reference), and ≥9 hr/day) and urine specific gravity (Usg) and urine osmolality (Uosm) as continuous variables and logistic regression models dichotomized as inadequate hydration (>1.020 g/mL; >831 mOsm/kg). In primary analyses, we estimated models excluding diabetes and diuretic medications for healthier subpopulations (NHANES, n = 11353; Kailuan, n = 8766).
In the healthier NHANES subset, 6 hr was associated with significantly higher Usg and odds of inadequate hydration (adjusted OR: 1.59, 95% CI: 1.25, 2.03) compared with 8 hr. Regression results were mixed using Uosm, but in the same direction as Usg. Among Chinese adults, short sleep duration (<6 and 6 hr) was associated with Usg and higher likelihood of inadequate hydration (6 hr adjusted OR: 1.42, 95% CI: 1.26, 1.60). No consistent association was found with sleeping ≥9 hr.
Short sleep duration was associated with higher odds of inadequate hydration in US and Chinese adults relative to sleeping 8 hr.
Although sleep duration has been associated with kidney function, few studies have examined how sleep is associated with hydration status. Disrupting the late sleep period may increase risk of dehydration and subsequently lead to acute kidney injury. This study, using cross-sectional data on adults from a US nationally representative survey and a large Chinese cohort, finds that short sleep duration (6 hr), compared with 8 hr of sleep, was associated with higher odds of inadequate hydration using urinary biomarkers. Longitudinal and experimental research is needed to further examine physiological feedback loops, including the role of vasopressin release during sleep, and recovery processes linking sleep duration and hydration status. Short sleep was associated with inadequate hydration in a cross-cultural context.
Introduction
Sleep duration has been associated with myriad health outcomes, including cardiovascular disease, obesity, diabetes, and chronic kidney disease (CKD) [1–5]. However, a key aspect of population health, which has received less attention, is how sleep relates to actual hydration status for adults in the general population.
Proper hydration is critical to physiological functioning and health [6, 7]. The short-term health consequences of body water deficit, or inadequate hydration, are headaches, fatigue, irritability, dry mouth, visual acuity, and in severe cases, loss of motor function and death [8–10]. Therefore, identifying biological and behavioral aspects of daily life which are modifiable and related to hydration status may help improve general well-being and reduce risk of chronic conditions associated with dehydration, like urolithiasis (kidney stones) and urinary tract infections [6].
Hydration status is part of a tightly linked and regulated hormonal system of renin–angiotensin–aldosterone, which regulates urine concentration and body water conservation [6, 11]. Vasopressin is released in response to hydration status, but is also part of a circadian rhythm [12]. Vasopressin increases in the late sleep period to help avoid dehydration [13, 14]. Therefore, missing this sleep period through short sleep may affect vasopressin release and disrupt body water homeostasis [14]. Long sleep may be associated with worse hydration through changes to vasopressin release as well as higher water losses from respiration and longer periods of water intake restriction [13]. Previous research has indicated that among those who sleep for short (<7 hr) and long periods of time (>9 hr) there is disruption in many homeostatic systems that are intertwined with hydration, including insulin sensitivity [15], hunger/satiety endocrine–signaling systems [4], cardiovascular function [1], and kidney function [16]. It is therefore possible that short and long sleep may consequently negatively affect hydration status as well.
A significant gap exists in the literature identifying how sleep and hydration status are related. One recent study evaluated the effect of controlled dehydration compared with euhydration on sleep quality and sleep quantity in young, healthy adults [17]. This study did not find that mild dehydration through body water loss affected either sleep duration or quality. However, this study examined only the direction of mild dehydration effects on sleep and is limited by small sample size. At a population level, it is unclear how sleep may be directly associated with hydration status outside of some common upstream factors, particularly across the lifespan. Moreover, information related to sleep is increasingly important in a cross-cultural context as many social/cultural, environmental, and political factors surrounding access to clean water may increase stress [18–20] and modify both hydration status and sleep. These factors could serve as confounders to understanding the relationship in any one study site.
Therefore, the objective of this paper is to examine how reported usual night-time sleep duration is associated with urinary measures of hydration status in a nationally representative sample of US adults and a large cohort of Chinese adults. We hypothesize that short and long duration of sleep will be associated with more concentrated urine and higher probability of inadequate hydration across populations. We test this using two biomarkers of hydration status, urine specific gravity (Usg) and urine osmolality (Uosm), on different cross-sectional, nationally representative samples from the National Health and Nutrition Examination Survey (NHANES) and one biomarker, Usg, from the Chinese Kailuan Study.
Methods
NHANES study design
The NHANES uses a complex, stratified multistage probability design to create a nationally representative sample of the noninstitutionalized, civilian US population. This survey uses both in-person interviews alongside physical examinations, which take place in Mobile Examination Centers (MECs). The sampling procedures and methodology of NHANES are described in detail elsewhere [21, 22]. Since 1999, NHANES has been continuously conducted with data released in 2 year cycles by the National Center for Health Statistics (NCHS). Data for these analyses come from the 2007–2008, 2009–2010, and 2011–2012 cycles. The examination response rate varied between 64.4% and 72.2% during these cycles for adults. The NCHS Research Ethics Review Board approved the continuous NHANES and all adult participants gave written informed consent.
Kailuan study design
The Kailuan Study is an ongoing multicenter cohort that includes 101 510 Chinese adults in Tangshan city, China, which was designed to study risk factors for noncommunicable disease in a Chinese population [23]. Baseline information (e.g. lifestyle factors and medical history) was collected in 2006–2007 and updated every 2 years. In 2012, information was collected on sleep habits in 12 990 adults (10 725 men and 2 265 women) aged 25–95 years who were evaluated at the Kailuan general hospital, one of the 11 centers, and free of neurodegenerative diseases, as detailed elsewhere [2, 24, 25]. This site was chosen for this analysis because it was the only one where sleep information was collected. However, the participants from the Kailuan center subgroup study had younger age (baseline age 54 vs 58, p < 0.01) and higher proportion of men (82.6% vs 79.5%) relative to other sites. We excluded 1085 participants (8.4%) with missing information on sleep duration or Usg, leaving 11 905 in the current analyses. Excluded participants had similar age (55 vs 54 years) and body mass index (BMI, 25.4 vs 24.7), but a lower proportion of men (79% vs 83%), slightly shorter sleep duration (6.8 vs 7.1 hr/day), and a slightly lower prevalence of diabetes (11.2% vs 11.9%). The Kailuan Study was approved by the ethics committees of the Kailuan Medical Group, Kailuan Group, and the Brigham and Women’s Hospital, Boston. All participants provided written informed consent.
Main dependent variable: hydration status
Urine specific gravity
National Health and Nutrition Examination Survey.
In 2007–2008, adults provided urine samples in the MEC. These samples were measured for urine specific gravity, or the density of urine relative to water, using a digital hand-held refractometer (ATAGO PAL-10S), with automatic temperature compensation. Usg is commonly used for laboratory and field measurements of hydration status and urine concentration [26]. Usg values vary between 1.000 and 1.040 g/mL with values >1.020 g/mL representing inadequate hydration [27].
The Kailuan Study.
A single random midstream morning urine sample was collected from each participant during the interview in 2012. Usg was assessed using instrument colorimetric method (a reagent strip method, also called the dry chemistry test method [28]) within 2 hr of urine sample collection (H12-MA test strips, Changchun Dirui Medical Technology Co., Ltd. Changchun, China). All urine samples were measured using a urine analyzer (N-600, Dirui, Changchun, China) at the central laboratory of the Kailuan general hospital. The results of Usg were rounded to 0.005 g/mL for a minimum of 1.000 g/mL and a maximum of 1.030 g/mL.
Urine osmolality
In 2009–2012, adults in NHANES provided spot urine samples in the MEC. Urine osmolality (Uosm), which is the total concentration of dissolved particles per kg of water in urine, was determined by freezing point depression osmometry in the MEC lab, calculated as milliosmoles per kilogram (mOsm/kg). Uosm is highly correlated with Usg and is a reliable urinary biomarker of daily hydration status [29]. Uosm values vary between 50 and 1200 mOsm/kg with values >831 mOsm/kg representing inadequate hydration [29].
Main independent variable: sleep duration
National Health and Nutrition Examination Survey
Participants were asked about their sleeping habits in their home, using the Computer-Assisted Personal Interviewing (CAPI) system, as part of the survey participant household interview. To estimate the usual amount of sleep participants obtained on a nightly basis, they were asked “How much sleep do you usually get at night on weekdays or workdays?” This question did not take into account daytime naps and responses were in integer hour increments.
The Kailuan Study
Participants were asked to report usual total hours of actual sleep during the night to the half hour and also did not take into account daytime naps.
Based on previous research that has indicated a U-shaped pattern between hours of sleep and health outcomes where both short sleep and long sleep were seen as potential risk factors [1], we categorized sleep based on the latest recommendations at less than 6 hr of sleep, 6, 7, 8, and 9 hr or more hours of sleep [30]. We treated 8 hr of sleep as the reference category since this is often viewed as an ideal sleep duration by sleep experts [31].
Covariates
We adjusted for several known confounders in this analysis depending on data availability by site. In NHANES, sex (male and female), race/Hispanic origin (non-Hispanic white, non-Hispanic black, Hispanic, and other [including all non-Hispanic individuals reporting more than one race]), BMI (kg/m2), alcohol intake (g), caffeine intake (mg), total water intake (ml), physical activity (minutes), time of the exam (morning, afternoon, or evening), and diabetes status were included as covariates in the NHANES analysis to control for potential confounding [32–37].
Alcohol, caffeine, and water intakes were derived from the in-person 24 hr dietary recall using the Automated Multiple Pass Method (AMPM) in the MEC. The AMPM recall method minimizes bias by improving respondent recall of foods and beverages consumed in the previous 24 hr period from midnight to midnight through standardized probes [38]. Caffeine intake was dichotomized at 400 mg (< or ≥400 mg) because consumption above that level is associated with higher risk of dehydration [32, 33].
The Global Physical Activity Questionnaire was used to construct the physical activity variable [39]. During the home interview, participants were asked, using the CAPI system, to list the total time they spent in the previous week in moderate and vigorous activities from biking or walking, work, and leisure activities. Physical activity was dichotomized based on whether the individual met national guidelines of 150 min or more per week of moderate or vigorous physical activity [40].
To test for diabetes, blood specimens were collected in the MEC for all participants and samples were analyzed for hemoglobin A1c (HbA1C) in the Fairview Medical Center Laboratory at the University of Minnesota. Adults with HbA1C values of 6.5% or higher [41] or who reported that a doctor ever told them they had diabetes were categorized as having diabetes.
Medication information (if they had taken prescription medications in the last 30 days) was obtained through self-report by showing the container to the interviewer. The prescriptions were coded by NCHS. The codes for any diuretic medication (e.g. loop, thiazide, and potassium-sparing) were identified and used to exclude participants in some of the analyses as they affect urine concentration.
In the Kailuan Study, information on potential confounders was collected via questionnaire (i.e. age, sex, physical activity [none = 1, seldom = 2, highly active = 3], and alcohol drinking status [1 = never; 2 = light, <2 servings; 3 = moderate, 2–5 servings; 4 = heavy, >=5 servings; 5 = current without servings data; 6 = past]) [2] and face-to-face examination (i.e. height, weight, and blood pressure) by trained field workers (nurses and doctors) [23]. Diabetes was diagnosed as fasting blood glucose ≥7 mmol/L (126 g/L) or had a history of physician-diagnosed diabetes [42]. Medication use data were collected on participants and all diuretic drugs were coded to exclude participants based on participant self-report.
Statistical analysis
Statistical significance was set at α = 0.05 for a two-tailed test. Analyses were conducted in Stata 15.0 (College Station, TX) using the survey commands with standard errors (SE) estimated by Taylor series linearization due to the complex, four-stage sample design of NHANES per their analytic guidelines [43]. Because we controlled for dietary intake variables, we used day one dietary sample weights to adjust for over-sampling, nonresponse, noncoverage, and day of the week. Descriptive statistics characterizing the NHANES samples were estimated with and without exclusions for adults with diabetes and those who reported taking a diuretic prescription medication in the past 30 days to estimate the relationship between sleep and hydration status for the full samples and a healthier subset (Table 1).
Sample characteristics of nonpregnant adults without kidney failure, with and without exclusions for diabetes and taking diuretic medications, from the US NHANES and the Chinese Kailuan Study
| NHANES*2007–2008 | NHANES†2007–2008 | NHANES*2009–2012 | NHANES†2009–2012 | Kailuan*2012 | Kailuan†2012 | |
|---|---|---|---|---|---|---|
| Mean or % (SE) | Mean or % (SE) | Mean or % (SE) | Mean or % (SE) | Mean or % (SD) | Mean or % (SD) | |
| n‡ | 4680 | 3689 | 9599 | 7664 | 11 903 | 8766 |
| Age (yr) | 46.4 (0.4) | 44.1 (0.5) | 47.1 (0.5) | 44.7 (0.5) | 54.3 (11.2) | 52.8 (11.1) |
| Sex (% male) | 51.9 (0.9) | 51.6 (0.9) | 49.9 (0.6) | 49.4 (0.6) | 83.0 (0.4) | 82.7 (0.4) |
| Race/Hispanic origin§ | ||||||
| NH white (%) | 69.7 (3.7) | 70.4 (3.5) | 68.2 (2.6) | 69.0 (2.6) | Han | Han |
| NH black (%) | 11.6 (2.1) | 10.6 (1.9) | 11.1 (1.2) | 10.3 (1.1) | ||
| Hispanic (%) | 13.3 (2.0) | 13.6 (2.1) | 13.8 (1.9) | 13.9 (1.9) | ||
| Height (cm) | 168.9 (0.3) | 169.2 (0.3) | 169.1 (0.2) | 169.4 (0.2) | 169.3 (6.6) | 169.3 (6.6) |
| BMI (kg/m2) | 28.6 (0.2) | 27.9 (0.2) | 28.7 (0.1) | 28.0 (0.1) | 25.1 (3.3) | 24.7 (3.2) |
| Weight (kg) | 81.8 (0.6) | 80.4 (0.6) | 82.3 (0.3) | 80.5 (0.3) | 71.9 (11.2) | 71.0 (11.0) |
| Urine specific gravity (g/mL) | 1.0165 (0.0002) | 1.0164 (0.0003) | – | – | 1.022 (0.006) | 1.022 (0.006) |
| Urine osmolality (mOsm/kg) | – | – | 613.6 (5.9) | 617.6 (6.5) | – | – |
| Inadequate hydration|| (%) | 31.9 (1.3) | 32.1 (1.4) | 24.9 (0.8) | 26.1 (0.8) | 52.7 (5.0) | 52.2 (5.0) |
| Sleep (hr) | 6.8 (0.05) | 6.8 (0.05) | 6.9 (0.02) | 6.9 (0.02) | 7.1 (1.3) | 7.1 (1.2) |
| Sleep category | ||||||
| <6 hr | 14.9 (1.3) | 14.5 (1.5) | 12.9 (0.5) | 12.5 (0.6) | 11.6 (3.2) | 10.5 (3.1) |
| 6 hr | 23.1 (0.8) | 22.9 (0.8) | 23.9 (0.5) | 23.9 (0.9) | 19.8 (4.0) | 20.4 (4.0) |
| 7 hr | 29.8 (1.1) | 30.7 (1.2) | 28.9 (0.8) | 29.9 (0.9) | 16.5 (3.7) | 16.8 (3.7) |
| 8 hr | 26.0 (1.0) | 26.0 (1.0) | 27.4 (0.8) | 27.1 (0.8) | 51.1 (5.0) | 51.2 (5.0) |
| ≥9 hr | 6.3 (0.5) | 5.9 (0.6) | 6.8 (0.4) | 6.5 (0.4) | 1.1 (1.0) | 1.1 (1.0) |
| Physical activity¶ (%, ≥150min/week) | 23.8 (1.5) | 25.3 (1.6) | 19.8 (0.7) | 21.6 (0.8) | 14.9 (35.6) | 14.1 (34.8) |
| Time of exam | ||||||
| Morning | 44.6 (1.6) | 45.0 (1.8) | 45.2 (1.0) | 44.0 (1.1) | 9 am | 9 am |
| Noon | 32.8 (1.6) | 31.9 (1.6) | 33.9 (0.8) | 33.8 (0.9) | – | – |
| Afternoon | 22.6 (1.6) | 23.2 (1.7) | 20.9 (0.7) | 22.2 (7.6) | – | – |
| Total water intake (mL/day) | 3028 (59) | 3051 (69) | 3130 (39) | 3153 (38) | – | – |
| Caffeine intake (% ≥ 400 mg/day) | 12.3 (1.1) | 12.7 (1.1) | 11.3 (0.8) | 11.3 (0.9) | – | – |
| Alcohol intake (g/day) | 10.4 (0.9) | 11.2 (1.0) | 12.0 (0.6) | 13.0 (0.6) | – | – |
| Diabetes (%) | 10.3 (0.6) | – | 10.5 (0.4) | – | 11.9 (32.4) | – |
*Not excluding adults with diabetes or diuretic use.
†Excluding adults with diabetes, diuretic use, and weak/failing kidneys.
‡Unweighted sample size.
§Race/Hispanic origin “other” category is included in total sample, but is not shown.
||Defined as >831 mOsm/kg for urine osmolality and >1.020 g/ml for Usg.
¶Defined using a single question related to physical activity in Kailuan Chinese cohort: % responding they are highly active.
Fractional polynomial plots were created between sleep hours as a continuous variable on Usg and Uosm, to allow for a curvilinear relationship to emerge. Multiple linear regression models were used to test the association between sleep duration category and Usg and Uosm controlling for confounders with and without additional exclusions for both NHANES and the Kailuan Study. We used logistic regression models to examine the odds of inadequate hydration with elevated Usg (>1.020 g/mL) and elevated Uosm (>831 mOsm/kg). We tested for interactions between sleep category and race/ethnicity, sex, weight status, age, and time of the exam and none were significant in linear regressions. Therefore, no interactions were included in the final models presented.
We conducted three sensitivity checks. We re-estimated the associations using different sleep categories, i.e. 7 and 8 hr combined as the reference category since some recommendations cite a need of a minimum 7 hr sleep [30]. Second, we re-estimated the analyses with a stricter inadequate hydration cut-off for Usg (>1.025 g/mL) [29]. Finally, we re-estimated models additionally adjusting for sleep disorders: (1) in the NHANES models, whether a doctor had ever told the participant they had a sleeping disorder (insomnia, sleep apnea, restless leg syndrome [RLS], or other). (2) In the Kailuan cohort, we additionally adjusted for data on insomnia and snoring, no data were collected on RLS.
Sample
In NHANES, pregnant women (2007–2008: n = 56; 2009–2012: n = 108) and adults who reported they had ever been told by a doctor they had weak or failing kidneys (2007–2008: n = 137; 2009–2012: n = 279) were excluded from all analyses leaving an analytical sample of n = 4680 and n = 9599, respectively, without missing sleep, hydration, or covariate data. In the primary analyses, we additionally excluded adults with diabetes and those currently taking diuretics (2007–2008: n = 991; 2009–2012: n = 1935). This resulted in final sample sizes of n = 3689 in 2007–2008 and n = 7664 in 2009–2012.
Among the Kailuan Study, 11 905 adults in 2012 had full sleep information and Usg data. Two adults were missing alcohol drinking status information, yielding 11 903 adults in the main analyses. In the Kailuan cohort, weak or failing kidneys were identified through proteinuria (>300 mg/dL) or eGFR<60 mL/min per 1.73 m2 (methods are described elsewhere [2]) and additional exclusions were made based on these criteria. No pregnant women were examined in the study. In the primary analyses, we sequentially excluded 2859 adults who reported diabetes or any type of diuretic medication, and an additional 278 due to weak or failing kidneys, yielding a final sample size of 8766.
Results
NHANES: urine-specific gravity
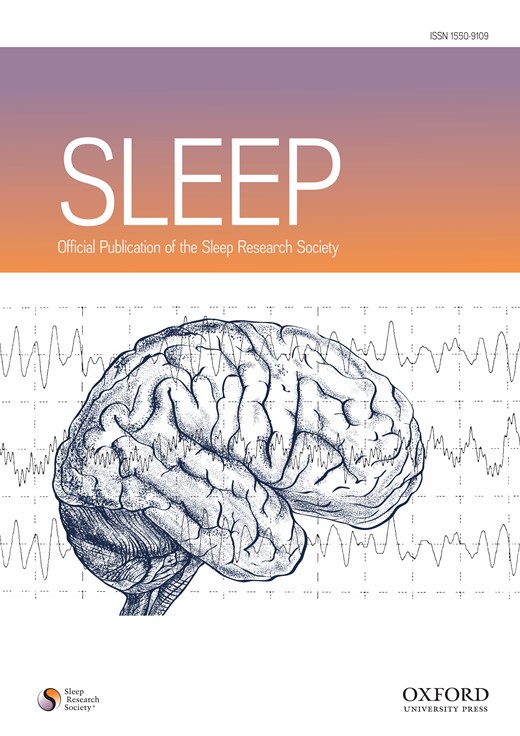
In the 2007–2008 sample, using a best-fitting fractional polynomial between the continuous measure of sleep duration (hr) and Usg, a mild U-shaped relationship was observed (Figure 1). This suggests that mean Usg at a population level is highest for adults who reported short amounts of sleep and that the mean decreases until 8 to 9 hr of sleep where it begins to increase again.
Fractional polynomial plot between sleep duration and urine specific gravity for nonpregnant US adults without kidney failure, diabetes, or taking diuretics aged ≥20 years (n = 3689), NHANES 2007–2008.
We next examined multiple linear regression models examining the association between sleep duration and Usg with and without additional exclusions adjusted for covariates (Table 2; Models 1 and 2). Both models indicated that compared with reporting 8 hr of sleep, adults who reported 6 hr of sleep on a usual basis had significantly more concentrated urine (Model 2: Adjusted beta [B] = 0.0011, standard error [SE] = 0.0004, p = 0.013).
Relationship between sleep duration on urine specific gravity and odds of inadequate hydration among US adults, NHANES 2007–2008
| (1) | (2) | (3) | (4) | |
|---|---|---|---|---|
| Beta (SE) | Beta (SE) | Odds Ratio (95% CI) | Odds Ratio (95% CI) | |
| Usg†,‡ (g/mL) | Usg‡,§ (g/mL) | Inadequate hydration†,‡,|| | Inadequate hydration‡,§,|| | |
| Sleep category | ||||
| <6 hr | 0.0003 | 0.0001 | 1.07 | 1.01 |
| (0.0004) | (0.0005) | (0.74–1.55) | (0.71–1.44) | |
| 6 hr | 0.0008** | 0.0011** | 1.47*** | 1.59*** |
| (0.0003) | (0.0004) | (1.22–1.77) | (1.25–2.01) | |
| 7 hr | 0.0003 | 0.0003 | 1.23* | 1.30** |
| (0.0003) | (0.0003) | (1.00–1.53) | (1.05–1.61) | |
| 8 hr | Reference | Reference | 1 | 1 |
| ≥9 hr | 0.0007 | 0.0009 | 1.18 | 1.21 |
| (0.0007) | (0.0007) | (0.77–1.82) | (0.77–1.91) | |
| Observations¶ | 4680 | 3689 | 4680 | 3689 |
| R-squared | 0.17 | 0.17 | ||
Standard errors or 95% confidence intervals in parentheses.
†Not excluding adults with diabetes or diuretic use.
‡Adjusted for age, race/Hispanic origin, sex, BMI, total water intake, alcohol intake, high caffeine intake (>400 mg), time of exam, physical activity level > 150 minutes of moderate/vigorous activity/week.
§Excluding adults with diabetes, diuretic use, and weak/failing kidneys.
||Inadequate hydration is Usg > 1.020 g/mL.
¶Unweighted sample size.
***p < 0.01; **p < 0.05; *p < 0.1.
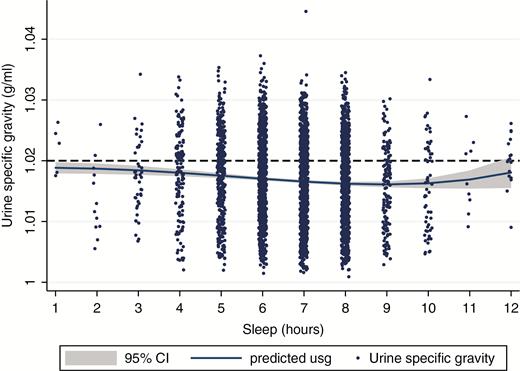
Fractional polynomial plot between sleep duration and urine osmolality for nonpregnant US adults without kidney failure, diabetes, or on diuretic medications, aged ≥20 years (n = 7664), NHANES 2009–2012.
Multiple logistic regression models evaluating the relationship between sleep duration and inadequate hydration using the standard cutoff (>1.020 g/mL) demonstrated a similar relationship to the linear models (Table 2; Models 3 and 4). Adults who reported 6 hr of sleep had 1.59 (95% CI: 1.25, 2.01; p = 0.001) times the odds of having elevated Usg than adults who reported 8 hr of sleep. Additionally, adults who reported 7 hr of sleep also had higher odds (OR: 1.30, 95% CI: 1.05, 1.61) than adults who reported 8 hr of sleep. Very short sleepers (<6 hr) and long sleepers (9+ hr) did not have significantly different odds of inadequate hydration, likely because of lower sample sizes in those bins (Figure 1).
NHANES: urine osmolality
A mild U-shaped relationship was again observed between sleep duration and Uosm (Figure 2). In multiple linear regression models, adults reporting 6 hr of sleep had significantly higher Uosm (β = 23.8 mOsm/kg, SE = 9.47; Table 3; Model 2) than adults who reported 8 hr of sleep adjusted for covariates. No other sleep duration was significantly different from the reference category of 8 hr.
Relationship between sleep duration on urine osmolality and urine osmolality and odds of inadequate hydration among US adults, NHANES 2009–2012
| (1) | (2) | (3) | (4) | |
|---|---|---|---|---|
| Beta (SE) | Beta (SE) | Odds Ratio (95% CI) | Odds Ratio (95% CI) | |
| Uosm†,‡ (Mosm/kg) | Uosm‡,§ (Mosm/kg) | Inadequate hydration†,‡,|| | Inadequate hydration‡,§,|| | |
| Sleep category | ||||
| <6 hr | 7.3 | 9.0 | 0.94 | 0.90 |
| (13.6) | (15.2) | (0.76–1.16) | (0.68–1.20) | |
| 6 hr | 18.7** | 22.8** | 1.17* | 1.16 |
| (9.1) | (9.6) | (0.98–1.41) | (0.97–1.40) | |
| 7 hr | −4.2 | −5.1 | 0.83* | 0.81* |
| (9.7) | (10.9) | (0.67–1.01) | (0.66–1.00) | |
| 8 hr | Reference | Reference | 1 | 1 |
| ≥9 hr | 0.47 | 3.0 | 0.76 | 0.75 |
| (15.6) | (18.3) | (0.49–1.16) | (0.50–1.15) | |
| Observations¶ | 9599 | 7664 | 9599 | 7664 |
| R-squared | 0.14 | 0.14 | ||
Standard errors or 95% confidence intervals in parentheses.
†Not excluding adults with diabetes or diuretic use.
‡Adjusted for age, race/Hispanic origin, sex, BMI, total water intake, alcohol intake, high caffeine intake (>400 mg), time of exam, physical activity level > 150 min of moderate/vigorous activity/week.
§Excluding adults with diabetes, diuretic use, and weak/failing kidneys.
||Inadequate hydration is Uosm > 831 mOsm/kg.
¶Unweighted sample size.
***p < 0.01; **p < 0.05; *p < 0.1.
The results trended in the same direction in logistic regression models, but did not reach significance. Here, adults who reported sleeping 6 hr had 1.16 (95% CI: 0.97, 1.40) times the odds of being inadequately hydrated compared with adults getting 8 hr of sleep. Interestingly, in the Uosm data, adults who reported 7 hr of sleep had lower odds (OR = 0.81; 95% CI: 0.66, 1.00) of being inadequately hydrated than those with 8 hr of sleep.
Kailuan Study: urine-specific gravity
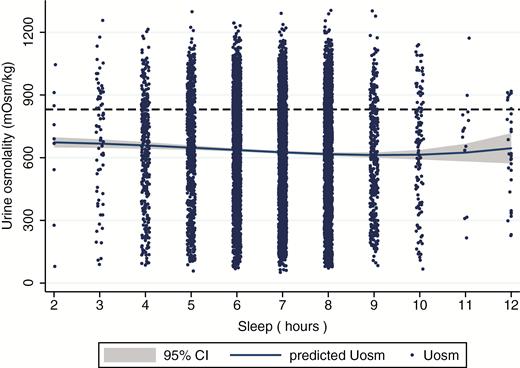
Unlike the US NHANES data, the Chinese Kailuan data exhibited a negative linear relationship between sleep duration and Usg (Figure 3). In multiple linear regression, adults who reported less than 6 and 6–6.5 hr of sleep had significantly more concentrated urine than adults who reported sleeping 8–8.5 hr of sleep for the full sample and when excluding adults on diuretic medications and with diabetes (Table 4; Models 1 and 2). Similarly, in multiple logistic regressions, adults who reported less than 6 (aOR: 1.45, 95% CI: 1.24, 1.68), 6–6.5 (aOR: 1.42, 95% CI: 1.26, 1.60), and 7–7.5 (aOR: 1.25, 95% CI: 1.11, 1.42) hr had significantly higher odds of inadequate hydration than adults who slept 8–8.5 hr (Table 4; Model 4). Results between long sleep (≥9 hr) and Usg were mixed in linear and logistic models (Table 4; Models 2 and 4). Long sleep was associated with significantly lower Usg in linear models (B = −0.0013, SE = 0.0006; p = 0.024), whereas no association was found in the logistic regression models.
Fractional polynomial plot between sleep duration and urine specific gravity for nonpregnant Chinese adults in the Kailuan Study without kidney failure, diabetes, or taking diuretics aged ≥20 years (n = 8766). Size of markers relates to number of observations.
Multiple linear regression and multiple logistic regression between sleep duration on urine specific gravity and odds of inadequate hydration among Chinese adults in the Kailuan Study, 2012
| (1) | (2) | (3) | (4) | |
|---|---|---|---|---|
| Beta (SE) | Beta (SE) | Odds Ratio (95% CI) | Odds Ratio (95% CI) | |
| Usg†,‡ (g/mL) | Usg‡,§ (g/mL) | Inadequate hydration†,‡,|| | Inadequate hydration‡,§,|| | |
| Sleep category | ||||
| <6 hr | 0.0006*** | 0.0006*** | 1.39*** | 1.45*** |
| (0.0002) | (0.0002) | (1.23–1.57) | (1.24–1.68) | |
| 6 hr | 0.0004*** | 0.0005*** | 1.36*** | 1.42*** |
| (0.0001) | (0.0002) | (1.23–1.50) | (1.26–1.60) | |
| 7 hr | 0.0001 | 0.0003 | 1.22*** | 1.25*** |
| (0.0001) | (0.0002) | (1.10–1.36) | (1.11–1.42) | |
| 8 hr | Reference | Reference | 1 | 1 |
| ≥9 hr | −0.0008* | −0.0013** | 0.81 | 0.76 |
| (0.0005) | (0.0006) | (0.56–1.15) | (0.50–1.16) | |
| Observations | 11 903 | 8766 | 11 903 | 8766 |
| R-squared | 0.03 | 0.04 | ||
Standard errors or 95% confidence intervals in parentheses.
†Not excluding adults with diabetes or diuretic use.
‡Adjusted for age, sex, BMI, physical activity level status, and alcohol drinking status.
§Excluding adults with diabetes, diuretic use, and weak/failing kidneys.
||Inadequate hydration is Usg > 1.020 g/mL.
***p < 0.01; **p < 0.05; *p < 0.1.
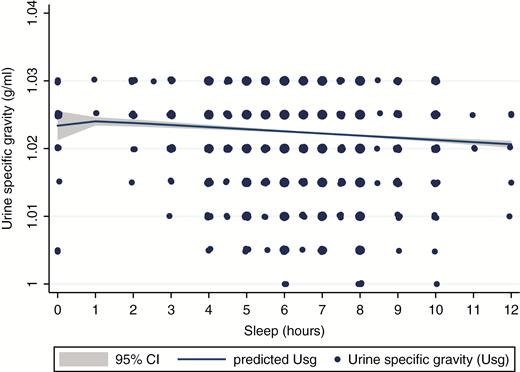
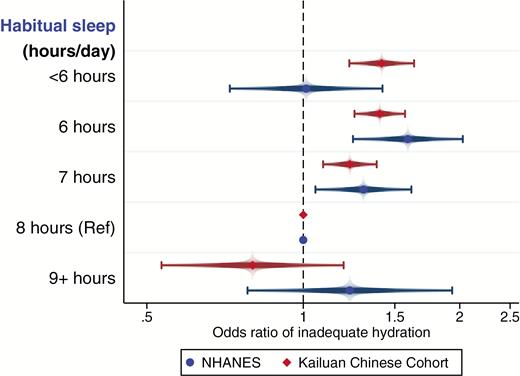
Comparison of Usg results from NHANES and the Kailuan Study
Because Usg was collected in both the NHANES and the Kailuan Study, we compared the results of the logistic regressions for inadequate hydration (Figure 4). Interestingly, the results are similar for both samples in comparing 6 and 7 hr, respectively, to 8 hr of sleep. However, the main difference is seen for the shortest and longest sleepers as the Kailuan Study data presented more of a dose–response-like stepwise reduction in odds of inadequate hydration with increasing sleep.
Sensitivity analyses
Results between sleep duration and Usg, Uosm, and inadequate hydration were consistent when we used different categories of sleep (7–8 hr inclusive as the reference category) for NHANES (Supplementary Tables S1 and S2) and the Kailuan Study (Supplementary Table S3). Results were consistently significant with adults who reported 5–6 hr (inclusive) of sleep having 17%–32% significantly higher odds of inadequate hydration across the three samples using both Usg and Uosm (Supplementary Tables S1–S3).
When a stricter cutoff for inadequate hydration was used for Usg (>1.025 g/mL), logistic regression results were consistent for the Kailuan Study and stronger for NHANES than in the primary analyses. In the healthier subset of NHANES, adults who reported sleeping 6 hr had 1.94 (95% CI: 1.40, 2.69) times the odds of being inadequately hydrated compared with adults getting 8 hr of sleep (full results not shown).
Finally, when re-estimating the NHANES and Kailuan regression models additionally adjusting for sleep disorders, results were strongly consistent with the adjusted results and did not materially change (results not shown).
Discussion
The results from this nationally representative US survey and large Chinese cohort provide evidence at the population level that short, but not long, sleep duration was associated with more concentrated urine and higher odds of inadequate hydration. We examined how sleep duration was associated with two urinary biomarkers of hydration status. In both populations, adults who reported sleeping 6 hr had significantly more concentrated urine and 16%–59% higher odds of being inadequately hydrated compared with adults who slept 8 hr on a regular basis at night. Long sleepers, those who slept 9 or more hours, did not exhibit worse hydration status than normal sleepers. Although the adjusted betas were small for the continuous measures of Usg and Uosm, the net result at a population level of having more adults with inadequate hydration can lead to negative health implications. For example, mild dehydration is associated with cognitive [44], mood [45], and physiological [46] impairments, and if dehydration is chronic, this can lead to increased risk of kidney stones and urinary tract infections [6].
Our analyses using both continuous and dichotomous Usg and Uosm variables from NHANES and the Kailuan Chinese cohort provided consistent results in comparing adults sleeping 6, 7, and 8 hr with the overall samples and with healthier subsamples, i.e. excluding adults with diabetes and those taking diuretic medications. The large majority of US and Chinese adults (~80%–88%) reported between 6 and 8 hr (inclusive) of sleep on a usual basis. Therefore, teasing apart the relationship beyond these sleep durations may require larger sample sizes in these subgroups of adults.
Previous cross-sectional and longitudinal research has found that short sleep duration is associated with higher risk of CKD, higher kidney filtration rates, and elevated albumin–creatinine clearance [16, 47, 48]. For example, the prevalence of sleep-related problems, including short sleep duration, was found to be higher among adults with CKD [48]. Additionally, each hour less of sleep was associated with higher glomerular filtration rate over 10 years of follow-up [16]. These findings suggest that kidney health is negatively affected by short sleep duration, and these effects may translate into dysregulation of body water through vasopressin release. Results of a significant association between sleep duration and inadequate hydration presented here add to, and support, growing evidence that short sleep duration has implications for kidney health.
A key physiological pathway connecting hydration status and sleep relates to the circadian rhythm release of antidiuretic hormone or vasopressin. Research in both humans and rats has found that vasopressin release increases in the late sleep period, which serves to help moderate hydration status during sleep given that this is a period where water intake in inhibited and respiratory water loss increases [12, 13]. If the late sleep period is disrupted, then this suggests that individuals may not experience the increased release of vasopressin for homeostasis of body water which may increase vulnerability to dehydration [14].
It is unclear from our data what is driving this association, whether shorter sleep duration is affecting vasopressin release, which affects kidney concentration of urine, or whether shorter sleep duration is also associated with other health factors uncontrolled for that may affect hydration status. For example, short sleep duration may be associated with hydration-related behaviors, e.g. drinking less fluid, as part of a feedback loop. Although the literature is scant on the relationship of how poor sleep or short sleep adversely affects hydration status and thirst [49], anecdotal reports describe repeated difficulties with blood draws and reported headaches, symptoms of dehydration, among experimental participants who have been sleep-deprived [49]. Previous research using NHANES data found that greater water intake in the diet was associated with less likelihood of short and long sleep durations [50], indicating a protective effect of water intake. We attempted to address this by controlling for total water intake in the NHANES analysis in the current paper (water intake was not available in the Kailuan Chinese cohort). When water intake was not adjusted for in the NHANES analysis, results between sleep and hydration status remained consistent (results not shown).
Although we examined the association between sleep and hydration status, a recent experimental study tested the hypothesis that controlled dehydration negatively affects sleep duration and quality [17], the opposite direction of our proposed relationship. They found, using a cross-over design, with a small sample (N = 12) of healthy young males in a euhydrated state and in a dehydrated state, that sleep quality and duration did not significantly vary between the conditions. However, this study measured one night of sleep in each condition and had a small sample size. One notable finding was that the percentage of mean REM sleep decreased by 7 percentage points (35.1% ± 18.8 vs 28.1% ± 9.7) and the percentage of mean light sleep increased by 6.8 percentage points (41.2% ± 15.5 vs 48.0% ± 11.9) in the dehydrated condition compared with the euhydrated condition, though not significant likely due to the low sample size. This study did not measure vasopressin during sleep and so it is hard to know whether vasopressin differed between conditions.
Limitations
All data are observational and from cross-sectional studies or a cross-sectional wave of a cohort study; therefore, the association results from this study should not be viewed as causal. Furthermore, it is not possible to investigate the direction of this association and it is subject to reverse-causality bias, whereby hydration status may be affecting sleep duration, although a previous report does not support this [17]. Future studies could test this hypothesis to further untangle the direction of the association.
Reported sleep is the usual amount of sleep, not necessarily the amount of sleep the participant had the previous night, which would be a more accurate measure for this relationship. Further study using direct measurement of sleep duration is warranted and could assess both the usual average amount of sleep for a time period (e.g. a week or a month) and the amount of sleep the night before measurement of hydration status. Additionally, although we have relatively large sample sizes in both populations, the vast majority of adults reported obtaining 6–8 hr of sleep, so we are unable to examine with high resolution this relationship for the extremes of the population, i.e. those who sleep less than 6 hr and those who sleep 9 or more hours per night on a regular basis.
Differences in available covariate data, measurement differences, and population parameters may introduce residual confounding. The Kailuan Study was 83% male vs 50% male for NHANES and the same dietary intake data were not available. The Kailuan Study used a reagent strip method to assess Usg, which is less reliable [28] than the refractometry method used in NHANES, and data were rounded to 0.005 g/mL versus the 0.001 g/mL precision in NHANES. Reagent strips have been found to be highly associated with Usg however (r = 0.81) [51]. Furthermore, we are limited by one urinary biomarker per sample and do not have multiple biomarkers per participant. We also do not have repeated measures of hydration status for the same individuals to assess how this relationship may manifest within an individual over time and varying hydration levels. However, the replication of this association across populations in different cultural contexts overcomes country-level confounding identified in the majority of studies. Future studies should use the same methodology across sites and examine this relationship longitudinally over the course of a week to understand baseline sleep and hydration status. Finally, we do not have information on vasopressin to examine how differences in vasopressin may potentially mediate the relationship between sleep and hydration status.
Strengths
This paper has several strengths. We use two urinary markers of hydration status, which are sensitive to changes in daily hydration status [36], to assess this relationship on two nationally representative samples from the United States and with a large cohort of Chinese adults. Second, through additional exclusions of adults with diabetes and those taking diuretics, mostly for hypertensive medications, we examined the relationship on a healthier subpopulation and reduce confounding from these medical conditions. The results are consistent across urinary biomarkers on separate samples, across time periods, with additional exclusions, using different sleep categories, and inadequate hydration cutoff. This is the first large-scale study, to the best of our knowledge, that examines the association between sleep duration and hydration status in a cross-cultural context.
Conclusions
Short sleep duration was associated with worse hydration status at a population level for US and Chinese adults. Adults who reported sleeping 6 hr on a nightly basis had significantly more concentrated urine and higher odds of being inadequately hydrated compared with adults who reported sleeping 8 hr. Long sleepers did not have significantly greater risk of inadequate hydration. Future studies should examine this relationship experimentally to assess how variation in sleep duration and quality affects next day markers of hydration status longitudinally. Increasing sleep may have cascading biobehavioral health benefits, one of them being better hydration status, which may be protective of CKD.
Funding
A.Y.R. was supported by the College of Health and Human Development at Pennsylvania State University. The Kailuan Cohort Study is supported by the National Natural Science Foundation of China (grant nos. 81170244 and 81170090).
Conflict of interest statement. O.B. previously served as consultant to Takeda Pharmaceuticals North America (speaker’s bureau), Dinsmore LLC (expert witness testimony), Matsutani America (scientific advisory board), and Chevron (speaking fees). Outside of the submitted work, prior investigator-initiated research grant support from Sepracor (now Sunovion) and Cephalon (now Teva). Outside of the current work, OMB received two subcontract grants to Pennsylvania State University from Mobile Sleep Technologies (NSF/STTR #1622766, NIH/NIA SBIR R43AG056250). No other authors have any disclosures.


Comments