


Abstract
Allergic bronchopulmonary aspergillosis (ABPA) complicates asthma and may lead to chronic pulmonary aspergillosis (CPA) yet global burdens of each have never been estimated. Antifungal therapy has a place in the management of ABPA and is the cornerstone of treatment in CPA, reducing morbidity and probably mortality. We used the country-specific prevalence of asthma from the Global Initiative for Asthma (GINA) report applied to population estimates to calculate adult asthma cases. From five referral cohorts (China, Ireland, New Zealand, Saudi Arabia and South Africa), we estimated the prevalence of ABPA in adults with asthma at 2.5% (range 0.72–3.5%) (scoping review). From ABPA case series, pulmonary cavitation occurred in 10% (range 7–20%), allowing an estimate of CPA prevalence worldwide using a deterministic scenario-based model. Of 193 million adults with active asthma worldwide, we estimate that 4,837,000 patients (range 1,354,000–6,772,000) develop ABPA. By WHO region, the ABPA burden estimates are: Europe, 1,062,000; Americas, 1,461,000; Eastern Mediterranean, 351,000; Africa, 389,900; Western Pacific, 823,200; South East Asia, 720,400. We calculate a global case burden of CPA complicating ABPA of 411,100 (range 206,300–589,400) at a 10% rate with a 15% annual attrition. The global burden of ABPA potentially exceeds 4.8 million people and of CPA complicating ABPA ∼ 400,000, which is more common than previously appreciated. Both conditions respond to antifungal therapy justifying improved case detection. Prospective population and clinical cohort studies are warranted to more precisely ascertain the frequency of ABPA and CPA in different locations and ethnic groups and validate the model inputs.
Introduction
Asthma of any severity may be complicated by allergic bronchopulmonary aspergillosis (ABPA) which may itself be complicated by chronic pulmonary aspergillosis (CPA) [1,2]. Most patients with ABPA are troubled by poorly controlled asthma, production of thick sputum plugs and recurrent pulmonary infection (often associated with bronchiectasis) [3,4]. Unlike invasive aspergillosis, CPA occurs in non-immunocompromised patients [5], which arguably most ABPA patients are. The morbidity of CPA is considerable including weight loss, profound fatigue, productive cough, significant shortness of breath, and life-threatening hemoptysis [6,7]. The radiographic hallmark of CPA is pulmonary and/or pleural cavitation, usually with associated local fibrosis, with or without an aspergilloma [6]. The microbiological evidence required for the diagnosis of CPA is either elevated Aspergillus IgG antibodies (including precipitins) or biopsy/sterile site evidence of aspergillosis by microscopy or culture [5,7].
Both ABPA and CPA respond to antifungal therapy. Two randomized placebo-controlled trials comparing itraconazole and placebo in ABPA demonstrated about 60% responses, with a number needed to treat of 3.58 [8,9]. Patients with CPA also improve with antifungal therapy [7,10–12].
Since the Global INiative on Asthma (GINA) report in 2004 [13], there have been, to our knowledge, no further attempts to estimate the worldwide prevalence of asthma and no one has attempted this for ABPA. Our extensive clinical experience of aspergillosis has emphasized the relatively frequent co-occurrence of ABPA and CPA [2], usually with ABPA preceding CPA, but sometimes appearing to manifest at the same time. Older literature on ABPA emphasizes the remarkable frequency of upper lobe fibrosis and cavitation.
Hence, our objective was to use published clinical and population data as inputs to model estimates of the likely burden of asthma and APBA and CPA as a complication of ABPA worldwide. Asthma burden has been estimated previously in many countries and globally, although sometimes the measure has been current syptoms and in others the lifetime occurence of asthma. We attempted an estimate of asthma in adults using two modelling methods, one of which was more concordant with recent country-wide estimates than the other. As no population estimates for ABPA are available, and there are limited data on CPA complicating ABPA, we have used literature values and extrapolated from these reports. Our estimates are inevitably crude, and perhaps best called ‘Fermi calculations’, after Enrico Fermi (who won the Nobel-prize for physics in 1938). Fermi calculations generally provide estimates with a precision of about one log. Rough estimates are useful and provide a starting point for future epidemiological studies.
Methods
We required a set of information inputs for our model (see Fig. 1). We estimated adult burden of asthma, ABPA and CPA by World Health Organization (WHO) region and individually for the largest countries based on steps set out in Figure 1. We excluded children because the relative frequency of asthma is much higher in children and ABPA correspondingly lower, and CPA is exclusively an adult disease. Having limited incidence data, we had to start with identifying prevalent cases of asthma. We used the country-specific prevalence of asthma from the GINA report [13] and applied it to population estimates from the United Nations (UN) World Population Prospects 2008 [14], for each country with a population of more than 50 million. We used two different methods to ascertain adult asthma burden globablly using the GINA report [13].
Factors used in estimation of allergic bronchopulmonary aspergillosis (ABPA) and chronic pulmonary aspergillosis (CPA) burden in adult asthmatics. The proportion of ABPA (2.5%) is the median from the five studies shown in Table 1. The proportion of CPA complicating asthma is taken from multiple published studies.
In method 1 we employed the GINA overall prevalence rates by country from which, by applying UN population figures, the all-age prevalence was calculated. We manipulated the GINA data using their assertion that the prevalence of clinical asthma in adults is 50% of the self-reported wheezing rate. GINA also provides some adult prevalence rates for some countries which were multiplied by the UN adult population figures and used as proxies for neighboring countries. The problem with this method is that, in some countries, the adult prevalence calculated exceeded the all-age prevalence, which is counter-intuitive. This could well be genuine because over 60% of countries had no GINA adult prevalence rates and proxies had to be used.
So in method 2, we used the GINA report statement that ‘the mean prevalence of current wheezing in children was 88% of that recorded in adults in the countries which participated in both studies’. This proportion was then used to derive the adult prevalence from the all age prevalence using the derived equation: Adult Prevalent cases = total prevalence × adult population / (0.88 pediatric population + adult population). Using current wheezing as numerator, rather than lifetime wheeze or doctor diagnosed asthma, probably better identifies current active cases of asthma. In the United Kingdon (UK), primary care physicians code asthma by wheezing in the last 12 months (Quality and Outcomes Framework (QOF) active annual asthma register which states in code H33: asthma plus a prescription for asthma medication in the previous year [15]) and by lifetime wheeze. These rates are 16% or 26–27%, respectively [16], implying that only about 60% of adults with asthma are actively wheezy in any 12-month period. This method provided results which were compatible with other direct sources covering the United States of America (USA) [17], but lower than those from Scotland [16], which was slightly closer to the figure derived using method 1. For simplicity, we present only method 2 results below, although we contrast the results from both methods in the early part of our discussion.
Next, we focused on asthmatics with ABPA for which we conducted multiple electronic bibliographic database searches using the search terms ‘allergic bronchopulmonary aspergillosis’ and all of (separately) ‘asthma’, prevalence’, ‘frequency’, ‘incidence’ and ‘epidemiology’. Only prospective studies of at least 50 patients with asthma of any severity were selected. There are no true population studies and so studies describing sequential referred patients to secondary care were accepted (Table 1), and four studies from India that were either not sequential cohorts or included tertiary referrals were excluded (Table 1).
Selected studies describing the frequency of allergic bronchopulmonary aspergillosis (ABPA) in asthma in unselected populations.
| Country | Year | Population | Time frame | N studied | ABPA N | Comments | Reference |
| Studies included | |||||||
| South Africa | 1980 | Referrals with asthma or suspected asthma | NS | 500 | 13 (2.6%) | Retrospective analysis of all patients skin tested to fungi | 18 |
| Ireland | 1991 | Adults, all asthma referrals to secondary care, Local population 536,000 | 4 years | 1390 | 9 (0.7%) | 5 of the 14 patients included did not meet adequate criteria of ABPA. Patients followed for 4-year period, so a period prevalence. | 19 |
| New Zealand | 2000 | Adults, all asthma referrals to secondary care | 18 months | 255 | 9 (3.5%) | 4 of the 13 patients excluded. Essentially a referral incidence. | 20 |
| Saudi Arabia | 2001 | Cohort study of new and regular attenders in secondary care. | 18 months | 264 | 6 (2.3%) | 9 patients excluded. 1 patient did not meet ABPA criteria. | 21 |
| China | 2011 | Consecutive non-smoking adult asthmatics | NS | 200 | 5 (2.5%) | Article in Mandarin | 22 |
| Studies not included in model | |||||||
| India | 1976 | Cohort study of secondary and tertiary possible fungal disease referrals | 3–4 years | 1007 | 46 (5.2%) | IgE not measured, and patients had to have asthma and periodic infiltrates, positive skin test, eosinophilia, A. fumigatus grown from sputum and positive Aspergillus precipitins. | 23 |
| India | 2005 | Sequential asthma referrals to a tertiary centre | NS | 105 | 8 (7.6%) | 12 patients excluded. Healthy control group also evaluated. Patients also sensitized to non-fumigatus Aspergilli | 24 |
| India | 2007 | Sequential referrals to a tertiary centre | 4.5 years | 755 | 155 (20.5%) | Full diagnostic details not provided for all ABPA patients. | 25 |
| India | 2010 | Referrals to a tertiary centre | 1 year | 215 | 15 (7%) | Excluded: those in receipt of corticosteroids for 2 weeks in prior 6 months and allergic rhinitis or chronic sinusitis. 6 patients grew A. flavus. | 26 |
NS, not stated.
In the five published studies addressing this proportion [18–22], only cases fulfilling recognized criteria for ABPA (i.e., asthma, Aspergillus sensitization, IgE > 500 kIU/L, eosinophilia and appropriate radiological features) were accepted [27,28]. In Cape Town, 500 primarily white asthmatics of uncertain age were skin tested to various allergic extracts and of those with Aspergillus hypersensitivity, 13 (2.6%) had features of ABPA [18]. In Ireland, the proportion of ABPA cases identified was 10/1,390 (0.72%) (new referrals and cases identified over 4 years of follow-up in that cohort), which amounts to a combination of incident ABPA cases and 4-year period prevalence (five cases were excluded) [19]. In Saudi Arabia, 264 asthma referrals were screened with skin prick tests and total IgE tests and if positive were further investigated (1 patient excluded) [21]. Six (2.3%) patients with ABPA were found over an 18-month period. In New Zealand, 9/255 (3.5%) prospectively evaluated new asthma referrals were found to have ABPA (4 patients excluded) [20], reflecting annual incident cases ill enough to be referred to a chest specialist. A recently published Chinese study identified five patients with ABPA among 200 adult asthmatics seen in a secondary care setting [22]. ABPA is typically a subtle disease in its early stages, often missed for years in asthmatic patients and specialist referral is not necessarily a good proxy for annual incident cases. We have therefore assumed that the true proportion falls somewhere between the highest and lowest estimates of period prevalence and new cases referred, i.e., 2.5% for ABPA among adult asthmatics, with lower and higher bounds of 0.7% and 3.5%. While asthma may remit, ABPA does not, to our knowledge, and so the asthma denominator we have used is active asthma cases.
We conducted a scoping review asking the specific literature searching question of how common is CPA complicating ABPA? We initially adopted a systematic search strategy but quickly realized that the literature was limited and scoping reviews more appropriate [29]. We conducted multiple electronic bibliographic database searches using the search terms ‘allergic bronchopulmonary aspergillosis’ and all of (separately) ‘follow up’, ‘radiology’, ‘cavitation’, ‘cavity’, ‘CT’, ‘radiograph’, ‘radiographic’, ‘outcome’, ‘fungal ball’, ‘aspergilloma’, ‘aspergillosis’ and ‘haemoptysis’ (using both English and American English spellings). We retrieved all literature on aspergilloma as far back as 1936. The primary source of search was Medline, but The Aspergillus Website was also searched (including the historical paper archive [pre-1964]). We did not search the grey literature including meeting abstracts and doctoral theses. We also examined our paper files of pre-1990 papers by hand for appropriate references. We found five relevant papers on pulmonary cavitation in ABPA; all but one based on chest radiographs rather than more sensitive computed tomography (CT) scanning (Table 2) [30–34]. As all these studies tracked clinical cohorts, covering variable time periods, the proportion developing CPA is essentially a period prevalence. For support, we analyzed the interval between the diagnoses of ABPA and CPA in those patients who have manifest both diseases in our centre – five years seemed a good estimate.
Frequency of cavitation and chronic pulmonary aspergillosis in the context of allergic bronchopulmonary aspergillosis (ABPA).
| Year | Country | Sampling method | Imaging | N studied | Pulmonary cavitation N (%) | Aspergilloma N (%) | Lobe shrinkage N (%) | Pleural disease N (%) | Reference |
| 1970 | UK | Long/retro | CXR | 111 | 15 (14) | 8 (7.2) | 40 (36)* | ND | 28 |
| 1977 | India | Long/retro | CXR | 50 | 9 (18) | 2 (4) | ND | ND | 29 |
| 1981 | USA | Long/retro | CXR | 14 | 3 (21) | 1 (7) | ND | ND | 30 |
| 1984 | UK | Long/retro | CXR | 100 | 3 (3) | 0 | 42 (42) | 18 (18) | 31 |
| 1997 | India | Radiology series | CT | 23 | 3 (13) | 0 | ND | 10 (43%) | 32 |
The authors commented that lobe shrinkage was not usually present on initial films but appeared over several years. ND, not described.
Synthesizing these, we have used a best estimate proportion of 10% with deterministic sensitivity analyses using a range from a low of 7% to a high of 20% for those countries without country specific proportions, for five-year period prevalence of CPA complicating ABPA.
For each WHO region, we expanded the subtotal of the major countries on a pro-rata basis to regional populations on the assumption that the larger countries are typical of the region. We applied an annual 15% attrition (mostly death, occasional surgical resection) rate to the CPA prevalence numbers to establish disease burden over five years. As per Figure 1, we obtained a range and best estimate using our deterministic, scenario-based approach.
Results
Asthma
Our model predicts that the global adult asthma prevalence is 193 million (M) people. Large country prevalences estimated by our approach are shown in Table 3. Comparison of our estimates with population-based prevalence data include in the USA, a recent national statistics report for 2009 estimated that 8.2% of the adult population had asthma, or 24.6 M [17], which is virtually identical to our 24.6 M. However, a Scottish population (5.1 M) study in 2003–4 showed 16% of the adult population or 640,000 to have active asthma [16] versus our prediction of 522,800, using method 2. Scotland is recognized to have the highest prevalence of asthma worldwide. In Algeria, Morocco and Tunisia in North Africa, prevalence estimates of asthma in all ages were 3.5–3.9% [35], substantially lower than Europe or North America.
Prevalence of asthma, allergic bronchopulmonary aspergillosis (APBA) and chronic pulmonary aspergillosis (CPA) complicating asthma, assuming a 15% annual attrition of CPA cases.
| Country | Population* (2005) | Adults with asthma | ABPA burden (lower) (0.7%) | ABPA burden (midpoint) (2.5%) | ABPA burden (upper) (3.5%) | Estimated CPA 5-year period prevalence (10% of mid ABPA estimate less attrition) (range 7–20%) |
| Global total | 6,512,276,000 | 193,477,000 | 1,354,000 | 4,837,000 | 6,771,689 | 294,700 (206,300–589,400) |
| China | 1,312,253,000 | 19,645,469 | 138,000 | 491,000 | 688,000 | 41,700 (29,200–98,200) |
| India | 1,130,618,000 | 20,331,609 | 142,000 | 508,000 | 712,000 | 43,200 (30,200–101,700) |
| United States | 302,741,000 | 24,561,292 | 172,000 | 614,000 | 860,000 | 52,200 (36,600–122,800) |
| Indonesia | 219,210,000 | 1,569,627 | 11,000 | 39,000 | 55,000 | 3,300 (2,400–7,900) |
| Brazil | 186,075,000 | 13,968,105 | 98,000 | 349,000 | 489,000 | 29,700 (20,800–69,800) |
| Pakistan | 165,816,000 | 3,788,659 | 27,000 | 94,000 | 133,000 | 8,100 (5,700–18,900) |
| Bangladesh | 153,122,000 | 3,416,715 | 24,000 | 85,000 | 120,000 | 7,300 (5,100–17,100) |
| Russia | 143,470,000 | 2,478,833 | 26,000 | 62,000 | 87,000 | 5,300 (3,700–12,400) |
| Nigeria | 140,879,000 | 3,745,966 | 17,000 | 94,000 | 131,000 | 8.000 (5,600–18,700) |
| Japan | 127,449,000 | 7,091,327 | 50,000 | 177,000 | 248,000 | 15,700 (10,600–35,500) |
| Mexico | 105,330,000 | 2,194,915 | 15,000 | 55,000 | 77,000 | 4,700 (3,300–11,000) |
| Philippines | 85,496,000 | 2,988,537 | 21,000 | 75,000 | 105,000 | 6,400 (4,400–15,000) |
| Vietnam | 84,074,000 | 1,125,569 | 7,900 | 28,000 | 39,000 | 2,400 (1,700–5,600) |
| Germany | 82,409,000 | 4,627,779 | 32,000 | 116,000 | 162,000 | 9,800 (6,900–23,100) |
| Egypt | 77,154,000 | 2,496,526 | 17,000 | 62,000 | 87,000 | 5,300 (3,700–12,500) |
| Ethiopia | 74,661,000 | 1,085,787 | 7,600 | 27,000 | 38,000 | 2,300 (1,600–5,400) |
| Turkey | 71,169,000 | 3,424,403 | 24,000 | 86,000 | 120,000 | 7,300 (5,100–17,100) |
| Iran | 70,765,000 | 2,469,321 | 17,000 | 62,000 | 86,000 | 5,300 (3,700–12,300) |
| Thailand | 65,946,000 | 3,099,283 | 22,000 | 77,000 | 108,000 | 6,600 (4,600–15,500) |
| France | 61,013,000 | 3,223,998 | 23,000 | 81,000 | 113,000 | 6,900 (4,800–16,100) |
| United Kingdom | 60,261,000 | 7,138,150 | 50,000 | 178,000 | 250,000 | 15,200 (10,600–35,700) |
| Congo (DR) | 59,077,000 | 2,021,738 | 14,000 | 51,000 | 71,000 | 4,300 (3,000–10,100) |
| Italy | 58,645,000 | 2,193,394 | 15,000 | 55,000 | 77,000 | 4,700 (3,300–11,000) |
Source: Population Division of the Department of Economic and Social Affairs of the United Nations Secretariat, World Population Prospects: The 2008 Revision, http://esa.un.org/unpp, Tuesday, January 26, 2010; 8:03:40 AM.
DR, Democratic Republic.
By WHO region, the prevalent asthma case burden estimates are: Europe, 42.49 M; Americas, 58.44 M; Eastern Mediterranean, 14.03 M; Africa, 16.78 M; Western Pacific, 32.94 M and South East Asia, 28.82 M.
Allergic bronchopulmonary aspergillosis
Globally our ABPA burden estimate is 4,837,000 patients (range 1,354,000–6,772,000) (Fig. 2). By WHO region, the ABPA burden estimates are: Europe, 1,062,000 (range 297,000–1,487,000); Americas, 1,461,000 (range 409,000–2,045,000); Eastern Mediterranean, 351,000 (range 98,000–491,000); Africa, 419,000 (range 117,000–587,000); Western Pacific, 823,000 (range 230,000–1,152,000); South East Asia, 720,000 (range 202,000–1,009,000). The ABPA burden estimates for countries with a population > 50 M are shown in Table 3, with the greatest number in the USA (614,000; range 176,000–859,000).
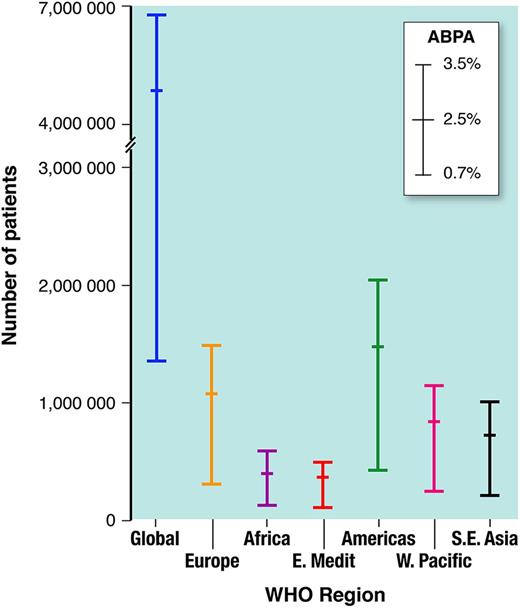
Estimated global burden of allergic bronchopulmonary aspergillosis (ABPA) complicating asthma in adults, by WHO region, with frequency estimates (0.7–3.5%, mean 2.5%).
As an alternative approach to deriving these estimates, we examined the Irish study (our lowest ABPA estimate) from a population perspective. Nine patients with ABPA were referred over a 4-year period from a population of 537,000 with a mean (range) age of 58.9 (12–74) years. Assuming a mean delayed diagnosis of 4 years and an average life expectancy of 75 years, 9.3 ABPA patients per 100,000 would be expected. Globally this computes into a global estimate of ∼606,000 with ABPA. Our middle and upper estimates of 2.5% and 3.5% frequency using the Irish figure as a base estimate would suggest 2,104,000 and 2,946,000 ABPA patients worldwide.
Chronic pulmonary aspergillosis
We calculated a global case burden of CPA associated with ABPA after attrition (assuming median 2.5% ABPA rate in asthma, and a 15% annual attrition rate among those with CPA) of 411,000 patients (range (118,408–575,594 using ABPA rates of 0.7% and 3.5% in asthma and a 10% rate of CPA in ABPA). By WHO region, the burden estimates of CPA complicating ABPA vary from lower bounds of a 0.7% ABPA rate in asthma and a 7% CPA rate in ABPA to a 3.5% ABPA rate in asthma and a 20% CPA rate in ABPA. Assuming a 2.5% ABPA rate in asthma, the range of burden is expressed here from 7–20% CPA rates in ABPA. The overall CPA burden in ABPA in Europe was estimated to be 90,000 (range 63,000–181,000); in the Americas, 124,000 (range 87,000–248,000); in the Eastern Mediterranean, 30,000 (range 21,000–60,000); in Africa, 36,000 (range 25,000–71,000); in the Western Pacific, 70,000 (range 49,000–140,000); and in South East Asia, 61,000 (range 43,000–122,000) (Fig. 3). The CPA burden in ABPA patients is estimated for countries with a population exceeding 50 M (Table 3). As with ABPA, the largest number of cases is predicted to be found in the USA (41,700).
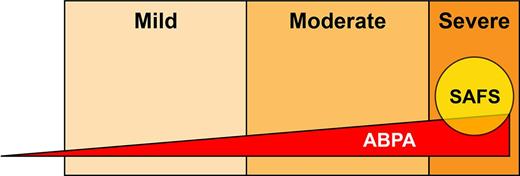
Schematic showing the putative relationship between asthma severity and both allergic bronchopulmonary aspergillosis (ABPA) and severe asthma with fungal sensitization (SAFS). The size of the ABPA triangle and SAFS circle indicative only and not drawn to any scale.
Discussion
Accuracy of asthma estimates
Comparison of the two different methods to ascertain the global adult asthma burden yielded similar order of magnitude but with some differences among countries. Method 1 gives a global burden of 165 M and 116.5 M for the largest 23 countries compared with Method 2 of 193 M and 138.7 M, respectively. For some countries the differences between Method 1 and Method 2 respectively were small, i.e., the USA 26.1 M versus 24.6 M, Japan 8.8 M vs. 7.1 M, Mexico 2.5 M vs. 2.2 M, Germany 5.6 M vs. 4.6 M, Turkey 3.8 M vs. 3.4 M, France both 3.2 M, the UK 5.4 M vs. 7.1 M, and Italy 2.4 M vs. 2.2 M, respectively. For other countries the differences were large, including China 9.0 vs. 19.6 M, India 9.6 M vs. 20.3 M, Indonesia 6.8 M vs. 1.6 M, Brazil 7 M vs. 14 M, Pakistan 1.2 M vs. 3.8 M, Nigeria 0.6 M vs. 3.7 M, Russia 11.5 M vs. 2.5 M, Vietnam 2.6 M vs. 1.1 M, Egypt 0.2 M vs. 2.5 M, Ethiopia 0.3 M vs. 1.1 M, and Democratic Republic of Congo 0.2 M vs. 2 M, respectively.
Part of the explanation for the differences could relate to current syptoms versus the lifetime occurence of asthma. In the UK, these rates are 16% or 26–27% respectively, implying that only about 60% of adults with asthma are actively wheezy in any 12 month period. Other differences may relate to extrapolations of prevalence from small datasets, such as China, Taiwan, Congo and Nigeria. The prevalence we derived using our method 2 matched derived data for the USA [17], but slightly underestimated the actual measured rate in Scotland [16], the locality with the highest asthma rates in the world. All age prevalences in three North African countries were much lower at 3.5–4% [35]. Although our final result is surprisingly high at 193 M adults with active asthma worldwide, it is conservative compared to the GINA estimate of the global asthma burden among both adults and children of 300 M [12,36]. The WHO estimates for the prevalence of asthma [37] are markedly lower than those obtained using the GINA data, likely due to the emphasis on more restrictive definitions and active clinical cases. Our estimates and those of the WHO are of the same order of precision, probably within two-fold of the real number. Again more confirmatory national studies would be helpful to refine these broad estimates, particularly as the GINA data sets utilize an adult age range of 20–44 years of age only, and asthma is an increasing problem in older adults [38]. A review of various older asthma studies estimated that 1–3% of the general population of adults (and children) have severe asthma [39], and the proportion of adult asthmatics with severe asthma is up to 20%, depending on the definition of severe [39,40]. The annual mortality from asthma in adults is ∼ 0.1% [38,41], regardless of age. We have not made any adjustment to period prevalence to account for this.
ABPA case ascertainment
Our model estimates that around 4.8 M people have ABPA. The diagnosis of ABPA is multi-modal requiring an elevated serum immunoglobulin E (IgE), in association with other features [42,43]. In the developed world, diagnosis is readily possible, if considered by the physician, but in low resource countries, many of these tests are unavailable or financially burdensome. Our estimates are limited by the few systematic surveys of ABPA burden undertaken, and a point or period prevalence that differs five-fold (0.7, 2.3, 2.5, 2.6 and 3.5%) [18–22]. These studies probably reflect specialist referral, which is likely to be delayed or incomplete. We have not included in our estimate the remarkably high proportion of patients with ABPA in several outpatient asthma clinics in India (5.2–20.5%) because these are all tertiary referral centers some with exclusions [23–26,44]. We have based the ABPA proportion on active asthma, which is ∼ 60% of lifetime asthma [16] which may partially compensate for presumed specialist referral bias. On the other hand, lack of recognition in primary care may result in under-diagnosis and specialist referral, with the possibility of underestimation of ABPA rates.
Few population based estimates of ABPA have been done. A complex stratified sample of the USA population assessed IgE serum concentrations and asthma (National Health and Nutrition Examination Survey [NHANES]) [45]. In a sample of 2,906 persons < 20 years of age, 36 had asthma and IgE > 1,000 IU/L (1.2%) and in a sample of 4,492 persons > 20 years, 21 had asthma and IgE > 1,000 IU/L (0.5%). The small number of individuals with both asthma and IgE > 1,000 IU/L prevent any stable national estimates being made. Nevertheless, these proportions are consistent with our lower estimate of ABPA for the USA (176,841 people), especially as a serum IgE between 500 and 1,000 IU/L is also consistent with ABPA. The lowest estimate from Ireland [19] using specialist referral from a known population would suggest a rate of about 50% of our lowest model estimates. It is possible the incidence of ABPA has risen since the 1980’s, but repeat surveys in the same locale have not been done. We have not addressed ABPA complicating cystic fibrosis or children with ABPA, nor severe asthma with fungal sensitization (SAFS) [46,47].
CPA case ascertainment
The primary means we have used to estimate CPA burden is radiography. Several CT manifestations of ABPA make no contribution to the diagnosis of CPA, including bronchiectasis, mucus impaction, consolidation, collapse or pleural effusion. Persistent cavitation (> 3 months) with or without the presence of a fungal ball is highly characteristic of CPA including patients with ABPA. Older cross-sectional studies of the radiology of ABPA clearly identify a proportion of patients with cavitation, some of which appears to resolve on subsequent chest radiography. Some patients have aspergillomas, which have a 10% resolution rate [48,49]. Another group of ABPA patients develop lobe fibrosis and shrinkage, usually of the upper lobe [30,33]. The aetiology of upper lobe fibrosis in ABPA is not known, but could be a manifestation of CPA, as most of these descriptions pre-date CT scanning, and minor cavitation could have been missed. Pleural thickening/fibrosis (otherwise termed upper lobe fibrosis or shrinkage) is likely indicative of CPA and is unlikely to resolve. Longitudinal studies of cohorts of ABPA patients integrating radiographic, clinical and serological changes over time are required.
In our CPA burden estimates, we have assumed that those with only pulmonary fibrosis did not have CPA, although probably many do. We adopted this position because the proportions are very high (≥ 40%), and likely reflect referral to tertiary centers of the severe end of the ABPA spectrum. The various estimates in the literature put the rate of cavitation visible on plain chest radiographs between 3% and 21% and the rate of aspergilloma visible in plain radiography from 0–7.2%. Our own data suggests that only about 25% of patients with CPA have an aspergilloma [11]. On the basis of these published data on pulmonary cavitation in ABPA, we estimated the prevalence of CPA worldwide using a 10% proportion, with a range of 7–20%. This might be considered a high rate, but we would argue the even higher fibrosis rate justifies this rate. ABPA represents 12–14% of CPA cases in our recent and another UK series from the 1970s [1,2], suggesting a relatively stable frequency, but variation in different populations is likely and needs study.
The diagnosis of CPA usually relies on positive Aspergillus immunoglobulin G (IgG) serology, as culture is insensitive [50]. Over 70% of ABPA patients have detectable A. fumigatus precipitins or other IgG antibodies [40], whether they have CPA or not (although it is assumed none also have CPA). This issue renders the early diagnosis of CPA in the context of ABPA difficult, because of overlapping diagnostic criteria, although CT scanning greatly improves this distinction, if interpreted accurately. In non-ABPA patients, Aspergillus IgG antibodies have about a 90% sensitivity for CPA, the remainder of CPA cases being diagnosed by histological demonstration of hyphae in cavities or rarely by detectable Aspergillus-specific IgE antibodies. Thus case ascertainment of CPA is likely to be incomplete, even in carefully studied ABPA cohorts. Improved methods to distinguish the complication of CPA from ‘regular’ ABPA are required, especially for early diagnosis.
Accounting for CPA-related mortality
We have directly accounted for loss of patients in our estimates of CPA burden by adding an annual attrition rate of 15% (range 10–25%) in converting annual incident cases to 5-year period prevalence. A few CPA cases (1–17%) undergo segmentectomy, lobectomy or pneumonectomy to attempt cure. CPA is a progressive disease with an annual mortality varying from ∼ 10% [1], to around 30% after referral to hospital [10]. The severity of the baseline pulmonary disease, combined with the extent of lung destruction caused by CPA, appear to be the major arbiters of mortality. No data exist on the relationship between lung function and outcome, in the context of CPA, to our knowledge. The progression and mortality rate of CPA complicating ABPA could also be different from other CPA groups, although this has not been studied.
Acknowledgments
We are indebted to Joanne Gill and library staff for sourcing the papers and to multiple colleagues who answered questions about the frequency of disease in their country including Ashok Shah, (Vallabhbhai Patel Chest Institute, University of Delhi), Rick Moss (Stanford University), Alan Knutsen (St Louis University), Ray Slavin (St Louis University), Tony Catanzaro (University of San Diego), David Stevens (Stanford University) and Peter Gergen (NIH, Bethesda).
Funding
University Hospital of South Manchester, Manchester, UK.
Declaration of interest: Dr Denning holds founder shares in F2G Ltd, a University of Manchester spin-out company and has received grant support from F2G as well as the Fungal Research Trust, the Wellcome Trust, the Moulton Trust, The Medical Research Council, The Chronic Granulomatous Disease Research Trust, the National Institute of Allergy and Infectious Diseases, National Institute of Health Research and the European Union, AstraZeneca and Basilea. He currently or previously acted as an advisor/consultant to F2G, Basilea, Vicuron (now Pfizer), Pfizer, Schering Plough, Nektar, Daiichi, Astellas, Gilead, York Pharma and Lab21. He has been paid for talks on behalf of Schering, Astellas, Novartis, Merck, Dainippon and Pfizer. Alex Pleuvry is a Director and shareholder in Oncalex, an independent consultancy, with no specific financial interest in respiratory or fungal disorders. Dr Cole is a tenured professor, with consultancies on environmental health to public health units but none on respiratory or fungal disorders or their treatment. The authors report no conflicts of interest. The authors alone are responsible for the content and the writing of the paper.
