


Abstract
Breast cancer surgery is associated with side effects, including postsurgical pain, nausea, and fatigue. We carried out a randomized clinical trial to test the hypotheses that a brief presurgery hypnosis intervention would decrease intraoperative anesthesia and analgesic use and side effects associated with breast cancer surgery and that it would be cost effective.
We randomly assigned 200 patients who were scheduled to undergo excisional breast biopsy or lumpectomy (mean age 48.5 years) to a 15-minute presurgery hypnosis session conducted by a psychologist or nondirective empathic listening (attention control). Patients were not blinded to group assignment. Intraoperative anesthesia use (i.e., of the analgesics lidocaine and fentanyl and the sedatives propofol and midazolam) was assessed. Patient-reported pain and other side effects as measured on a visual analog scale (0–100) were assessed at discharge, as was use of analgesics in the recovery room. Institutional costs and time in the operating room were assessed via chart review.
Patients in the hypnosis group required less propofol (means = 64.01 versus 96.64 μg; difference = 32.63; 95% confidence interval [CI] = 3.95 to 61.30) and lidocaine (means = 24.23 versus 31.09 mL; difference = 6.86; 95% CI = 3.05 to 10.68) than patients in the control group. Patients in the hypnosis group also reported less pain intensity (means = 22.43 versus 47.83; difference = 25.40; 95% CI = 17.56 to 33.25), pain unpleasantness (means = 21.19 versus 39.05; difference = 17.86; 95% CI = 9.92 to 25.80), nausea (means = 6.57 versus 25.49; difference = 18.92; 95% CI = 12.98 to 24.87), fatigue (means = 29.47 versus 54.20; difference = 24.73; 95% CI = 16.64 to 32.83), discomfort (means = 23.01 versus 43.20; difference = 20.19; 95% CI = 12.36 to 28.02), and emotional upset (means = 8.67 versus 33.46; difference = 24.79; 95% CI = 18.56 to 31.03). No statistically significant differences were seen in the use of fentanyl, midazolam, or recovery room analgesics. Institutional costs for surgical breast cancer procedures were $8561 per patient at Mount Sinai School of Medicine. Patients in the hypnosis group cost the institution $772.71 less per patient than those in the control group (95% CI = 75.10 to 1469.89), mainly due to reduced surgical time.
Hypnosis was superior to attention control regarding propofol and lidocaine use; pain, nausea, fatigue, discomfort, and emotional upset at discharge; and institutional cost. Overall, the present data support the use of hypnosis with breast cancer surgery patients.
Hypnosis has been shown to reduce the need for medication and postsurgical symptoms in some surgical populations, but its effectiveness in breast cancer patients undergoing surgery was not known.
Randomized trial in which use of anesthesia during surgery and patient-reported postsurgical pain and other side effects were compared in women who were randomly assigned to a brief psychologist-conducted hypnosis intervention before excisional tumor biopsy or lumpectomy or to a control (nondirected listening) session with a psychologist. Institutional costs of surgery were also compared between the groups.
Patients in the hypnosis group required less of the analgesic lidocaine and the sedative propofol during surgery than patients in the control group; they also reported less postsurgical pain and other side effects and spent less time in surgery. Surgical costs were also lower in the hypnosis group.
The hypnosis intervention not only reduced use of anesthesia and self-reported pain but also reduced institutional costs for surgery, mainly by reducing time in the operating room.
Patients were not blinded to their group assignment, and the effectiveness of blinding of the research and clinical staff was not formally assessed. Whether the hypnosis intervention would be effective if administered by nonpsychologists was not evaluated.
Minor surgical procedures are regularly performed with adjuvant injections of local anesthetic agents combined with systemic sedative and analgesic medications. Although modern drug regimens are effective in eliminating pain and improving tolerability of procedures, surgery continues to be associated with clinically significant side effects, including postsurgical pain, nausea, and fatigue ( 1–3 ). These complications frequently prolong recovery room stay, delay discharge, lead to unanticipated readmission, and require additional pharmacotherapeutic intervention ( 2 , 4 , 5 ), all of which are associated with increased costs.
Nonpharmacotherapeutic manipulations of physiologic processes have achieved success in mitigating pain and anxiety in many contexts ( 6 , 7 ). One such technique is hypnosis, a brief cognitive–behavioral technique with no specific side effects ( 8 , 9 ). Clinical research with at least 20 different surgical populations has indicated that hypnosis can reduce the need for medication, reduce postsurgical symptoms, or enhance recovery (e.g., by reducing pain, nausea, and length of hospital stay) ( 7 ).
Breast cancer surgery patients represent the largest cohort of female cancer patients treated surgically in the United States each year ( 10 ). Therefore, the development of nonpharmacologic interventions that can reduce the need for medication and provide symptom relief for these patients could have a large impact. A single small study has provided evidence of the treatment efficacy of hypnosis with breast cancer surgical patients ( 11 ). In addition, meta-analyses ( 7 , 12 ), narrative reviews ( 13 , 14 ), and randomized clinical studies ( 15–18 ) all support the potential clinical utility of hypnosis with surgical breast cancer patients.
Breast cancer surgery thus represents an opportunity to examine the clinical benefits of presurgery hypnosis. Based on the literature reviewed above, we designed a randomized clinical trial of a brief presurgery hypnosis intervention compared with an attention control condition in breast cancer surgery patients. Our primary hypothesis was that a brief presurgery hypnosis intervention would decrease use of perioperative pharmacotherapeutic agents and would decrease pain, nausea, fatigue, discomfort, and emotional upset following breast cancer surgery. Our secondary hypothesis was that brief presurgery hypnosis would reduce costs associated with surgical and medical procedures (e.g., use of medications, time spent in clinical areas).
Patients and Methods
Participants
Women scheduled for breast cancer surgery were recruited from two Mount Sinai Medical Center (MSMC) surgical practices (C. Weltz and A. Goldfarb). Patients who were scheduled to undergo excisional breast biopsy or lumpectomy, with or without limited axillary node dissection (including sentinel lymph node biopsy), were eligible. The surgical procedures differed in that a greater surgical margin was taken with lumpectomy to ensure full resection of malignant tissue ( 19 ). Eligibility criteria also included the ability to speak and read English (because the intervention and study forms were in English) and willingness to be randomly assigned to study treatment condition. Patients were ineligible if they were scheduled for mastectomy or lumpectomy with full axillary dissection or if they had any uncontrolled major comorbid mental or physical illness. Patient hypnotizability was not assessed because previous data indicate that approximately 89% of patients would be responsive to the hypnosis intervention ( 7 ) and because prescreening for hypnotizability with “gold standard” measures would take longer than the intervention itself ( 20 ). The study was approved by the Mount Sinai School of Medicine Institutional Review Board, and all patients provided written informed consent. Participants were randomly assigned to the hypnosis or attention control group using computer-generated random positive integers ( 21 ). Both the hypnosis and attention control conditions are described below. Randomization was allocated by surgery type (lumpectomy or excisional breast biopsy). That is, separate randomization allocations were used for each surgery type to ensure roughly equivalent distributions of surgical patients across study groups (it should be noted that the randomization allocations resulted in unequal numbers in the intervention groups). To reduce potential bias, blinding procedures were followed for assessment personnel, anesthesiologists, and surgeons. Although blinding to group assignment was not formally assessed, the following precautions were followed: 1) the hypnosis intervention took place in a private room away from clinical staff (anesthesiologists, surgeons); 2) anesthesia data were recorded from computer records; no outcome data were collected by clinical staff; 3) the same interventionists (PhD-level clinical psychologists) met with all patients (hypnosis and attention control), so the study assessment staff were not cued to group assignment by the presence of an interventionist; and 4) the interventionists collected no outcome data. Interventionists were given each patient's randomization assignment on the morning of surgery. Eligibility was confirmed before group assignment ( Fig. 1 ).
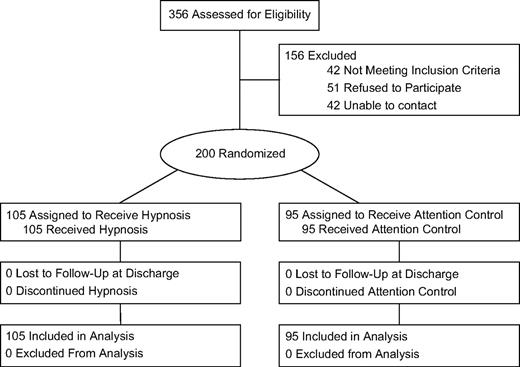
Trial flow diagram. Randomization allocations resulted in unequal numbers in the groups.
The hypnosis intervention was provided in a 15-minute session on the morning of surgery, within 1 hour before surgery. The postsurgical assessment was conducted at the end of the surgical treatment day, before hospital discharge. Because patients received the brief intervention before their surgery and were assessed for outcome variables before discharge that same day, no patients were lost to follow-up (see Fig. 1 ). Patients were enrolled from February 2000 to February 2006.
Treatment Conditions
Both the hypnosis and attention control sessions were delivered to patients individually by interventionists according to the study protocol manual and were standardized to last 15 minutes. The protocol manual was developed in an initial preliminary study with breast cancer surgical patients ( 11 ) (details of the intervention can be obtained from G. H. Montgomery).
The hypnosis intervention was based on previously published work ( 11 , 22 ). The scripted hypnosis session included a relaxation-based induction (including imagery for muscle relaxation), suggestions for pleasant visual imagery, suggestions to experience relaxation and peace, specific symptom-focused suggestions (i.e., to experience reduced pain, nausea, and fatigue), a deepening procedure, and instructions for how patients could use hypnosis on their own following the intervention session.
The attention control procedure was based on a published attention control paradigm that has been used with interventional radiology patients ( 23–25 ). Patients in the attention control group spent identical amounts of time with interventionists as did patients in the hypnosis group, to control for professional attention. Attention control sessions were led by the same interventionists who led the hypnosis sessions. However, the interventionists did not lead the attention control patients in imagery, relaxation, or even simple discussion. Rather, the interventionists allowed patients to direct the flow of the conversation and provided supportive/empathic comments according to standardized procedures ( 23 ). The interventionists matched verbal and nonverbal communication patterns, listened attentively, avoided the use of prejudicial or negatively valued language, and used emotionally neutral descriptors in conversation ( 23 ).
All four interventionists were PhD-level clinical psychologists with advanced training in the use of hypnosis in a medical setting. All interventionists went through didactic and practical training and completed at least five practice interventions with healthy volunteers under the direct supervision of G. H. Montgomery. Patient permission was obtained to audiotape all sessions, and 20% of audiotapes were randomly reviewed by G. H. Montgomery to ensure treatment fidelity.
The interventionists did not participate in data collection, and each interventionist worked with an equal number of hypnosis and control patients. There were no statistically significant effects of interventionist on any outcome variable (all P values > .43).
Operative procedures (surgical and anesthetic) followed uniform institutional guidelines. Anesthesia was administered by Department of Anesthesiology faculty and by residents and fellows under their supervision. All patients were treated with the same monitored anesthesia care protocol that included propofol, midazolam, fentanyl, and lidocaine. The procedure involved a combination of analgesics (lidocaine [2% with 1:100000 epinephrine]) and fentanyl) with anesthesia (conscious to deep sedation achieved with midazolam and propofol). Dosage of sedatives was titrated by anesthesiologists who were blinded to patient intervention group assignment. Doses of lidocaine were administered as determined by the anesthesiologist in response to patient agitation. Local anesthesia was supplemented with an intravenous sedation regimen to achieve an Observer's Assessment of Alertness/Sedation score of 2–4 ( 26 ). Monitored anesthesia care involved combinations of short-acting narcotic agents (fentanyl 0.5–2 μg/kg infusion) and sedative agents (midazolam 0.01–0.1 mg/kg and/or propofol 0–50 μg/kg). Patients were also given acetaminophen and acetaminophen/oxycodone hydrochloride in the postanesthesia care unit as needed based on their reports of pain.
Outcome Measures
Demographic information (e.g., age, education, marital status) was collected from patients using mailed questionnaires. Medical charts were reviewed and abstracted for apposite medical and surgical data (e.g., anesthesia and operative records). After patients reached standardized hospital criteria for discharge ( 27 ), their subjective experiences of pain intensity, pain unpleasantness, fatigue, nausea, physical discomfort, and emotional upset were assessed by BA- and MA-level research assistants using 10-cm visual analog scales (VASs) ( 11 , 28–36 ). Both intensity (i.e., amount) and unpleasantness ( 30–32 ) of pain were assessed to capture its sensory and affective dimensions ( 37 ). The scores for each VAS ranged from 0 to 100. Because all patients underwent ambulatory surgical procedures, all VAS outcome assessments took place on the same day as surgery. Data on intraoperative and postoperative anesthesia and analgesia use were collected from Department of Anesthesiology operative records within 1 month of surgery. The surgery time variable represents the time spent by the patient in the operating room, starting when the surgical team was ready to begin. Surgical time includes preparation time but does not include time unrelated to the procedure (e.g., tardiness of any individual on the operating team that prevented the procedure from taking place on schedule). Surgery time ended when anesthesia was discontinued (as indicated in the medical records). The recovery (i.e., postanesthesia care unit) time variable represents time spent in clinical areas in the hospital following surgery before discharge. At MSMC, patients who recover quickly may be sent directly to administrative areas and therefore may spend no time in the postanesthesia care unit.
Institutional Cost Data
Data concerning costs of procedures, medications, and staff were based specifically on financial data from MSMC. Dollar values for salaries, medication costs, and time spent in clinical areas were obtained from Mount Sinai Pharmacy, the Department of Surgery, and the Department of Anesthesiology. To provide a context for the cost-effectiveness of the intervention, baseline costs were established using the overall diagnostic-related group reimbursement rate for procedures. Threshold analyses were conducted to determine the monetary break-even points (amount of dollars that could be spent on a dedicated interventionist without increasing institutional costs) for surgical practices having 100, 200, 300, and 400 breast cancer surgical patients annually. Finally, sensitivity analyses were conducted to investigate the potential generalizability of the findings. Because costs may vary widely between institutions, we calculated cost-effectiveness for hypothetical institutions that have cost structures of 20%, 30%, or 40% higher or lower than the MSMC institutional cost structures presented here.
Statistical Analyses
The trial was designed to have a minimum of 80% power with alpha of .05 to detect a small to medium effect size for clinical outcomes allowing for the inclusion of up to six potential covariates (statistically controlling for any possible failures of randomization on relevant patient factors [age, ethnicity, education, surgery type, surgeon, marital status]). This approach yielded a projected sample size of 200 participants. Intent-to-treat procedures were followed ( 38 ). Pretreatment comparisons of demographic and medical factors ( Table 1 ) were conducted using analysis of variance (ANOVA) and chi-square tests (using the Mantel–Haenszel test for trend with ordered variables ( 39 ). All tests of statistical significance were two-sided. Multivariate analysis of variance (MANOVA) and ANOVA tests were used because the outcome variables are continuous and the focus of the hypotheses is on changes in amount and severity of outcomes, not incidence. Transforming continuous data to categorical data would be inappropriate ( 40 ). For outcome variables, an effect size “ d ” was calculated (with 95% confidence intervals [CIs]) to provide an estimate of magnitude of intervention effects that can be compared across studies. d , which is calculated by subtracting the means of treatment and control groups and dividing by the standard deviation of the control group ( 41 ), provides a standardized estimate of effect that can be used to assess clinical meaningfulness and to compare study results across outcomes and across studies that may use different outcome assessment methods. By convention ( 42 ), a d of 0.2 is considered small, of 0.5 is considered medium, and of 0.8 is considered large. The literature has indicated that an effect size ( d ) of 0.2 or greater is clinically meaningful ( 43 , 44 ).
Pretreatment comparisons of treatment groups *
| Characteristic | Hypnosis intervention group (N = 105) | Attention control group (N = 95) | F or χ 2 value | P value † |
| Age (y), mean (SD) | 48.73 (12.88) | 48.25 (13.30) | F = 0.07 | .80 |
| Ethnicity | ||||
| White | 71 (67%) | 55 (58%) | χ 2 = 2.91 | .41 |
| Hispanic | 13 (12%) | 17 (18%) | ||
| African American | 11 (11%) | 15 (16%) | ||
| Other | 10 (10%) | 8 (8%) | ||
| Marital status | ||||
| Currently married | 53 (50%) | 45 (47%) | χ 2 = 0.19 | .66 |
| Education | χ 2 = 0.07 | .78 | ||
| ≤12 y | 13 (12%) | 12 (13%) | ||
| Partial college | 26 (25%) | 22 (23%) | ||
| 4-y college graduate | 39 (37%) | 34 (36%) | ||
| Postgraduate | 27 (26%) | 27 (28%) | ||
| Weight (kg), mean (SD) | 66.30 (14.42) | 65.59 (14.97) | F = 0.09 | .81 |
| Scheduled surgery | ||||
| Lumpectomy | 29 (28%) | 22 (23%) | χ 2 = 0.52 | .47 |
| Excisional biopsy | 76 (72%) | 73 (77%) | ||
| Postsurgery diagnosis | ||||
| Cancer positive | 37 (35%) | 26 (27%) | χ 2 = 1.43 | .24 |
| Needle localization procedure | ||||
| Yes | 57 (54%) | 54 (57%) | χ 2 = 0.13 | .72 |
| Axillary node dissection ‡ | ||||
| Yes | 19 (18%) | 12 (13%) | χ 2 = 1.14 | .29 |
SD = standard deviation.
The Mantel–Haenszel test for trend is reported for the education variable. Other P values are from analysis of variance and chi-square tests. All P values are two-sided.
Includes patients undergoing sentinel lymph node biopsy.
To establish the cost effects of the hypnosis intervention, consistent with published approaches to cost-effectiveness analyses ( 45 ), dollar values were assigned only to those outcome variables that statistically differed between groups ( P <.05).
Before calculating inferential statistics, we checked the distributions of key demographic and medical factors between the treatment and control groups for potential failures of randomization ( Table 1 ). None of the variables showed a statistically significant difference in distribution between the groups. Therefore, none of these factors were included as potential covariates in subsequent analyses. Next, distributions of the primary outcome variables were examined. There were no gross violations of normality (all skewness and kurtosis values were within ±3) ( 46 ). However, descriptive analyses indicated that the propofol values contained an outlier: one value for total amount of propofol was greater than two standard deviations higher than the next highest value. Winsorizing, a standard statistical procedure for removing the biasing effects of outliers ( 47 ), was used for this value. The descriptive analyses also indicated that two values for time spent in clinical areas were outliers, and these were winsorized as well. Following these data screening and cleaning procedures, ANOVA statistical procedures as implemented in SAS ( 21 ) were used to analyze the clinical effectiveness of the intervention. Additional exploratory analyses were performed to report costs from the institutional perspective as a function of group assignment ( 45 ). Because some of the clinical outcomes were under the control of the anesthesiologists (n = 58) caring for patients in the study, anesthesiologist as a variable was examined for a possible relationship to study group assignment, and no relationship between anesthesiologist and study group assignment was found (Wald = 0.19, P >.66). In addition, including anesthesiologist as a covariate in preliminary analyses yielded a pattern of results identical to the original results. Therefore, anesthesiologist was not included in the models presented.
Results
Comparisons of pretreatment demographic and medical factors ( Table 1 ) indicate that there were no statistically significant between-group differences in these factors. Intraoperative use of analgesics for pain control (fentanyl and lidocaine) and of sedatives (midazolam and propofol), as well as postoperative use of acetaminophen and acetaminophen/oxycodone hydrochloride for pain control, were compared between the hypnosis and attention control groups ( Table 2 ) using MANOVA. There was an overall group difference in intraoperative medication use [ F (4, 195) = 3.91, P <.005], with patients in the hypnosis group receiving less medication than patients in the control group. Regarding specific medications, one-way ANOVAs revealed that use of lidocaine and propofol was statistically significantly lower in patients in the hypnosis group. For lidocaine, the mean difference (control minus hypnosis group) was 6.86 mL (95% CI = 3.05 to 10.68), and for propofol, the mean difference was 32.63 μg (95% CI = 3.95 to 61.30). Fentanyl and midazolam use, however, did not differ statistically significantly between the two groups. There was no effect of the intervention on postanesthesia care unit analgesic use (acetaminophen or acetaminophen/oxycodone hydrochloride) ( P values > .20).
Perioperative anesthesia use by intervention group *
| Hypnosis group (N = 105) | Attention control group (N = 95) | |||||||||
| Type of anesthesia | Mean (SD) | Median (range) | Mean (SD) | Median (range) | Mean difference (95% CI) | F value | P value † | d ‡ (95% CI) | ||
| Intraoperative analgesics | ||||||||||
| Fentanyl (μg) | 0.14 (0.22) | 0.50 (0.10–1.50) | 0.15 (0.25) | 1.09 (0.10–1.53) | 0.01 (−0.05 to 0.08) | 0.19 | .67 | 0.04 (−0.24 to 0.32) | ||
| Lidocaine (mL) | 24.23 (12.25) | 20.00 (2.00–100.00) | 31.09 (15.05) | 30.00 (3.00–80.00) | 6.86 (3.05 to 10.68) | 12.62 | <.001 | 0.46 (0.18 to 0.74) | ||
| Intraoperative sedatives | ||||||||||
| Midazolam (mg) | 2.07 (1.41) | 2.00 (2.00–6.00) | 2.23 (1.56) | 2.00 (2.00–6.00) | 0.16 (−0.26 to 0.57) | 0.54 | .46 | 0.10 (−0.18 to 0.38) | ||
| Propofol (μg) | 64.01 (92.23) | 0.08 (0.00–370.00) | 96.64 (113.14) | 70.00 (0.00–600.00) | 32.63 (3.95 to 61.30) | 5.03 | .03 | 0.29 (0.01 to 0.57) | ||
| Postoperative analgesics | ||||||||||
| Acetaminophen (mg) | 49.05 (171.63) | 0 (0–650) | 56.84 (192.36) | 0 (0–1000) | 7.79 (−24.13 to 31.90) | 0.09 | .76 | 0.04 (−0.24 to 0.32) | ||
| Acetaminophen/oxycodone hydrochloride (mg) § | 0.30 (1.31) | 0 (0–10) | 0.54 (1.71) | 0 (0–10) | 0.24 (−0.18 to 0.66) | 1.27 | .26 | 0.14 (−0.14 to 0.42) | ||
SD = standard deviation; CI = confidence interval.
P values are from analysis of variance tests. All P values are two-sided.
d represents the standardized effect size for intervention group effects on outcome variables. An effect size ( d ) of 0.2 or greater is considered to be clinically meaningful ( 43 ).
For patients who received acetaminophen/oxycodone hydrochloride, acetaminophen dose remained constant (325 mg), and only oxycodone dose is shown.
We then compared the hypnosis and attention control groups on patient-reported pain intensity, pain unpleasantness, nausea, fatigue, discomfort, and emotional upset. These outcomes were analyzed as continuous variables ( Table 3 ). A MANOVA analysis of the six outcomes (as assessed by VAS) indicated that there was an overall effect of intervention group on these outcomes collectively [ F (6, 193) = 15.73, P <.0001]. One-way ANOVAs of the effects of intervention group on VAS outcomes revealed that each outcome was statistically significantly lower in patients randomly assigned to the hypnosis group compared with those in the control group: pain intensity (mean difference between control and hypnosis group = 25.40, 95% CI = 17.56 to 33.25), pain unpleasantness (mean difference = 17.86, 95% CI = 9.92 to 25.80), nausea (mean difference = 18.92, 95% CI = 12.98 to 24.87), fatigue (mean difference = 24.73, 95% CI = 16.64 to 32.83), discomfort (mean difference = 20.19, 95% CI = 12.36 to 28.02), and emotional upset (mean difference = 24.79, 95% CI = 18.56 to 31.03). In all cases, mean differences were clinically meaningful. That is, the effect size ( d ) for each of the VAS outcomes was larger than the 0.2 minimum guideline for clinical meaningfulness (43). Indeed, all of the effect sizes fell in the medium or large range (VAS outcome effect sizes ranged from d = 0.57 to d = 0.91).
Postsurgical scores on patient symptoms and group effect *
| Hypnosis group (N = 105) | Attention control group (N = 95) | |||||||||
| Visual analog scale outcome data † | Mean (SD) | Median (range) | Mean (SD) | Median (range) | Mean difference (95% CI) | F value | P value ‡ | d§ (95% CI) | ||
| Pain intensity | 22.43 (25.37) | 15 (0–100) | 47.83 (30.82) | 46 (0–100) | 25.40 (17.56 to 33.25) | 40.79 | <.001 | 0.82 (0.53 to 1.11) | ||
| Pain unpleasantness | 21.19 (25.41) | 11 (0–100) | 39.05 (31.43) | 35 (0–100) | 17.86 (9.92 to 25.80) | 19.69 | <.001 | 0.57 (0.28 to 0.85) | ||
| Nausea | 6.57 (18.01) | 0 (0–100) | 25.49 (24.41) | 13 (3–100) | 18.92 (12.98 to 24.87) | 39.41 | <.001 | 0.78 (0.49 to 1.07) | ||
| Fatigue | 29.47 (28.40) | 20 (0–100) | 54.20 (29.61) | 55 (5–100) | 24.73 (16.64 to 32.83) | 36.32 | <.001 | 0.84 (0.55 to 1.13) | ||
| Discomfort | 23.01 (23.58) | 18 (0–80) | 43.20 (32.26) | 42 (4–100) | 20.19 (12.36 to 28.02) | 25.87 | <.001 | 0.63 (0.35 to 0.91) | ||
| Emotional upset | 8.67 (16.62) | 0 (0–100) | 33.46 (27.30) | 19 (4–100) | 24.79 (18.56 to 31.03) | 61.48 | <.001 | 0.91 (0.62 to 1.20) | ||
SD = standard deviation; CI = confidence interval.
Scores on all scales range from 0 to 100.
P values are from analysis of variance tests. All P values are two-sided.
d represents the standardized effect size for intervention group effects on outcome variables. An effect size ( d ) of 0.2 or greater is considered to be clinically meaningful ( 43 ).
Consistent with our interest in cost-effectiveness, we also investigated the possibility that the hypnosis intervention would reduce time spent in clinical areas relative to attention control patients. Analyses of clinical time revealed a statistically significant effect of group on surgery time but not on recovery time ( Table 4 ). Patients in the hypnosis group spent 10.60 fewer minutes (95% CI = 0.92 to 20.27) in surgery than those in the control group.
Mean clinical care times (in minutes) by group *
| Hypnosis group (N = 105) | Attention control group (N = 95) | |||||||||
| Clinical area | Mean (SD) | Median (range) | Mean (SD) | Median (range) | Mean difference (95% CI) | F value | P value † | d‡ (95% CI) | ||
| Surgery | 43.37 (38.68) | 37 (9–171) | 53.97 (29.56) | 49 (8–163) | 10.60 (0.92 to 20.27) | 4.66 | .04 | 0.36 (0.08 to 0.64) | ||
| Postanesthesia care unit | 76.33 (41.44) | 79 (0–217) | 88.76 (56.09) | 90 (0–275) | 12.42 (–1.24 to 26.09) | 3.21 | .08 | 0.22 (–0.06 to 0.50) | ||
SD = standard deviation; CI = confidence interval.
P values are from analysis of variance tests. All P values are two-sided.
d represents the standardized effect size for intervention group effects on outcome variables. An effect size ( d ) of 0.2 or greater is considered to be clinically meaningful (43).
To analyze the potential cost savings associated with adjunctive hypnosis from the perspective of the institution, dollar values were obtained from MSMC records for factors on which the groups differed statistically significantly (surgery time, propofol, lidocaine), consistent with standard procedures in the literature (45) ( Table 5 ). Cost savings can also be placed in the context of the procedure cost. Surgical breast procedures cost our institution $8561 per patient. The hypnosis intervention reduced institutional costs on average by $772.71 per patient (95% CI = $75.10 to $1469.89; Table 5 ). It should be noted that the cost savings is largely accounted for by reduced surgery time and that MSMC surgery costs incorporated personnel (e.g., nurses) as well as equipment (e.g., surgical tables) unless otherwise indicated. This between-group difference was statistically significant [ F (1, 198) = 4.77, P <.03].
Hypnosis intervention effects on institutional costs *
| Clinical factors and costs | Hypnosis group (N = 105) | Attention control group (N = 95) |
| Surgery-related costs | ||
| OR time (mean) | 43.37 min | 53.97 min |
| OR room cost † | $67.50/min | $67.50/min |
| Surgeon cost ‡ | $2.26/min | $2.26/min |
| Anesthesiologist cost § | $1.96/min | $1.96/min |
| Average sedative or analgesic cost | ||
| Propofol | $23.81/patient | $35.94/patient |
| Lidocaine | $1.24/patient | $1.59/patient |
| Interventionist cost ‖ | $0.75/min | $0.75/min |
| Mean total cost | $3146.80 | $3919.51 |
OR = operating room. Variables included in this table are those that differed statistically significantly by group. Cost-effectiveness analyses conform to standard practice in economic evaluations of medical technologies ( 45 ). It may take institutions time to adjust OR scheduling to maximize the savings, but the underlying presumption is that in the long run, scheduling will adjust.
Includes nursing staff, intravenous line setup, monitoring.
$150000/y, 30% benefits, 45 wk/y, 32 h/wk.
$130000/y, 30% benefits, 45 wk/y, 32 h/wk.
$50000/y, 30% benefits, 45 wk/y, 32 h/wk.
Threshold analyses were conducted to determine the break-even point at which the hypnosis intervention would no longer yield cost savings from an institutional perspective. As an example, based on the cost savings presented in Table 5 , if a surgical practice included 100 breast cancer surgical patients annually, the practice could devote $77271 of resources to compensating a psychologist before the financial break-even point is reached. In other words, the intervention is cost saving or cost neutral if the annual total compensation package of the psychologist is less than or equal to $77271. Similarly, compensation packages of $154542, $231813, or $309084 could be devoted to paying psychologists in surgical practices of 200, 300, and 400 patients, respectively, before the break-even points would be reached. These threshold analyses do not assume other duties of a psychologist and represent only 25, 50, 75, and 100 hours, respectively, of providing the hypnosis intervention annually by the psychologist.
Our cost-effectiveness results are based specifically on MSMC cost data. To gauge the generalizability of the results, we conducted a sensitivity analysis. Sensitivity analysis addresses the possibility that cost structures will differ at different institutions (e.g., the cost per minute of surgery may be higher or lower at other institutions due to variance in salaries). Sensitivity analyses indicate that if cost structures were 20%, 30%, or 40% greater than MSMC costs, the intervention would reduce institutional costs by $927, $1004, and $1082, respectively. If cost structures were 20%, 30%, or 40% less than MSMC costs, the intervention would reduce institutional costs by $618, $541, and $464 respectively.
Discussion
The present randomized controlled trial demonstrated that a brief hypnosis intervention before breast cancer surgery statistically significantly reduced intraoperative use of the analgesic lidocaine and the sedative propofol. The hypnosis intervention also reduced patient-reported postsurgical pain (intensity and unpleasantness), nausea, fatigue, discomfort, and emotional upset to an extent that was consistent with benchmarks for clinically meaningful differences ( 43 ) as well as with effect sizes in the surgical hypnosis literature ( 7 ). Analyses of pretreatment demographic and medical factors indicated that the between-group differences were not attributable to failures of randomization.
The impact of the hypnosis intervention on medication use should be considered in the context of current medical practice at our institution (MSMC). Most patients presenting for breast cancer surgery typically receive a standard dose of fentanyl and/or midazolam before the onset of the procedure and titrated doses of lidocaine and propofol as judged necessary by the anesthesiologist based on patient agitation. Thus, based on clinical practice at MSMC, it is not surprising that the hypnosis intervention affected the use of lidocaine and propofol specifically because those are the two agents that are typically titrated to individual patient responses. The titration of lidocaine and propofol is consistent with anesthesiology practice at other institutions (e.g., 48).
The effectiveness of hypnosis for controlling side effects of other types of surgery [e.g., breast reduction ( 16 ), gynecologic surgery ( 49 ), coronary artery bypass ( 50 )] has been established in the broader literature 7 ; however, this study is, to our knowledge, the first randomized trial with breast cancer surgical patients that was sufficiently powered to demonstrate these beneficial effects as well as to demonstrate cost-effectiveness. Some earlier studies have failed to find effects of hypnosis with surgical patients. For example, one study provided hypnosis in the surgical suite after the initiation of general anesthesia ( 51 ) and found no effect of hypnosis. However, it is unclear whether these patients had the necessary cognitive capacity following the onset of general anesthesia to participate in, or even to perceive, the hypnotic suggestions. Overall, our results support the present hypnosis intervention as a brief, clinically effective means for controlling patients' pain, nausea, fatigue, discomfort, and emotional upset following breast cancer surgery beyond traditional pharmacotherapeutic approaches.
Cost-effectiveness analyses provided strong evidence that hypnosis reduced costs from an institutional perspective. On average, each patient in the hypnosis group reduced costs to the institution by $772.71 relative to a patient in the control condition. These cost savings were due primarily to reduced time in surgery in the hypnosis group. It is possible that the shorter procedure times in the hypnosis group were due to the patients being easier to prepare for surgery and to sedate or due to less time having been spent administering medications to patients. However, we did not investigate these mechanisms, and therefore, these possibilities are highly speculative. Overall, our results are consistent with studies demonstrating the ability of hypnosis to be a cost-effective intervention in other clinical contexts (e.g., radiologic procedures) ( 18 , 25 ). In particular, reduced procedure times associated with hypnosis have been demonstrated in interventional radiology patients ( 24 ).
The present brief hypnosis intervention appears to be one of the rare clinical interventions that can simultaneously reduce both symptom burden and costs. Patients are likely to benefit from less time in surgery and reduced use of sedatives because patients undergoing longer surgical procedures with more sedatives tend to have greater nausea ( 52 ) and pain 4 following surgery and tend to recover more slowly ( 53 ).
In this study, it appeared that time in surgery was by far the largest contributor to cost savings ( Table 5 ). It should be recognized that it may take time for hospital administrators to adjust operating room scheduling to maximize cost savings. However, the present approach is consistent with standard practice in economic evaluations of medical technologies, and cost savings should be realized in the long run ( 45 ). The present results are limited to institutional costs, which are a subset of the overall societal costs associated with breast cancer surgery. Societal costs would also include costs from the individual's (patient's) perspective (e.g., missed days of work, medical bills) as well as those of third-party payers.
No study is without limitations, and the present one is no exception. One limitation is that patients were not blind to group assignment. Unfortunately, blinding of the patients to group assignment in the present behavioral medicine protocol would have been impossible. Patients in the hypnosis intervention group must be aware and active participants in the hypnosis intervention itself. They are told explicitly that they are participating in a hypnosis intervention, that they will experience hypnotic suggestions, and that they will be able to respond to them. Providing the control group with a similar set of instructions would be tantamount to providing them with hypnosis. However, we recognize that there is a possibility that the lack of patient blinding could have created demand characteristics for patients that could have affected self-report outcomes. To reduce this possibility, interventionists collected no outcome data in this study and had no contact with patients outside of the intervention session itself, which occurred before surgery. There is also the possibility that demand characteristics may have influenced the amount of intraoperative medications used. Patients in the hypnosis condition may have suppressed their agitation while in surgery; thus, anesthesiologists could have used less lidocaine and propofol. However, this seems unlikely as such a scenario would involve a great deal of patient will and conscious behavioral control while in surgery. Furthermore, if the effect were due to demand characteristics, we would also have anticipated that we would have found between-group differences on postoperative analgesic use, but we did not. The possibility that demand characteristics affected procedure time seems even more unlikely given the large number of factors that a hypnosis patient would have to control to decrease surgical procedure time.
A second limitation of this study is that a formal assessment of the effectiveness of blinding of research or clinical staff was not conducted. However, as already noted, methodologic precautions were taken to make it unlikely that either research or clinical staff were aware of study group assignment. Future research should include a more formal blinding assessment.
The results of this study suggest at least five future research directions. First, it will be important to investigate the contributions of individual components of the intervention (e.g., relaxation, specific suggestions) to the beneficial effects of the intervention. Second, it will be of interest to determine the extent to which the beneficial effects reported here extend to longer term outcomes (e.g., pain 1 month following surgery). Third, future studies should confirm the results in other patient and demographic samples. Fourth, although the threshold and sensitivity analyses suggested that the intervention would continue to be cost effective under a variety of reasonable circumstances, future research should investigate these effects at other institutions. Fifth, psychologists may not be available at all institutions, and therefore, the clinical efficacy of more readily available personnel (e.g., anesthesiologists, nurses) needs to be empirically evaluated.
In conclusion, the present randomized controlled trial demonstrated that a brief presurgery hypnosis intervention reduces medication use, pain intensity, pain unpleasantness, nausea, fatigue, discomfort, and emotional upset in women undergoing breast cancer surgery. The results are strongly supportive of cost savings associated with this approach accruing to the institution. Together, the combination of potential improvements in symptom burden for the hundreds of thousands of women facing breast cancer surgery each year and the economic benefit for institutions argues persuasively for the more widespread application of brief presurgical hypnosis.
Funding
National Cancer Institute (CA105222, CA81137); American Cancer Society (CRTG 00-312, PF-05-098-01-CPPB); Department of Defense (DAMD17-99-1-9303).
References
We are required to indicate that the content of the information contained in this report does not necessarily reflect the position or policy of the Department of Defense. The funding agencies had no role in the design, data collection, or data analysis of the study or in the writing of this manuscript.

