


Abstract
Elevated oxidative stress (OxS), mitochondrial dysfunction, and hallmarks of aging are identified as key contributors to aging, but improving/reversing these defects in older adults (OA) is challenging. In prior studies, we identified that deficiency of the intracellular antioxidant glutathione (GSH) could play a role and reported that supplementing GlyNAC (combination of glycine and N-acetylcysteine [NAC]) in aged mice improved GSH deficiency, OxS, mitochondrial fatty-acid oxidation (MFO), and insulin resistance (IR). To test whether GlyNAC supplementation in OA could improve GSH deficiency, OxS, mitochondrial dysfunction, IR, physical function, and aging hallmarks, we conducted a placebo-controlled randomized clinical trial.
Twenty-four OA and 12 young adults (YA) were studied. OA was randomized to receive either GlyNAC (N = 12) or isonitrogenous alanine placebo (N = 12) for 16-weeks; YA (N = 12) received GlyNAC for 2-weeks. Participants were studied before, after 2-weeks, and after 16-weeks of supplementation to assess GSH concentrations, OxS, MFO, molecular regulators of energy metabolism, inflammation, endothelial function, IR, aging hallmarks, gait speed, muscle strength, 6-minute walk test, body composition, and blood pressure.
Compared to YA, OA had GSH deficiency, OxS, mitochondrial dysfunction (with defective molecular regulation), inflammation, endothelial dysfunction, IR, multiple aging hallmarks, impaired physical function, increased waist circumference, and systolic blood pressure. GlyNAC (and not placebo) supplementation in OA improved/corrected these defects.
GlyNAC supplementation in OA for 16-weeks was safe and well-tolerated. By combining the benefits of glycine, NAC and GSH, GlyNAC is an effective nutritional supplement that improves and reverses multiple age-associated abnormalities to promote health in aging humans.
Clinical Trials Registration Number: NCT01870193
The World Health Organization anticipates that the population of older adults (OA) will exceed 2.1 billion by 2050 (1). Aging is associated with declining muscle strength (2), inflammation (3), endothelial dysfunction (4), insulin resistance (IR) (5), and central obesity (6). This indicates an urgent need to investigate and understand mechanisms contributing to age-associated defects and to identify strategies to improve health during aging.
Elevated oxidative stress (OxS) and mitochondrial dysfunction were the first suggested contributors to aging (7,8). These defects are linked to many age-associated diseases and disorders (9–20). More recently, the field of Geroscience has identified nine “hallmarks of aging” which are believed to contribute to aging and age-associated comorbidities (21). The mechanistic origins of all these defects are not well understood, and no placebo-controlled randomized clinical trial (RCT) has successfully shown the reversal of multiple such age-associated defects in OA. Antioxidants protect mitochondria from OxS, and glutathione (GSH, γ-glutamylcysteinylglycine) is the most abundant, endogenous, intracellular antioxidant. Aging is associated with GSH deficiency and elevated OxS (22,23). We discovered that GSH deficiency in OA occurs due to impaired synthesis. Supplementing GlyNAC, a combination of GSH precursor amino acids glycine and cysteine (provided as N-acetylcysteine, NAC) for 2-weeks corrects GSH synthesis and concentrations. It also lowers OxS, and improves mitochondrial dysfunction and insulin resistance (IR) (17,23). Via rodent studies, we discovered that GSH adequacy is necessary for optimal mitochondrial fatty-acid oxidation (MFO), and that GlyNAC supplementation in old mice successfully corrects impaired GSH synthesis, reverses GSH deficiency, improves impaired MFO, and lowers IR, body fat and liver fat content (17). We conducted this RCT to study the effect of supplementing OA with GlyNAC versus placebo for 16-weeks on GSH concentrations, OxS, MFO, and also IR, inflammation, endothelial function, physical function, and body composition. Because the aging hallmarks were first reported after our RCT had started, they were added as exploratory outcomes after trial completion. This RCT is consistent with the recommended framework for proof-of-concept trials which target fundamental processes of aging (24).
Method
Study Design and Approvals
This double-blind, placebo-controlled RCT was approved by the Institutional Review Board at Baylor College of Medicine and registered with clinicaltrials.gov (NCT01870193).
Study Participants
Volunteers were screened and recruited by written informed consent to enroll 24 OA and 12 YA (young adults; Figure 1A). Inclusion criteria: OA: 61–80 years with body mass index (BMI) > 27; and YA 21–40 years. The BMI criteria were selected as rodent studies had shown weight-loss, and this was a safeguard against possible excess weight-loss in OA. Exclusion criteria: known diabetes (fasting plasma glucose ≥ 126 mg/dL, HbA1c ≥ 6.5%), untreated hypo/hyperthyroidism, untreated heart disease, active malignancy, Alanine transaminase/aspartate transaminase > 2× upper-limit of normal; serum creatinine > 1.5 mg/dL, fasting triglycerides > 500 mg/dL, difficulty walking, or pregnancy. All nonvitamin nutritional supplements (including amino acid, protein, or antioxidant supplements) and lipid-lowering medications were stopped from 4-weeks prior to laboratory tests until the end of the study to avoid any confounding effects on mitochondrial function. Participants were asked to avoid acetaminophen and alcohol for the duration of the trial.
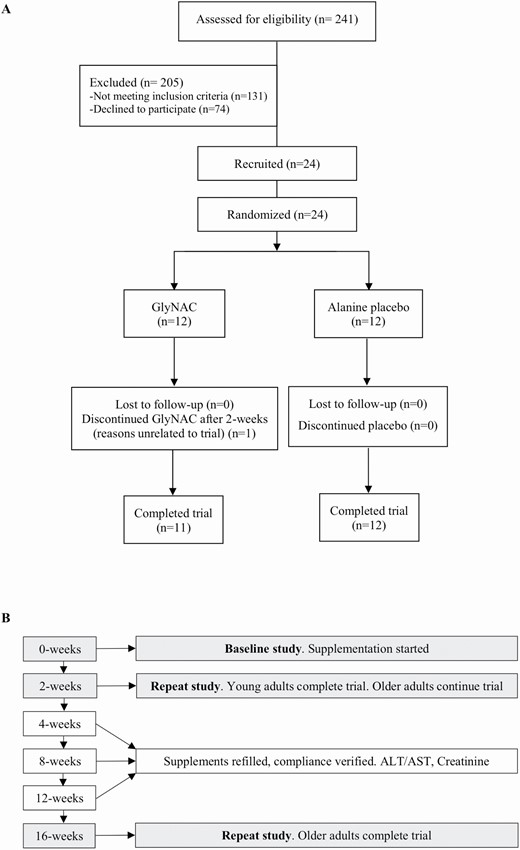
(A) Clinical trial CONSORT flow diagram; (B) flow chart of study design.
Study Protocol
Trial participants were screened with fasting blood draws (plasma lipids, liver profile, BUN, Creatinine, TSH, free T4, glucose, HbA1c, and complete blood counts; Figure 1B). Qualifying participants were randomized to receive active (GlyNAC) or placebo (alanine) for 16-weeks. YA received GlyNAC for 2-weeks. Participants were studied at Baylor College of Medicine and underwent: (a) baseline studies of glucose tolerance test, physical function tests (gait speed, upper and lower extremity strength, and rapid 6-minute walk test to assess exercise capacity), DEXA and liver scans, calorimetry, tracer studies (palmitate and acetate), and muscle biopsy. Urine was collected during the study. Participants were provided their assigned supplements and (b) studies repeated 2-weeks after starting supplements. YA were released after 2-weeks, but OA continued supplementation (c). OA returned after 4-, 8-, and 12-weeks to measure liver transaminases and creatinine, assess adherence, and replenish supplements; (d) OA underwent a final study after 16-weeks of supplementation.
Supplement Details
Glycine and N-acetylcysteine and alanine were purchased commercially, and quality verified via certificates of analyses. These supplements are filled into capsules by a pharmacist, and provided monthly to study participants at doses of 100 mg/kg/d each of glycine and NAC, and 200 mg/kg/d of alanine. The participants and the study team were blinded to the identity of the capsules, which were of the same size, shape, color, and taste. Supplement randomization was done using a computerized program provided by the statistician. Compliance with supplementation was assessed with intermittent phone calls, verification at monthly visits and by capsule-counting.
Outcome Measures
The investigators were blinded to supplement identity while analyzing outcome measures.
Glutathione concentrations and oxidative stress
Skeletal-muscle GSH concentrations, and red blood cell (RBC) total and reduced GSH were measured as reported by us previously (25). OxS and oxidant damage were measured by ELISA assays as plasma concentrations thiobarbituric acid reducing substances (TBARS; Cayman Chemicals, Ann Arbor, MI), and 8-Iso-Prostaglandin-F2a (Cell Biolabs In., San Diego, CA).
Mitochondrial function
This was measured as indirect calorimetry, tracer studies, and Western blotting of muscle mitochondrial proteins as reported by us previously (25,26).
Physical function
This was assessed as gait speed, chair-rise test (for lower extremity strength), grip strength (for upper extremity strength in the dominant and nondominant hands), and rapid 6-minute walk test (for exercise capacity), as reported by us previously (25).
Insulin resistance
Fasted plasma glucose concentrations were measured with an automated glucose analyzer (YSI, Yellow Springs, OH), and insulin concentrations measured using a highly-specific radioimmunoassay for human insulin (Linco Research, St. Charles, MO). Insulin resistance was calculated as homeostatic model assessment for insulin resistance (HOMA-IR) (25).
Biomarkers of inflammation, endothelial function, and genotoxicity
These outcomes were measured using a high-sensitivity Interleukin-6 (IL-6), tumor necrosis factor alpha (TNFα), Interleukin-10 (IL-10), human soluble intercellular adhesion molecule 1 (sICAM1), and soluble vascular cell adhesion molecule 1 (sVCAM1) ELISA kits (Invitrogen, Thermo-Scientific Inc., Waltham, MA), and high-sensitivity human C-reactive protein Quantikine ELISA kit (R&D Systems, Minneapolis, MN, USA). DNA/RNA oxidative damage was measured with a high-sensitivity 8-hydroxy-2-deoxyguanosine ELISA Kit (Cayman Chemicals, Ann Arbor, MI, USA).
Body composition, anthropometry, blood pressure
Total-body fat and lean mass were measured by DEXA scans at baseline, 2-, and 16-weeks. Liver fat was measured by magnetic resonance spectroscopy (MRS) at baseline and at 16-weeks as previously reported (25). Height and weight measured using a stadiometer and calibrated weighing scale respectively were used to calculate body mass index. Waist circumference was measured using a tape measure. The same sites were used for repeat measurements. Blood pressure was measured using a sphygmomanometer.
Plasma biochemistry
Fasted plasma concentrations of liver profile, lipid profile, Creatinine, BUN, HbA1c, cortisol, Free T4, and TSH were measured by the Clinical Pathology Labs.
Protein isolation and immunoblot analyses
Standard techniques were used (25) to process and analyze serial skeletal muscle biopsies from YA, OAG (OA receiving GlyNAC), and OAP (OA receiving placebo). Three sets were done for each blot, with one participant from each group of YA, OAG, and OAP per set, such that samples from the same participant was used for measures before and after supplementation (shown as YA-0w, YA-2w; OAG-0w, OAG-2w, OAG-16w; OAP-0w, OAP-2w, OAP-16w in Figure 2A; and average of all 3 sets for each blot is shown in Figure 2B).
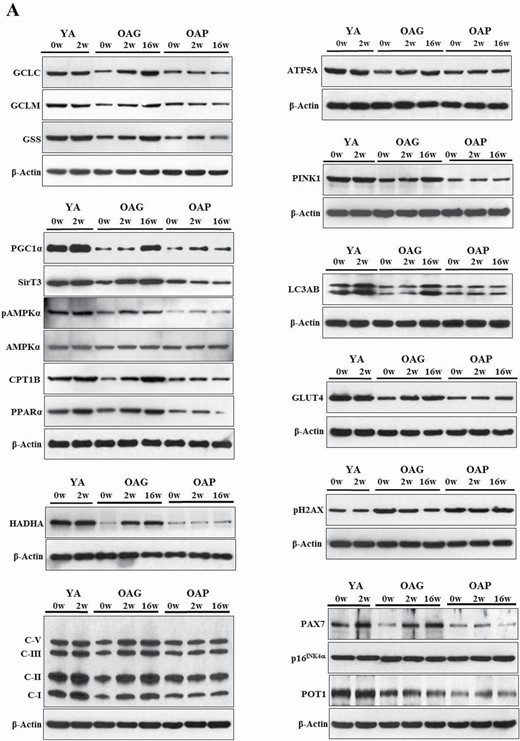
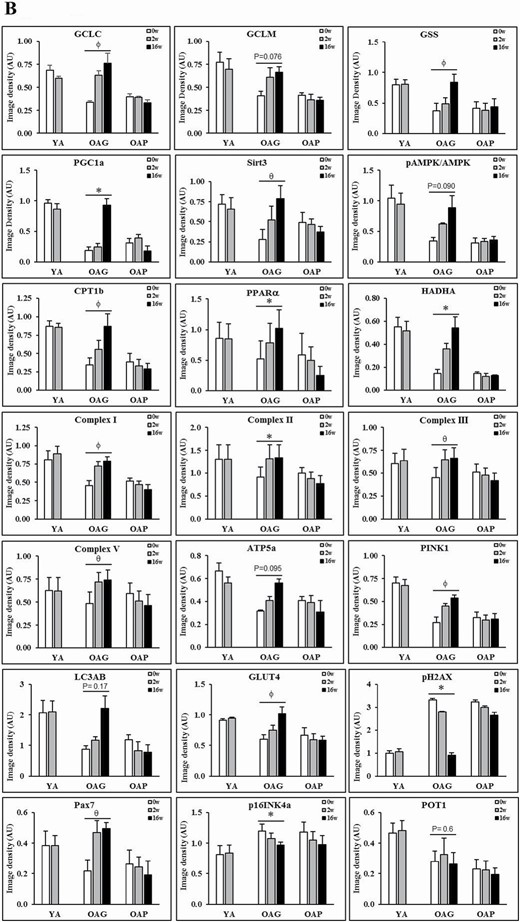
(A) Western blots for protein expression; each blot represents serial biopsies one participant from YA (0w, 2w), the OAG (0w, 2w, 16w), and OAP (0w, 2w, 16w). GCLC and GCLM = Glutamate cysteine ligase catalytic and modifier subunits; GSS = Glutathione synthetase; PGC1α = PPARG coactivator 1-alpha; SirT3 = Sirtuin 3; pAMPKα = phosphorylated AMP-activated protein kinase α subunit; AMPKα = total AMP-activated protein kinase α subunit; CPT1B = Carnitine palmitoyltransferase 1B; PPARα = Peroxisome proliferator-activated receptor α; HADHA = hydroxyacyl-CoA dehydrogenase trifunctional multienzyme complex subunit α; C-I, II, III, V = mitochondrial complexes I, II, II, V; ATP5A = mitochondrial ATP synthase F1 subunit alpha; PINK1 = PTEN-induced kinase 1; LC3AB = Microtuble-associated protein light chain 3 A and B; GLUT4 = Glucose transporter type 4; pH2AX = phospho-H2A histone family member X; PAX7 = Paired box protein 7; p16INK4α = p16; POT1 = Protection of telomeres protein 1. Additional details are in methods section. (B) Quantification of Immunoblots from 3 participants per group of YA, OAP and OAG. The figure shows average optical densities of protein expression from each group normalized to the loading control (β-actin). * = p < .05; ϕ = p < .01; θ = p < .001. GlyNAC = combination of glycine and N-acetylcysteine; YA = young adults; OAG = older adults receiving GlyNAC; OAP = older adults receiving placebo.
Health-related quality of life (HRQoL)
Health-related quality of life was assessed as reported by us previously (27).
Statistical Analysis
A general linear mixed model estimated mean response with 95% confidence intervals (CI). A separate model was fit for each outcome measure. Models for all outcomes except glucose tolerance tests included fixed effects for cohort (YA, OAP, and OAG), study time (0-, 2-, and 16-weeks), and cohort-time interaction term. Time assumed nominal categories for the regression analysis. The matrix of correlated residuals assumed an unstructured format and degrees of freedom estimated using the Kenward–Roger method. The multiple regression models estimated the mean (95% CI) response by cohort and time. Regression models used the least-squares method to test specified sets of hypotheses for each outcome. p Values were adjusted for multiple comparisons within each measure using the Holm’s step-down Bonferroni correction method. Measures of physical function, body composition, blood pressure, and lipids were compared between 3 cohorts at baseline, change in response at 16-weeks versus baseline among OAP and OAG, 16-week OAP/OAG versus YA at baseline, and OAP versus OAG at 16-weeks (8 tests per measure). Biochemistry and calorimetry measures were compared between 3 cohorts at baseline, change in response at 2- and 16-weeks versus baseline among OAP and OAG, and 16-week OAP/OAG versus YA at baseline. Cortisol and HbA1c were only measured at baseline. Molecular outcomes compared OAG and OAP with YA at baseline and change in response at 16-weeks versus baseline for OAP and OAG. Safety labs compared responses at 2-, 4-, 8-, 12-, and 16-weeks versus baseline within cohort. Glucose tolerance tests were analyzed using a general linear mixed model. Fixed effects included cohort, study time (0-, 2-, and 16-weeks), observation time (0, 30, 60, 90, and 120 minutes), and all pairwise interaction terms plus the 3-way interaction term (cohort × study time × observation time). Study time and observation time points assumed nominal categories. The matrix of correlated residuals assumed a doubly repeated, unstructured format. Mean (95% CI) responses were estimated for each cohort-study week-observation time combination. p Values were adjusted for multiple comparisons using Holm’s step-down Bonferroni correction. Model assumptions were assessed for each outcome measured by residual quantile–quantile plots and plots of residuals versus predicted values. No substantial departures from model assumptions were noted.
Results
Participant Details
YA (7 men, 5 women) were 25.6 ± 2.5 years of age, OAG (8 men, 4 women) were 71.4 ± 4.2 years, and OAP (4 men, 8 women) were 70.8 ± 3.9 years. Recruitment details are provided in Figure 1A.
Glutathione and Oxidative stress
Muscle-GSH
Compared to YA, OAG-0w, and OAP-0w each had 66% lower muscle GSH concentrations (Table 1). Western blots showed decreased expression of enzymes of GSH synthesis (catalytic subunit of glutamate cysteine ligase [GCLC], modifier subunit of GCL [GCLM], and glutathione synthetase [GSS]) indicating impaired GSH synthesis as a cause for GSH deficiency. Only GlyNAC supplementation in OA resulted in significantly improved (a) GSH concentrations by 121% after 2-weeks, and by 164% after 16-weeks to levels not different from YA-0w (Supplementary Figure S1), and (b) muscle GCLC and GSS expression (with a trend toward improvement for GCLM; Figure 2A and B). No improvement was seen in OAP or YAG (YA post-GlyNAC supplementation).
Glutathione, Oxidative Stress, and Mitochondrial Function
| Outcome Measure | YAG-0w (N = 11) | YAG-2w (N = 11) | OAG-0w YA-0w vs OAG-0w (N = 12) | OAG-2w (N = 12) | OAG-16w OAG-0w vs OAG-16w; OAG-16w vs YA-0w (N = 11) | OAP-0w YA-0w vs OAP-0w; OAP-0w vs OAG-0w (N = 12) | OAP-2w (N = 12) | OAP-16w OAP-0w vs OAP-16w (N = 12) |
|---|---|---|---|---|---|---|---|---|
| Glutathione and oxidative stress | ||||||||
| Muscle-glutathione (mmol/kg muscle) | 7.0 ± 1.3 | 7.0 ± 1.3 | 2.4 ± 0.6 p < .001 | 5.3 ± 0.9 p < .001 | 6.3 ± 1.2 p < .001 p = .32 | 2.4 ± 0.8 p < .001 p > .99 | 2.3 ± 0.8 p > .99 | 2.4 ± 0.8 p > .99 |
| RBC-total glutathione (tGSH; mmol/L.RBC) | 1.4 ± 0.2 | 1.5 ± 0.2 | 0.4 ± 0.1 p < .001 | 1.2 ± 0.1 p < .001 | 1.4 ± 0.1 p < .001 p = .84 | 0.5 ± 0.1 p < .001 p = .84 | 0.5 ± 0.1 p = .96 | 0.5 ± 0.1 p = .96 |
| RBC-reduced glutathione (rGSH; mmol/L.RBC) | 1.4 ± 0.2 | 1.4 ± 0.2 | 0.4 ± 0.1 p < .001 | 1.1 ± 0.1 p < .001 | 1.3 ± 0.1 p < .001 p = .86 | 0.4 ± 0.1 p < .001 p = .86 | 0.5 ± 0.1 p = .86 | 0.4 ± 0.1 p = .86 |
| RBC-oxidized glutathione (GSSG; mmol/L.RBC) | 0.1 ± 0.1 | 0.1 ± 0.0 | 0.1 ± 0.0 p > .99 | 0.1 ± 0.0 p = .45 | 0.1 ± 0.1 p > .99 p > .99 | 0.1 ± 0.0 p > .99 p > .99 | 0.1 ± 0.0 p > .99 | 0.1 ± 0.0 p > .99 |
| RBC-GSH/GSSG | 24.6 ± 14.7 | 25.2 ± 16.3 | 7.5 ± 4.8 p = .001 | 14.7 ± 7.6 p = .38 | 27.6 ± 18.2 p < .001 p > .99 | 9.0 ± 6.7 p = .003 p > .99 | 9.6 ± 5.4 p > .99 | 9.5 ± 5.3 p > .99 |
| Plasma TBARS (μM/L) | 4.2 ± 1.0 | 4.1 ± 0.8 | 22.1 ± 3.3 p < .001 | 12.7 ± 3.3 p < .001 | 6.2 ± 1.9 p < .001 p = .28 | 21.9 ± 3.6 p < .001 p = .90 | 21.4 ± 2.3 p = .88 | 22.9 ± 3.5 p = .74 |
| Plasma F2-isoprostane (pg/mL) | 53.9 ± 2.9 | 53.0 ± 2.9 | 216.0 ± 26.9 p < .001 | 119.9 ± 37.6 p < .001 | 59.7 ± 4.0 p < .001 p > .99 | 215.8 ± 19.4 p < .001 p > .99 | 214.2 ± 13.6 p > .99 | 219.8 ± 13.9 p > .99 |
| Mitochondrial function | ||||||||
| Fasting respiratory quotient (RQ) | 0.79 ± 0.01 | 0.78 ± 0.02 | 0.85 ± 0.03 p < .001 | 0.82 ± 0.03 p < .001 | 0.77 ± 0.02 p < .001 p = .27 | 0.84 ± 0.02 p < .001 p = .27 | 0.84 ± 0.03 p > .99 | 0.84 ± 0.03 p > .99 |
| Fasting mitochondrial fatty-acid oxidation (mg/kgLM/min) | 1.2 ± 0.2 | 1.2 ± 0.2 | 0.7 ± 0.3 p < .001 | 0.9 ± 0.3 p < .001 | 1.2 ± 0.2 p < .001 p > .99 | 0.8 ± 0.2 p < .001 p = .47 | 0.8 ± 0.2 p > .99 | 0.8 ± 0.2 p > .99 |
| Fasting mitochondrial glucose oxidation (mg/kgLM/min) | 0.9 ± 0.6 | 0.9 ± 0.4 | 2.2 ± 0.7 p < .001 | 1.5 ± 0.6 p < .001 | 0.8 ± 0.3 p < .001 p > .99 | 2.0 ± 0.5 p = .001 p > .99 | 2.1 ± 0.6 p > .99 | 2.1 ± 0.8 p > .99 |
| Rate of palmitate oxidation (μmol/kgLM/min) | 146.8 ± 25.5 | 151.6 ± 19.2 | 119.0 ± 11.9 p = .003 | 139.7 ± 24.3 p = .007 | 157.1 ± 31.7 p < .001 p = .65 | 122.9 ± 10.6 p = .010 p > .99 | 125.0 ± 12.5 p > .99 | 121.8 ± 9.9 p > .99 |
| Rate of acetate oxidation (μmol/kgLM/min) | 227.4 ± 42.8 | 228.4 ± 40.6 | 258.4 ± 40.3 p > .99 | 254.8 ± 52.8 p > .99 | 249.9 ± 44.5 p > .99 p > .99 | 259.2 ± 72.4 p > .99 p > .99 | 258.3 ± 43.5 p > .99 | 259.4 ± 51.7 p > .99 |
| Energy expenditure (kcal/d) | 1 348 ± 246 | 1 363 ± 269 | 1 516 ± 223 p = .75 | 1 420 ± 191 p = .28 | 1 438 ± 214 p > .99 p > .99 | 1 384 ± 258 p > .99 p > .99 | 1 434 ± 233 p > .99 | 1 365 ± 279 p > .99 p > .99 |
Notes: Data are summarized by means with standard deviations. Baseline comparisons are shown between YA-0w vs OAG-0w, YA-0w vs OAP-0w, and OAG-0w vs OAP-0w. Postsupplement comparisons are shown as OAG-0w vs OAG-16w, OAP-0w vs OAP-16w. p Values are significant at values < .05. GlyNAC = combination of glycine and N-acetylcysteine; YAG = young adults supplemented with GlyNAC; YA = young adults; OAG = older adults receiving GlyNAC; OAP = older adults receiving placebo; RBC = red blood cell; TBARS = Thiobarbituric acid reducing substances.
Red blood cell (RBC) GSH
Compared to YA, OA had lower baseline concentrations of total RBC-GSH (tGSH, 70% lower in OAG-0w, and 66% lower in OAP-0w) and reduced RBC-GSH (rGSH, 73% lower in OAG-0w, and 68% lower in OAP-0w; Table 1). Only GlyNAC supplementation in OA significantly improved tGSH (by 173% after 2-weeks and 225% after 16-weeks) and rGSH (by 195% after 2-weeks and 259% after 16-weeks). Oxidized glutathione (GSSG) levels in OA were not different than YA and were unchanged by GlyNAC or placebo. The GSH/GSSG ratio for both OAG-0w and OAP-0w were significantly lower than YA-0w, and improved only in OAG-16w. No improvements were seen in OAP or YAG.
Oxidative stress
Compared to YA, plasma TBARS concentrations were 424% higher in OAG-0w and 421% higher in OAP-0w. Plasma F2-I concentrations were 301% higher in OAG-0w and 300% higher in OAP-0w. Only GlyNAC supplementation in OA significantly lowered these markers after 2-weeks (TBARS 42% lower; F2-I 44% lower) and 16-weeks (TBARS 72% lower; F2-I 72% lower) to levels not different from YA-0w (Table 1; Supplementary Figure S1). No improvements were seen in OAP or YAG.
Physical Function
OA at baseline had a lower gait speed and 6-minute walking distance compared to YA. Only GlyNAC supplementation increased gait speed in OAG-16w to levels not different from YA-0w, increased upper and lower extremity muscle strength, with a trend toward increasing 6-minute walk distance (Table 2; Supplementary Figure S1). No improvements were seen in OAP or YAG.
Physical Function, Body Composition, and Blood Pressure
| Outcome Measure | YAG-0w (N = 11) | YAG-2w (N = 11) | OAG-0w YA-0w vs OAG-0w (N = 12) | OAG-2w (N = 12) | OAG-16w OAG-0w vs OAG-16w; OAG-16w vs YA-0w (N = 11) | OAP-0w YA-0w vs OAP-0w; OAP-0w vs OAG-0w (N = 12) | OAP-2w (N = 12) | OAP-16w OAP-0w vs OAP-16w; OAP-16w vs YA-0w (N = 12) |
|---|---|---|---|---|---|---|---|---|
| Physical function | ||||||||
| Gait speed (m/sec) | 1.36 ± 0.14 | 1.42 ± 0.11 | 1.13 ± 0.19 p = .031 | 1.32 ± 0.36 | 1.34 ± 0.28 p = .032 p > .99 | 1.11 ± 0.19 p = .019 p > .99 | 1.17 ± 0.22 | 1.16 ± 0.21 p > .99 p = .11 |
| Grip strength, dominant hand (kg) | 34.8 ± 10.7 | 35.1 ± 12.1 | 32.3 ± 10.0 p > .99 | 34.2 ± 10.1 | 36.7 ± 10.6 p = .004 p > .99 | 31.4 ± 9.8 p > .99 p > .99 | 30.8 ± 12.7 | 29.3 ± 10.9 p = .14 p > .99 |
| Grip strength, nondominant hand (kg) | 31.7 ± 10.5 | 32.5 ± 12.0 | 29.6 ± 9.2 p > .99 | 30.7 ± 10.5 | 33.9 ± 10.5 p = .004 p > .99 | 30.7 ± 10.6 p > .99 p > .99 | 30.1 ± 11.7 | 27.8 ± 11.7 p = .009 p > .99 |
| Chair-rise test (sec) | 16.5 ± 1.8 | 15.4 ± 1.9 | 25.6 ± 8.9 p = .005 | 21.8 ± 5.2 | 18.8 ± 6.6 p = .002 p = .86 | 22.6 ± 4.0 p = .10 p = .86 | 22.1 ± 3.2 | 20.7 ± 3.8 p = .86 p = .31 |
| Six-minute rapid walk test (m) | 635.4 ± 71.6 | 645.6 ± 78.7 | 522.5 ± 62.5 p < .001 | 534.8 ± 70.1 | 564.8 ± 68.9 p = .053 p = .039 | 518.3 ± 52.9 p < .001 p = .99 | 532.3 ± 67.1 | 527.1 ± 66.0 p = .99 p = .003 |
| Body composition | ||||||||
| Weight (kg) | 69.3 ± 10.9 | 69.1 ± 10.6 | 89.5 ± 14.8 p = .005 | 88.4 ± 13.8 | 87.4 ± 14.2 p = .063 p = .007 | 84.5 ± 12.2 p = .037 p > .99 | 84.5 ± 12.2 | 84.6 ± 11.5 p > .99 p = .034 |
| Body mass index | 23.8 ± 2.9 | 23.8 ± 2.9 | 31.5 ± 4.0 p < .001 | 31.1 ± 3.7 | 30.9 ± 3.8 p = .09 p < .001 | 31.0 ± 2.2 p < .001 p > .99 | 31.0 ± 2.1 | 31.1 ± 2.4 p > .99 p < .001 |
| Fat mass (kg) | 16.0 ± 5.5 | 15.7 ± 5.3 | 29.9 ± 8.1 p < .001 | 29.5 ± 8.1 | 27.8 ± 7.0 p > .99 p < .001 | 31.2 ± 7.2 p < .001 p > .99 | 31.2 ± 7.4 | 31.2 ± 8.1 p > .99 p < .001 |
| Waist circumference (m) | 0.91 ± 0.04 | 0.91 ± 0.04 | 1.06 ± 0.09 p < .001 | 1.04 ± 0.08 | 1.03 ± 0.09 p = .002 p = .003 | 1.02 ± 0.07 p = .009 p = .33 | 1.01 ± 0.06 | 1.01 ± 0.08 p = .43 p = .018 |
| Lean mass (kg) | 50.8 ± 11.6 | 51.0 ± 11.5 | 57.2 ± 10.2 p > .99 | 56.8 ± 10.0 | 57.6 ± 10.8 p > .99 p > .99 | 51.2 ± 13.0 p > .99 p > .99 | 51.0 ± 13.4 | 51.1 ± 12.8 p > .99 p > .99 |
| Blood pressure | ||||||||
| Systolic blood pressure (mmHg) | 110.8 ± 7.9 | 107.4 ± 11.7 | 132.0 ± 16.8 p = .01 | 131.4 ± 19.5 | 124.4 ± 17.0 p = .043 p = .18 | 129.5 ± 16.0 p = .026 p > .99 | 127.8 ± 14.3 | 127.6 ± 14.3 p > .99 p = .043 |
| Diastolic blood pressure (mmHg) | 70.0 ± 5.2 | 67.0 ± 3.5 | 79.2 ± 6.0 p = .01 | 76.1 ± 5.6 | 75.9 ± 8.6 p = .61 p = .32 | 78.1 ± 7.2 p = .027 p > .99 | 76.7 ± 9.6 | 75.8 ± 8.1 p = .91 p = .32 |
Notes: Data are summarized by means with standard deviations. Baseline comparisons are shown between YA-0w vs OAG-0w, YA-0w vs OAP-0w and OAG-0w vs OAP-0w. Postsupplement comparisons are shown as OAG- 0w vs OAG-16w, OAP-0w vs OAP-16w, and as OAG-16w vs YA-0w and OAP-16w vs YA-0w. p Values compare means estimated by the general linear mixed regression model. p Values are significant at values < .05. GlyNAC = combination of glycine and N-acetylcysteine; YAG = young adults supplemented with GlyNAC; YA = young adults; OAG = older adults receiving GlyNAC; OAP = older adults receiving placebo.
Hallmarks of Aging
Mitochondrial dysfunction
OA at baseline had significantly higher respiratory quotients (RQ), lower MFO (42% lower in OAG-0w; 33% lower in OAP-0w), and higher mitochondrial glucose oxidation (MGO 144% higher in OAG-0w; 122% higher in OAP-0w; Supplementary Figure S2). Only GlyNAC supplementation in OA improved RQ, MFO, and MGO after 2-weeks (RQ 4% lower; MFO 29% higher; and MGO 32% lower) and 16-weeks (RQ 9% lower; MFO 78% higher; and MGO 65% lower) to values not different from YA-0w. Plasma palmitate tracer oxidation improved significantly in OAG, but acetate tracer oxidation did not differ between YA and OA before or after supplementation (Table 1; Supplementary Figure S1). No improvements were seen in OAP or YAG.
Molecular regulation of mitochondrial function
OAG-16w had significantly improved muscle expression of mitochondrial regulators of biogenesis and energy metabolism (peroxisome proliferator-activated receptor gamma coactivator 1-alpha [PGC1α], PPARα), cellular FA entry (CPT1b), enzymes of β-oxidation of FA (HADHA), electron complexes (I, II, III, V), ATP synthesis (ATP5A), and mitophagy (PINK1; Figure 2A and B). No improvements were seen in OAP or YAG.
Altered intercellular communication
Compared to YA, OA had higher plasma concentrations of proinflammatory cytokines before supplementation (OAG-0w: IL-6 820%, TNFα 209%, hsCRP 100%; OAP-0w IL-6 720%, TNFα 208%, hsCRP 96% higher), and lower concentrations of the anti-inflammatory cytokine IL-10 (OAG-0w 54%, OAP-0w 49%). Only GlyNAC supplementation resulted in improvements after 2-weeks (lowered IL-6 57%, TNFα 30%, hsCRP 25%) and after 16-weeks (lowered IL-6 78%, TNFα 54%, hsCRP 41%); and increased IL-10 after 2-weeks (by 50%) and 16-weeks (by 94%; Table 3; Supplementary Figure S1). No improvements were seen in OAP or YAG.
Mitochondrial Function, Inflammation, Endothelial Function, Glycemic Indeces, and Genomic Damage
| Outcome Measure | YAG-0w (N = 11) | YAG-2w (N = 11) | OAG-0w YA-0w vs OAG-0w (N = 12) | OAG-2w (N = 12) | OAG-16w OAG-0w vs OAG-16w; OAG-16w vs YA-0w (N = 11) | OAP-0w YA-0w vs OAP-0w; OAP-0w vs OAG-0w (N = 12) | OAP-2w (N = 12) | OAP-16w OAP-0w vs OAP-16w (N = 12) |
|---|---|---|---|---|---|---|---|---|
| Plasma inflammatory cytokines | ||||||||
| High-sensitivity interleukin-6 (IL-6, pg/mL) | 0.5 ± 0.1 | 0.5 ± 0.1 | 4.6 ± 1.4 p < .001 | 2.0 ± 0.5 p < .001 | 1.0 ± 0.3 p < .001 p > .99 | 4.1 ± 1.6 p < .001 p > .99 | 4.0 ± 1.5 p > .99 | 4.2 ± 1.5 p > .99 |
| Tumor necrosis factor alpha (TNFα, pg/mL) | 33.3 ± 6.3 | 32.4 ± 8.4 | 103.4 ± 14.7 p < .001 | 72.8 ± 10.4 p < .001 | 47.1 ± 11.3 p < .001 p = .018 | 102.4 ± 12.8 p < .001 p = .84 | 98.7 ± 9.4 p = .23 | 107.8 ± 12.1 p = .09 |
| High-sensitivity C-reactive protein (CRP, ng/mL) | 2.2 ± 0.5 | 2.0 ± 0.4 | 4.4 ± 0.5 p < .001 | 3.3 ± 0.4 p < .001 | 2.6 ± 0.4 p < .001 p = .47 | 4.3 ± 0.6 p < .001 p > .99 | 4.3 ± 0.6 p > .99 | 4.5 ± 0.6 p = .16 |
| Interleukin-10 (IL-10, pg/mL) | 3.9 ± 0.7 | 4.1 ± 0.5 | 1.8 ± 0.6 p < .001 | 2.7 ± 0.6 p < .001 | 3.5 ± 0.6 p < .001 p = .67 | 2.0 ± 0.6 p < .001 p > .99 | 2.1 ± 0.6 p > .99 | 1.9 ± 0.6 p > .99 |
| Plasma markers of endothelial function | ||||||||
| Soluble intercellular adhesion molecule-1 (sICAM1, ng/mL) | 255.5 ± 125.9 | 261.8 ± 111.4 | 948.3 ± 171.8 p < .001 | 692.4 ± 153.6 p < .001 | 407.8 ± 147.3 p < .001 p = .102 | 885.3 ± 147.9 p < .001 p = .88 | 909.5 ± 158.0 p = .88 | 903.6 ± 155.0 p = .88 |
| Soluble vascular cell adhesion molecule-1 (sVCAM1, ng/mL) | 463.0 ± 136.5 | 466.8 ± 114.8 | 1 037.6 ± 261.8 p < .001 | 814.9 ± 212.0 p < .001 | 582.1 ± 144.1 p < .001 p = .68 | 1 000.0 ± 208.2 p < .001 p > .99 | 1 005.4 ± 214.3 p > .99 | 1 023.9 ± 212.2 p > .99 |
| Glycemic parameters | ||||||||
| Insulin resistance (HOMA-IR) | 2.4 ± 0.5 | 2.3 ± 0.4 | 10.8 ± 2.5 p < .001 | 7.4 ± 1.8 p < .001 | 3.9 ± 1.1 p < .001 p = .28 | 11.1 ± 2.5 p < .001 p = .72 | 10.7 ± 2.7 p = .61 | 11.6 ± 3.5 p = .61 |
| Glucose (mmol/L) | 4.8 ± 0.4 | 4.8 ± 0.5 | 5.6 ± 0.7 p = .018 | 5.7 ± 0.5 p = .51 | 5.6 ± 0.6 p > .99 p = .013 | 5.4 ± 0.5 p = .10 p > .99 | 5.3 ± 0.5 p > .99 | 5.5 ± 0.6 p > .99 |
| Insulin (mU/L) | 11.3 ± 2.6 | 10.8 ± 1.9 | 44.5 ± 11.8 p < .001 | 29.4 ± 7.8 p < .001 | 15.8 ± 4.8 p < .001 p = .57 | 46.6 ± 10.7 p < .001 p > .99 | 45.1 ± 10.1 p = .86 | 47.5 ± 12.5 p > .99 |
| Area under the curve (oral glucose tolerance test) | 66.6 ± 37.1 | 54.9 ± 26.6 | 117.3 ± 57.5 p = .18 | 109.3 ± 49.3 | 102.9 ± 47.9 p = .21 p = .54 | 118.9 ± 61.7 p = .18 p = .94 | 119.6 ± 58.2 | 127.8 ± 60.9 p = .54 |
| Genomic damage | ||||||||
| 8-hydroxy deoxy guanosine (8-OHdG, pg/mL) | 36.5 ± 10.5 | 31.8 ± 8.2 | 158.0 ± 54.8 p < .001 | 67.3 ± 20.3 p < .001 | 42.6 ± 11.8 p < .001 p > .99 | 154.9 ± 38.7 p < .001 p > .99 | 145.6 ± 33.4 p > .99 | 157.0 ± 55.2 p > .99 |
Notes: Data are summarized by means with standard deviations. p Values are significant at values < .05. GlyNAC = combination of glycine and N-acetylcysteine; YAG = young adults supplemented with GlyNAC; YA = young adults; OAG = older adults receiving GlyNAC; OAP = older adults receiving placebo.
Dysregulated nutrient sensing
OA-0w had significantly higher IR and fasting plasma insulin concentrations. GlyNAC supplementation in OA significantly lowered IR and fasting insulin concentrations after 2-weeks (HOMA-IR 31%; fasting insulin 34%), and after 16-weeks (HOMA-IR 64%; fasting insulin 65%) to values not different from YA-0w (Table 3). No changes occurred in fasting glucose concentrations or glucose tolerance tests. GlyNAC supplementation for 16-weeks in OA significantly increased muscle glucose transporter 4 (GLUT4) and Sirtuin 3 (SirT3) expression. The ratio of muscle phosphorylated AMPK (pAMPK)/AMPK in OA-0w was significantly lower than YA-0w, and trended toward improvement only in OAG-16w (Figure 2A and B). No improvements were seen in OAP or YAG.
Genomic damage
OA-0w had elevated levels of plasma 8-hydroxy-2-deoxyguanosine (8-OHdG) concentrations and muscle pH2AX, indicating elevated DNA damage. Only GlyNAC supplementation in OA lowered plasma 8-OHdG by 57% after 2-weeks, and by 73% after 16-weeks (Table 3), and significantly lowered muscle pH2AX after 16-weeks (Figure 2A and B). No improvements were seen in OAP or YAG.
Loss of proteostasis
OA-0w had lower expression of muscle PINK1, indicating impaired mitophagy. Only GlyNAC supplementation in OA significantly improved mitophagy in OAG-16w, together with a nonsignificant improvement in autophagy (LC3AB expression; Figure 2A and B). No improvements were seen in OAP or YAG.
Stem-cell exhaustion
Only GlyNAC supplementation increased Pax7 expression in OAG-16w, suggesting regeneration of muscle satellite/stem cells (Figure 2A and B). No improvements were seen in OAP or YAG.
Cellular senescence
Only GlyNAC supplementation lowered muscle p16INK4α expression in OAG-16w (Figure 2A and B), indicating a senolytic effect. No improvements were seen in OAP or YAG.
Telomere health
Muscle POT1 expression was lower in OA, and unaffected by GlyNAC or placebo (Figure 2A and B).
Endothelial Function
OA-0w at baseline had increased plasma concentrations of sICAM1 (OAG-0w 271% higher; OAP-0w 246% higher) and sVCAM1 (OAG-0w 124% higher; OAP-0w 116% higher). Only GlyNAC supplementation improved these markers after 2-weeks (sICAM1 27% lower; sVCAM1 21% lower), and after 16-weeks (sICAM1 57% lower; sVCAM1 44% lower) to values not different from YA-0w. No improvements were seen in OAP or YAG. (Table 3; Supplementary Figure S1)
Body Composition
OA-0w had significantly higher body weight, BMI, fat mass, and waist circumference. GlyNAC supplementation for 16-weeks decreased waist circumference, and a trend toward decreasing both body weight and BMI (Table 2). No changes were seen in OAP or YAG. Liver fat measurements were below the detectable limit by MRS imaging, and not clinically meaningful.
Blood Pressure
GlyNAC supplementation significantly lowered systolic blood pressure (SBP) but not diastolic BP in OAG-16w (Table 2; Supplementary Figure S1). No improvements were seen in OAP or YAG.
HRQoL
Presupplementation HRQoL was similar in OAG and OAP groups, and unaffected by GlyNAC or placebo.
Plasma Biochemistry
At trial entry, all participants had normal screening lab tests. Triglyceride concentrations decreased by 16% with a trend toward improvement only in OAG-16w (Supplementary Table S1).
Monitoring and Adverse Effects
Plasma creatinine, alanine, and aspartate transaminases monitored at 2-, 4-, 8-, 12-, and 16-weeks (Figure 1B) did not show any increase compared to baseline values (Table 4). Participants did not report any adverse events related to the use of supplements (GlyNAC or placebo) during the trial.
Monitored Blood Labs
| 0w | 2w | 4w | 8w | 12w | 16w | |
|---|---|---|---|---|---|---|
| Alanine transaminase (ALT; U/L) | ||||||
| YAG | 17.1 ± 5.8 | 16.5 ± 5.9 | - | - | - | - |
| (N = 11) | p > .99 | |||||
| OAG (N = 12 for 0w, | 24.6 ± 9.6 | 25.1 ± 10.2 | 25.5 ± 11.4 | 23.2 ± 13.8 | 24.9 ± 18.6 | 25.2 ± 19.3 |
| 2w; N = 11 for 4w, | p > .99 | p > .99 | p > .99 | p > .99 | p > .99 | |
| 8w, 12w, 16w) | ||||||
| OAP (N = 12) | 23.0 ± 9.0 | 23.8 ± 10.1 p > .99 | 22.1 ± 7.5 p > .99 | 23.1 ± 7.6 p > .99 | 20.8 ± 4.2 p > .99 | 24.9 ± 8.3 p > .99 |
| Aspartate transaminase (AST; U/L) | ||||||
| YAG | 18.3 ± 8.2 | 20.1 ± 10.2 | - | - | - | - |
| (N = 11) | p > .99 | |||||
| OAG (N = 12 for 0w, | 21.9 ± 3.8 | 23.9 ± 7.4 | 21.3 ± 7.1 | 20.5 ± 6.6 | 22.6 ± 8.9 | 25.2 ± 9.6 |
| 2w; N = 11 for 4w, | p > .99 | p > .99 | p > .99 | p > .99 | p > .99 | |
| 8w, 12w, 16w) | ||||||
| OAP (N = 12) | 24.2 ± 6.3 | 23.9 ± 8.2 | 19.9 ± 8.2 | 20.0 ± 6.2 | 20.1 ± 6.8 | 23.4 ± 9.5 |
| p > .99 | p = .27 | p = .38 | p > .99 | p > .99 | ||
| Creatinine (mg/dl) | ||||||
| YAG | 0.9 ± 0.2 | 0.8 ± 0.2 | - | - | - | - |
| (N = 11) | p = .44 | |||||
| OAG (N = 12 for 0w, 2w; N = 11 for 4w, 8w, 12w, 16w) | 0.9 ± 0.2 | 0.9 ± 0.2 p > .99 | 0.9 ± 0.2 p > .99 | 1.0 ± 0.3 p > .99 | 1.0 ± 0.3 p > .99 | 0.9 ± 0.2 p > .99 |
| OAP (N = 12) | 0.8 ± 0.2 | 0.9 ± 0.2 | 0.9 ± 0.2 | 0.9 ± 0.2 | 0.8 ± 0.1 | 0.8 ± 0.1 |
| p > .99 | p = .10 | p > .99 | p > .99 | p > .99 |
Notes: Data are summarized by means with standard deviations. p Values compare means estimated by the general linear mixed regression model. 2w, 4w, 8w, 12w, 16w refer to weeks after receiving supplements. p = compared to 0w.
Power Calculations Were Met
Power and sample size calculations for this trial were based on data from a small pilot open-label trial (23). Power calculations estimated that 10 participants per group (OAG and OAP) were necessary to detect differences in RBC-GSH concentrations at the p < .05 level. To account for up to 20% participant attrition, the study recruited 12 participants per group. At trial completion, 11 participants completed the study in the YA and OAG groups, and 12 participants completed in the OAP group, and the trial met statistical power to detect differences.
Discussion
This RCT found that GlyNAC supplementation in OA significantly improved/corrected GSH deficiency, OxS, mitochondrial dysfunction, physical function, waist circumference, endothelial function, SBP, and 7 hallmarks of aging affecting mitochondria, inflammation, IR, mitophagy, genomic damage, cellular senescence, and stem cells. This RCT is consistent with the notion that geriatric syndromes may be caused by the accumulation of many underlying processes (28). It conforms to the framework suggested for RCTs investigating risk factors linked to aging (24).
GSH Deficiency and OxS in Aging
GSH synthesis occurs in two steps, catalyzed by the enzymes glutamate cysteine ligase (GCL, comprised of catalytic and modifier subunits GCLC and GCLM), and GSS, to form the tripeptide glutathione (γ-glutamyl-cysteinyl-glycine) (22,23). Understanding how GSH is synthesized helps explain: (a) why intracellular GSH, and OxS levels are corrected by GlyNAC and not by isonitrogenous placebo (i.e., that increasing protein supplementation per se does not improve GSH deficiency in aging); (b) that GSH is an intracellular antioxidant, synthesized inside cells to regulate their internal redox milieu. It is critically essential to understand that each tissue maintains a different amount of GSH based on its metabolic demands. This demand is dynamic and variable. This is why cells regulate their own GSH synthesis, i.e., physiologically, intracellular GSH adequacy is determined by cellular synthesis and not via plasma delivery, or via GSH consumption or administration. This RCT measured and found that GlyNAC supplementation improves GSH in both RBC and in skeletal muscle. Reactive oxygen species (ROS) arising from mitochondrial respiration results in harmful and damaging OxS when in excess. The initial ROS is the highly toxic superoxide radical (O2) which is rapidly “detoxified” to hydrogen peroxide (H2O2). It is important to recognize that H2O2 is also highly toxic to membranes, lipid, proteins and the genome, and needs to be neutralized. GSH reduces and detoxifies the toxic H2O2 to water in the reaction H2O2 + 2GSH → 2H2O + GSSG (oxidized glutathione). Both GSH deficiency and OxS were corrected only in OA receiving GlyNAC, and not in OA receiving isonitrogenous supplementation, which indicates that generalized protein supplementation does not improve intracellular GSH or OxS. Because many age-related defects are linked to OxS (9–14), GlyNAC supplementation could play a novel role in improving/correcting age-associated abnormalities by lowering and correcting OxS.
Mitochondrial Dysfunction
Aging is associated with impaired mitochondrial function (15–20). This results in deficient energy availability. In the fasting state, normal mitochondria preferentially oxidize fatty-acids, and mitochondrial function is impaired in aging (17,21). In our earlier studies, we discovered and reported that inducing GSH deficiency results in impaired mitochondrial fatty-acid oxidation. This suggests that GSH adequacy is critically necessary for adequate mitochondrial fatty-acid oxidation (17). The OA in our RCT had both impaired mitochondrial fatty-acid oxidation and elevated mitochondrial glucose oxidation. This indicates mitochondrial dysfunction. The full extent of the age-associated mitochondrial impairment only became clear when the molecular data were examined. Mitochondrial function was severely compromised on multiple levels, including abnormalities in mitochondrial biogenesis (PGC1α), nutrient sensors regulating fatty-acid entry into mitochondria (pAMPK/AMPK, SirT3, CPT1b), mitochondrial β-oxidation of fatty-acids (HADHA, PPARα), electron transport chain complexes (I, II, III, V), ATP synthesis (ATP5A), and mitophagy (PINK1). GlyNAC supplementation began to rapidly improve these defects in 2-weeks, but a longer duration of 16-weeks was needed to correct these defects. Interestingly, acetate oxidation did not differ between unsupplemented YA and OA. It did not change after GlyNAC supplementation. This suggests that tricarboxylic-acid cycle integrity is not compromised in OA. Because optimal and efficient functioning of cellular processes and organs depends on an uninterrupted energy supply, mitochondrial dysfunction could result in cellular, tissue, organ, and whole-body adaptations and dysfunction commonly found in aging (15–20). By correcting mitochondrial dysfunction, GlyNAC supplementation could play a critical role to reverse age-associated declines and improve health in aging humans.
Physical Function
Aging is associated with declining physical function manifested as lower gait speed, muscle strength, and exercise capacity. A key meta-analysis in OA linked lower gait speed to decreased survival (29). Although improving the gait speed of OA to match levels seen in YA has been difficult to achieve, it occurred with GlyNAC supplementation. Mitochondrial dysfunction, inflammation, IR, stem-cell decline, and vascularization are linked to declining muscle health (30–33). GlyNAC-mediated improvement in these parameters could have contributed to improved physical function. Because declining strength and exercise capacity in aging are linked to functional limitations (especially in mobility and activities of daily living), improved physical function with GlyNAC supplementation holds implications for potentially improving the functional limitations of aging.
Body Composition
Aging is associated with increased abdominal obesity and waist circumference (6). Impaired mitochondrial fatty-acid oxidation is a risk factor for weight gain (34). It is likely that improving mitochondrial fatty-acid oxidation with GlyNAC is beneficial. The decrease in waist circumference in the GlyNAC supplemented group suggests that the fat loss occurred preferentially in the abdomen.
Hallmarks of Aging
Aging hallmarks contribute to multiple age-associated comorbidities (21). Although several compounds have improved some aging hallmarks in nonhuman models (35), none are reported to improve multiple aging hallmarks in a human RCT. GlyNAC supplementation in OA in this RCT improved 7 aging hallmarks affecting: (a) Mitochondrial dysfunction as discussed earlier; (b) Dysregulated nutrient sensing describes abnormalities in nutrient sensors that regulate fuel and energy metabolism. GlyNAC-mediated improvements in nutrient sensors likely occurred due to improvements in OxS, Glut4 expression, inflammation, and mitochondrial dysfunction (36–38). Sirtuin 3 is a key mitochondrial regulator (39) necessary for the action of NAD+ (a key regulator of energy metabolism) (40), and its improvement with GlyNAC could have implications for improving NAD+ mediated targets in the aging; (c) Altered intercellular communication addresses elevated inflammation, a smoldering, chronic destructive process linked to many diseases of aging (3,20,31). The combination of elevated proinflammatory and decreased anti-inflammatory cytokines suggest that the destructive impact of inflammation could be severe in aging. The successful improvement of these defects and lowering of inflammation in aging with GlyNAC supplementation could have profound implications for improving health in the aging; (d) Loss of proteostasis involves autophagy and mitophagy, which control organized disposal of cellular debris and are linked to longevity (41). Impaired mitophagy contributes to mitochondrial dysfunction (42) and was improved by GlyNAC supplementation; (e) Genomic instability: chromosomal damage in aging adversely affects health and was improved by GlyNAC supplementation, likely due to improvements in OxS, GSH, and mitochondrial energetics (43); (f) Stem-cells decline with aging. Satellite cells represent stem cells in muscle (44) and are identified by the molecular marker Pax7 (45). The discovery that GlyNAC supplementation improves Pax7 expression could have implications for rejuvenating muscle stem cells and improve muscle health in aging, including recovery from injury; (g) Cellular senescence: senescent cells accumulate during aging and secrete a toxic senescence-associated secretory phenotype (SASP). Cellular markers such as p16INK4α identify the presence of senescent cells (46). GlyNAC supplementation in OA significantly lowered muscle p16INK4α and inflammatory cytokines representative of SASP, suggesting a senolytic effect; (h) Telomere alteration: POT1 is a component of the shelterin complex regulating telomere stability (47), and was unchanged by GlyNAC or placebo supplementation. Whether GlyNAC could improve telomere length in aging is uncertain. (i) We propose inclusion of OxS and GSH deficiency as key aging hallmarks: The primary function of GSH is to neutralize excess ROS and prevent OxS. Excess ROS is strongly linked to multiple age-associated defects. Both GSH deficiency and elevated OxS exist in OA. Via rodent studies, we showed that GSH adequacy is critically necessary for optimal and efficient mitochondrial fatty-acid oxidation (17). Our studies indicate that GSH deficiency and OxS act as 2 sides of the coin and could be the root defects from which mitochondrial dysfunction ensues. We speculate that the resulting lack of energy coupled with the amplified destructive potential of elevated OxS (due to a lack of protective GSH) contributes to other aging hallmarks. Therefore, we propose that OxS and GSH deficiency should be included as additional, and potentially foundational aging hallmarks.
Endothelial Dysfunction and Blood Pressure
The vascular endothelium generates nitric oxide, which plays an important role in vasodilation (48,49). Oxidative stress and GSH deficiency have been linked to abnormalities in nitric oxide metabolism (50). The improvement of both endothelial function and systolic blood pressure with GlyNAC supports the need for evaluating its effects on nitric oxide biology. These parameters are linked to cardiac health. We showed earlier that GlyNAC supplementation in old mice resulted in improved cardiac function (51).
HRQoL
The lack of improvement of HRQoL after GlyNAC supplementation is surprising and may be due to the relatively short duration of supplementation. This suggests the translation of biological benefits to perceived subjective improvements may require more time. Because OA with multiple comorbidities was excluded from this trial, the baseline QoL was excellent, making improvement difficult.
Caveats About GlyNAC Supplementation
(a) GlyNAC supplementation is physiological and does not induce reductive stress
Cells require minute amounts of ROS for cellular signaling and function (52). Excessive decrease of ROS results in cellular damage, a phenomenon known as “reductive stress” (RedS) (53). Cells have to maintain a delicate balance between lowering OxS and simultaneously avoiding RedS. This balance could be upset easily. Excess administration of NAC-alone or GSH-alone in the worm Caenorhabditis elegans (C elegans) results in accelerated aging. This is likely due to induction of RedS (54), whereas GlyNAC supplementation in mice increases life span (55). Cellular generation of ROS is a dynamic process linked to mitochondrial energy generation. It fluctuates within organs (rest vs activity, fasting vs fed, waking vs sleeping), and is different in each organ. Dosing of exogenous antioxidants is a challenge as too much could induce RedS, and too little will not restrain OxS. This trial finds that GlyNAC supplementation in OA lowers OxS markers, but these do not decrease below levels in YA thus avoiding RedS. Therefore, GlyNAC supplementation is an ideal physiological supplement that acts by supporting the intrinsic cellular capacity for lowering OxS without inducing RedS.
(b) Why GlyNAC works: the “power of 3”
GlyNAC provides the precursor amino acids glycine and cysteine (from N-acetylcysteine) for GSH synthesis. Glycine, cysteine, and GSH make independent and important contributions toward cellular health and organ function (22,56,57). Their combination represents a “Power of 3” to indicate that benefits occur due to the combined effects of all three components. It is not just GSH alone. Glycine is a rate-limiting amino acid for GSH synthesis (57). It is an important donor of the 1-carbon methyl-group essential for multiple cellular reactions, including purines for deoxyribonucleic acid (DNA) synthesis. Glycine and GlyNAC supplementation in mice significantly increase life span (55,58). Glycine supplementation is shown to lower the incidence of pulmonary adenocarcinoma (58). NAC donates cysteine and which provides the critically essential thiol (SH) groups needed for multiple cellular reactions. This is especially true for mitochondrial energy metabolism. Thiol groups play important roles in cellular reactions, and are a component of peptides, proteins and lipids. GSH is considered a “master antioxidant” based on its abundant presence within cells, its ability to neutralize harmful OxS, support mitochondrial function, and detoxification via glutathionylation. The “power of 3” refers to the combined action of glycine, NAC, and GSH, and could explain the speed and magnitude of GlyNAC-mediated improvement of the age-associated decline in cellular function, reversal of aging hallmarks, and health improvement in aging.
(c) GlyNAC is not the same as NAC-alone or GSH-alone
Although NAC and GSH have antioxidant properties, the effect of their supplementation on age-associated defects are limited. We compared the effects of NAC-alone versus GlyNAC on cardiovascular function in old mice and found that only GlyNAC improved cardiac function and inflammation (leukocyte infiltration), and this was not achieved by NAC-alone (51). Human clinical trials supplementing NAC-alone did not find any improvements RBC-GSH concentrations, OxS, or inflammation (as TNFα) (59–61), GlyNAC supplementation improved/corrected these outcomes in this RCT. A trial supplementing NAC-alone in diabetic patients failed to improve RBC-GSH fractional-synthesis rates or GSH concentrations (62), whereas GlyNAC supplementation in diabetic patients improved both these defects (63), and also improved mitochondrial dysfunction and IR (64). These differing responses can be explained by understanding that GSH synthesis requires both glycine and cysteine, and both are provided by GlyNAC. Because NAC can only provide cysteine, its ability to support GSH synthesis is limited by glycine availability (57). Potentially, NAC supplementation, by sequestering glycine into GSH could further decrease glycine availability for critical pathways discussed earlier. GlyNAC differs from NAC by providing both cysteine and glycine, and this could explain the extent and magnitude of biological and physiological improvements seen in OA in this RCT, and as reported in our prior publications (17,23,25,51). Similarly, supplementing GSH-alone in a human RCT failed to improve OxS (F2-isoprostanes) or genomic damage (8-OHdG) (65), whereas GlyNAC supplementation in this RCT improved both these markers. Furthermore, excess administration of NAC-alone and GSH-alone result in accelerated aging in C elegans (54), while GlyNAC supplementation in mice reversed GSH deficiency and increased longevity (55). GlyNAC supplementation provides a wide range of health benefits not provided by NAC-alone or GSH-alone.
(d) How long is GlyNAC supplementation needed?
Our prior exploratory open-label trial supplemented GlyNAC for 24-weeks and found similar benefits as reported in this trial (66). However, withdrawing GlyNAC for 12-weeks led to loss/decrease of benefits. These data indicate that GlyNAC supplementation needs to be maintained for the preservation of benefits.
Study limitations and Future Directions
This RCT studied healthier OA to focus primarily on the pure effect of aging unaffected by the additional confounding disease. Because the trial results show that GlyNAC supplementation improves multiple age-associated abnormalities, future GlyNAC trials with larger numbers of more typical OA are warranted.
Conclusion
This RCT provides evidence to show that GlyNAC supplementation in OA improves GSH deficiency, OxS, mitochondrial impairment, mitophagy, inflammation, insulin resistance, endothelial dysfunction, physical function and strength, exercise capacity, waist circumference, state systolic blood pressure, and multiple hallmarks of aging (mitochondrial dysfunction, altered intercellular communication, dysregulated nutrient sensing, loss of proteostasis, genomic toxicity, stem-cell exhaustion, and cellular senescence). GlyNAC supplementation begins to improve age-associated declines within 2-weeks but a longer duration of supplementation is needed for a greater magnitude of improvement. This RCT provides proof-of-concept that GlyNAC supplementation represents a novel, simple, safe, and effective nutritional approach in humans to promote and improve healthy aging.
Funding
This work was supported by R01 funding to R.V.S. from the National Institutes of Health/National Institute of Aging (R01AG041782), and a philanthropic gift to R.V.S. (to support research) from the McNair Medical Institute at the Robert and Janice McNair Foundation in Houston, TX. Neither of these sources played any role in the conduct of the trial, interpretation of results, statistical analysis, or manuscript preparation. None of the authors had any relationship with these sources of research support.
Conflict of Interest
None declared.
Acknowledgments
We thank the research nursing staff of the Institute of Clinical and Translation Research (ICTR), and the Metabolic Research Unit (MRU) at Baylor College of Medicine for their contributions in this RCT.
Author Contributions
P.K. performed blood and molecular analyses and contributed to manuscript review. C.L. was the study coordinator and processed tracer samples. J.S. performed the muscle biopsies. J.W.H. prepared tracer solutions. F.J. supervised J.W.H. and C.L., and contributed to manuscript review. R.M. performed the MRS imaging. C.G.M. performed statistical analyses. G.E.T. provided geriatric input, and contributed to data interpretation and manuscript editing/review. R.V.S. led the study team as Principal Investigator, conceived the hypotheses, designed the trial, obtained funding, developed the GlyNAC intervention, obtained IRB approval, recruited and consented participants, supervised P.K. and C.L., interpreted data, created the tables and figures, and wrote and reviewed the manuscript.

