


Abstract
Physical exercise has been associated with neuroprotective effects in the nigrostriatal dopaminergic system. To examine the impact of physical activity on Parkinson’s disease risk prospectively, we followed 43 368 individuals who provided extensive information on physical activity at baseline. We estimated hazard ratios with 95% confidence intervals using Cox proportional hazards regression. During an average of 12.6 years of follow-up, 286 incident Parkinson’s disease cases were identified. In males, there was an inverse association with Parkinson’s disease for total physical activity (hazard ratio 0.55, 95% confidence interval 0.35–0.87 for medium versus low level), for sum of household, commuting and leisure time exercise (hazard ratio 0.53, 95% confidence interval 0.33–0.85 for high versus low level), and for household and commuting physical activity specifically (hazard ratio 0.50, 95% confidence interval 0.31–0.81 for >6 versus <2 h per week). No association was observed for leisure time exercise or occupational physical activity with Parkinson’s disease, among either males or females. Meta-analysis of the present study and five previous prospective studies showed a pooled hazard ratio of 0.66 (95% confidence interval 0.57–0.78) for highest versus lowest physical activity level. Our results indicate that a medium level of physical activity lowers Parkinson’s disease risk.
Introduction
Parkinson’s disease is an age-related progressive neurodegenerative disorder characterized by loss of dopaminergic neurons in the brain, and affects >1% in persons above 60 years of age (Wirdefeldt et al., 2011). The aetiology of Parkinson’s disease remains poorly understood. Only a few risk factors have been consistently identified, including family history (Thacker and Ascherio, 2008) and the protective effects of smoking (Wirdefeldt et al., 2005) and caffeine (Costa et al., 2010). In animal experiments, intensive physical exercise has also been associated with neuroprotective and neurorestorative effects in the nigrostriatal dopaminergic system (Ahlskog, 2011; Petzinger et al., 2013). However, only a few epidemiological studies have examined the impact of physical activity on the risk of Parkinson’s disease, with contradictory results (Sasco et al., 1992; Chen et al., 2005; Logroscino et al., 2006).
We therefore examined the association between physical activity and the subsequent risk of Parkinson’s disease in the Swedish National March Cohort, with prospectively collected comprehensive information on physical activity using a structured and validated questionnaire. We also meta-analysed the present study together with five prospective cohort studies on this topic.
Materials and methods
Study population
In September 1997, the Swedish National March Cohort was assembled during a 4-day national promotional and fundraising event of the Swedish Cancer Society, which has been described in detail previously (Lagerros et al., 2009). All participants were invited to fill out a 36-page questionnaire with background data including detailed information on physical activity. In total, we included 27 863 (64.3%) females and 15 505 (35.7%) males free of Parkinson’s disease at the start of follow-up in the current study. Detailed inclusion and exclusionary criteria are listed in the Supplementary material. All participants provided informed consent and the study was approved by the Regional Ethics Committee in Stockholm.
Exposure assessment
In the questionnaire, we assessed household and commuting activity, occupational activity, leisure time exercise, and total daily physical activity. In addition, participants reported how often they exercised during different age periods. For the purpose of the present study, we quantified physical activity into metabolic equivalent (MET) hours per day, based on estimated oxygen consumption associated with these activities (Ainsworth et al., 1993, 2000). The MET scores of household, commuting activity and leisure time exercise were then summed into a variable termed ‘general physical activity’. We categorized the MET scores of physical activity into tertiles with separate cut-offs for all participants, males and females. Detailed information on physical activity exposures are listed in the Supplementary material.
Case identification
We defined cases with Parkinson’s disease as individuals with any diagnosis of Parkinson’s disease in the Swedish national patient register, considering both primary and secondary diagnoses. Index date for Parkinson’s disease was defined as the date of first-ever hospital admission or outpatient contact (see Supplementary material for further information).
Statistical analyses
Study participants were followed from baseline on 1 October 1997 until index date of Parkinson’s disease, date of death, date of emigration, or end of follow-up on 31 December 2010, whichever came first. We used Cox proportional hazards regression with attained age as the underlying timescale, to estimate hazard ratios (HRs) with 95% confidence intervals (CIs) for Parkinson’s disease risk by different types of physical activity. We used a model only adjusted for age as well as a multivariable model, including sex, cigarette smoking, alcohol and coffee intake, body mass index, and educational level. We performed both overall analyses and stratified analyses by sex. Further, we examined whether changing frequency of leisure time exercise between ages 30–49 and ≥50 years was associated with risk of Parkinson’s disease. To assess the robustness of the main analyses, we further conducted a rich set of sensitivity analyses. Last, to explore the possible protective effect of physical activity on Parkinson’s disease risk holistically, we meta-analysed the present study and previous prospective studies on physical activity and Parkinson’s disease risk (Chen et al., 2005; Logroscino et al., 2006; Thacker et al., 2008; Xu et al., 2010; Saaksjarvi et al., 2014). Detailed statistical analyses are documented in the Supplementary material.
Results
Table 1 shows the baseline characteristics of participants according to different levels of household and commuting activity, leisure time exercise, and total physical activity.
Selected baseline characteristics of the 43 368 participants in the Swedish National March Cohort
| Household and commuting activity | Leisure time exercisea | Total physical activityb | ||||||||
|---|---|---|---|---|---|---|---|---|---|---|
| <2 h/week | 3–4 h/week | 5–6 h/week | >6 h/week | Low | Medium | High | Low | Medium | High | |
| n | 6859 | 12 823 | 9493 | 13 956 | 14 687 | 14 871 | 13 438 | 12 979 | 12 976 | 12 977 |
| Mean age ± SD, years | 46.0 ± 17.3 | 48.9 ± 16.8 | 51.2 ± 16.9 | 53.1 ± 16.7 | 53.5 ± 15.6 | 52.2 ± 16.2 | 44.3 ± 18.0 | 51.6 ± 17.2 | 49.3 ± 16.0 | 48.9 ± 17.6 |
| Males, % | 44.0 | 34.0 | 31.2 | 36.3 | 35.2 | 33.1 | 39.3 | 25.6 | 32.8 | 48.2 |
| Cigarette smoking, % | ||||||||||
| Never | 59.2 | 60.3 | 61.4 | 59.9 | 57.8 | 59.3 | 64.0 | 59.4 | 60.8 | 61.0 |
| Current | 9.4 | 8.0 | 6.7 | 7.4 | 8.9 | 7.2 | 7.0 | 8.2 | 7.2 | 7.6 |
| Past | 30.5 | 30.8 | 31.2 | 31.8 | 32.3 | 32.7 | 28.1 | 31.7 | 31.5 | 30.3 |
| Alcohol intake, % | ||||||||||
| Never | 12.5 | 12.0 | 12.7 | 13.5 | 14.4 | 12.2 | 11.3 | 13.6 | 11.6 | 12.1 |
| ≤3 times/month | 48.5 | 48.2 | 48.9 | 47.3 | 47.7 | 47.2 | 49.8 | 48.4 | 47.3 | 48.8 |
| 1–6 times/week | 36.0 | 37.4 | 36.1 | 36.0 | 34.8 | 37.9 | 36.6 | 35.2 | 38.8 | 36.5 |
| ≥1 time/day | 2.3 | 1.8 | 2.0 | 2.5 | 2.3 | 2.2 | 1.9 | 2.2 | 1.9 | 2.2 |
| Coffee intake, % | ||||||||||
| Never | 17.5 | 15.5 | 13.2 | 12.0 | 10.3 | 12.6 | 20.4 | 14.5 | 13.8 | 15.0 |
| 1–2 cups/day | 28.5 | 29.9 | 30.1 | 27.9 | 29.4 | 29.3 | 28.4 | 30.9 | 29.4 | 27.3 |
| 3 cups/day | 19.6 | 21.8 | 22.7 | 22.5 | 23.0 | 23.2 | 19.3 | 22.5 | 22.5 | 20.8 |
| ≥4 cups/day | 32.1 | 31.0 | 32.3 | 35.6 | 35.3 | 33.3 | 29.9 | 30.3 | 32.7 | 35.0 |
| Body mass index (kg/m2), % | ||||||||||
| <25 | 53.1 | 56.5 | 60.5 | 60.7 | 49.4 | 58.0 | 68.3 | 55.4 | 60.4 | 60.5 |
| 25–29.9 | 30.5 | 31.8 | 29.7 | 29.5 | 34.5 | 31.9 | 24.1 | 31.2 | 30.4 | 29.6 |
| ≥30 | 10.2 | 7.1 | 5.9 | 5.3 | 10.4 | 6.0 | 3.6 | 9.0 | 5.9 | 5.3 |
| Education, % | ||||||||||
| 7–9 years | 30.9 | 35.0 | 37.4 | 44.1 | 43.3 | 39.0 | 31.1 | 38.2 | 33.5 | 39.1 |
| 10–12 years | 37.7 | 34.2 | 33.0 | 31.9 | 29.8 | 31.5 | 41.0 | 31.9 | 32.4 | 37.1 |
| >12 years | 29.3 | 29.0 | 27.7 | 21.4 | 24.7 | 27.6 | 27.2 | 28.0 | 32.3 | 22.0 |
n = Number of subjects; SD = standard deviation.
Column percentages do not always add up to 100 due to missing data.
The differences between different physical activity levels and covariates were all statistically significant (P-value < 0.01).
aLeisure time exercise: cut-offs of 1.3 and 3.0 MET-h/day for all subjects.
bTotal physical activity in a 24-h day reported using the Energy Expenditure Questionnaire: cut-offs of 32.3 and 40.4 MET-h/day for all subjects.
During a mean of 12.6 ± 2.2 years of follow-up, we identified 286 incident cases of Parkinson’s disease (158 males). Of these cases, 105 and 57 were identified exclusively through their outpatient and inpatient hospital visits for Parkinson’s disease, respectively, and 124 had records from both inpatient and outpatient visits. Mean age at cohort enrolment was 50.3 ± 17.1 years for the entire cohort, and 65.3 ± 9.0 years for the Parkinson’s disease cases. Mean age at the first register diagnosis of Parkinson’s disease was 73.6 ± 8.7 years.
Results from the age-adjusted model are presented in Supplementary Table 1. In the multivariable-adjusted model, compared with participants who spent <2 h per week on household and commuting activity (age-adjusted incidence of 72.3 per 100 000 person-years), those with >6 h per week of such activities (age-adjusted incidence of 45.1 per 100 000 person-years) had a 43% lower risk of Parkinson’s disease (Table 2). Physically demanding level of occupational activity was not statistically significantly associated with Parkinson’s disease risk, although a decreasing risk of Parkinson’s disease was suggested with increasing demanding level of occupational activity. Compared with a low level of total physical activity (mean = 30.3 MET-h/day, age-adjusted incidence of 99.1 per 100 000 person-years), the medium level (mean = 39.1 MET-h/day, age-adjusted incidence of 62.2 per 100 000 person-years) was associated with a 45% lower Parkinson’s disease risk in males (Table 3 and Supplementary Fig. 1). General physical activity was associated with a lower risk of Parkinson’s disease in males and in the two genders combined. Leisure time exercise was not associated with Parkinson’s disease risk when analysed alone. There were no gender-specific effects for any of the physical activity exposures (P for interaction = 0.62, 0.62, 0.50, 0.15, 0.20 for household/commuting activity, occupational activity, leisure time exercise, general physical activity, and total physical activity, respectively). Finally, any changes in the frequency of leisure time exercise between the age of 30–49 and ≥50 years were not associated with Parkinson’s disease risk (Supplementary Fig. 2).
Age-adjusted incidence rates and multivariable-adjusted hazard ratios with 95% confidence intervals for Parkinson’s disease risk by household and commuting activity, and physically demanding level of occupational activity
| All subjects | Males | Females | ||||||||||||
|---|---|---|---|---|---|---|---|---|---|---|---|---|---|---|
| n | IR | HR | 95% CI | n | IR | HR | 95% CI | n | IR | HR | 95% CI | |||
| Household and commuting activity | ||||||||||||||
| <2 h/week | 46 | 72.30 | 1 | (reference) | 31 | 116.91 | 1 | (reference) | 15 | 43.42 | 1 | (reference) | ||
| 3–4 h/week | 78 | 56.22 | 0.68 | 0.46–1.00 | 45 | 94.69 | 0.68 | 0.42–1.12 | 33 | 35.13 | 0.68 | 0.36–1.28 | ||
| 5–6 h/week | 67 | 54.28 | 0.70 | 0.47–1.04 | 30 | 76.11 | 0.59 | 0.35–1.01 | 37 | 43.15 | 0.84 | 0.46–1.56 | ||
| >6 h/week | 95 | 45.11 | 0.57 | 0.39–0.83 | 52 | 70.62 | 0.50 | 0.31–0.81 | 43 | 31.71 | 0.67 | 0.37–1.22 | ||
| P for trend | 0.01 | 0.01 | 0.39 | |||||||||||
| Physically demanding level of occupational activity | ||||||||||||||
| Mostly sedentary | 31 | 65.44 | 1 | (reference) | 21 | 93.23 | 1 | (reference) | 21 | 42.25 | 1 | (reference) | ||
| Moving a little | 209 | 55.84 | 0.91 | 0.60–1.38 | 116 | 89.46 | 0.92 | 0.54–1.55 | 93 | 38.64 | 0.90 | 0.46–1.77 | ||
| Strenuous | 40 | 38.56 | 0.74 | 0.45–1.22 | 19 | 56.86 | 0.63 | 0.32–1.25 | 21 | 30.54 | 0.85 | 0.40–1.83 | ||
| P for trend | 0.20 | 0.17 | 0.69 | |||||||||||
n = Number of Parkinson’s disease cases; IR = incidence rate; HR = hazard ratio; CI = confidence interval.
Incidence rates were presented as per 100 000 person-years, standardized to the age distribution of person-years experienced by all subjects using 5-year age categories.
Analyses performed with Cox proportional hazards regression model, with attained age as timescale, adjusting for sex, cigarette smoking, alcohol and coffee intake, body mass index, and educational level.
Age-adjusted incidence rates and multivariable-adjusted hazard ratios with 95% confidence intervals for Parkinson’s disease risk by total physical activity, general physical activity, and leisure time exercise
| All subjects | Males | Females | |||||||||||
|---|---|---|---|---|---|---|---|---|---|---|---|---|---|
| n | IR | HR | 95% CI | n | IR | HR | 95% CI | n | IR | HR | 95% CI | ||
| Total physical activitya | |||||||||||||
| Low | 92 | 53.71 | 1 | (reference) | 44 | 99.06 | 1 | (reference) | 48 | 31.85 | 1 | (reference) | |
| Medium | 63 | 43.30 | 0.74 | 0.53–1.03 | 32 | 62.19 | 0.55 | 0.35–0.87 | 31 | 37.85 | 1.16 | 0.72–1.87 | |
| High | 89 | 57.06 | 0.88 | 0.64–1.21 | 58 | 80.12 | 0.83 | 0.54–1.25 | 31 | 36.19 | 1.15 | 0.71–1.85 | |
| P for trend | 0.67 | 0.59 | 0.63 | ||||||||||
| General physical activityb | |||||||||||||
| Low | 104 | 60.11 | 1 | (reference) | 57 | 98.24 | 1 | (reference) | 45 | 38.63 | 1 | (reference) | |
| Medium | 105 | 53.95 | 0.88 | 0.66–1.18 | 61 | 99.25 | 1.04 | 0.72–1.52 | 44 | 35.08 | 0.81 | 0.52–1.25 | |
| High | 77 | 46.09 | 0.72 | 0.53–0.99 | 40 | 55.80 | 0.53 | 0.33–0.85 | 37 | 34.75 | 0.85 | 0.54–1.34 | |
| P for trend | 0.04 | 0.01 | 0.13 | ||||||||||
| Leisure time exercisec | |||||||||||||
| Low | 109 | 54.71 | 1 | (reference) | 62 | 94.79 | 1 | (reference) | 47 | 35.01 | 1 | (reference) | |
| Medium | 112 | 56.03 | 0.96 | 0.72–1.27 | 61 | 89.09 | 0.87 | 0.60–1.28 | 51 | 38.69 | 1.05 | 0.69–1.60 | |
| High | 63 | 49.97 | 0.86 | 0.62–1.19 | 35 | 70.03 | 0.73 | 0.47–1.14 | 28 | 37.47 | 1.06 | 0.64–1.74 | |
| P for trend | 0.36 | 0.18 | 0.83 | ||||||||||
n = Number of Parkinson’s disease cases; IR = incidence rate; HR = hazard ratio; CI = confidence interval.
Incidence rates were presented as per 100 000 person-years, standardized to the age distribution of person-years experienced by all subjects using 5-year age categories.
Analyses performed with Cox proportional hazards regression model, with attained age as timescale, adjusting for sex, cigarette smoking, alcohol and coffee intake, body mass index, and educational level.
aTotal physical activity in a 24-h day reported using the Energy Expenditure Questionnaire: cut-offs of 32.3 and 40.4 MET-h/day for all subjects; cut-offs of 34.2 and 45.3 MET-h/day for males; cut-offs of 31.6 and 38.1 MET-h/day for females.
bGeneral physical activity = sum of household, commuting activity and leisure time exercise: cut-offs of 3.9 and 6.4 MET-h/day for all subjects; cut-offs of 3.9 and 6.6 MET-h/day for males; cut-offs of 4.0 and 6.2 MET-h/day for females.
cLeisure time exercise: cut-offs of 1.3 and 3.0 MET-h/day for all subjects; cut-offs of 1.3 and 3.2 MET-h/day for males; cut-offs of 1.3 and 3.0 MET-h/day for females.
The different sensitivity analyses showed comparable results to the main analyses (Supplementary Tables 2–5). For example, when using only primary diagnosis as the Parkinson’s disease definition, an inverse association was still observed for medium level of total physical activity in males (HR: 0.52, 95% CI: 0.31–0.90).
The meta-analysis of the four studies including gender-specific information showed that higher physical activity levels were associated with a lower Parkinson’s disease risk in both males and females (Fig. 1). The pooled HRs comparing the highest activity level with the lowest were 0.66 (95% CI 0.57–0.78) for all participants, 0.64 (95% CI 0.53–0.78) for males and 0.71 (95% CI 0.50–1.00) for females. When we included the study that did not provide gender-specific information (Saaksjarvi et al., 2014), the pooled meta-estimate for all participants was unchanged.
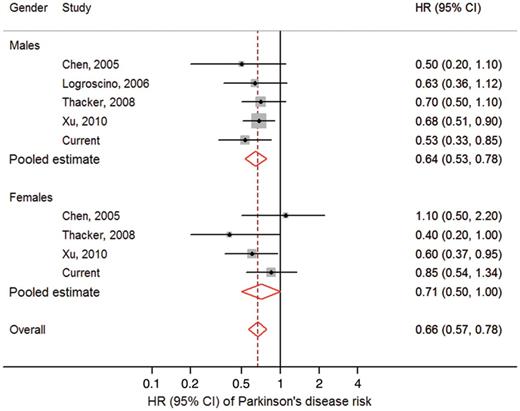
Forest plot. Forest plot showing meta-analysis of the risk of Parkinson’s disease associated with physical activity, comparing the highest level of physical activity to the lowest, by gender, and males and females pooled together. HR = hazard ratio; CI = confidence interval. Squares indicate the individual HR in each study. The size of each square is proportional to the per cent weight of that individual study in the meta-analysis, and the horizontal line represents the 95% CI. Pooled HRs and 95% CIs are indicated by hollow diamonds.
Discussion
In this prospective study with thorough assessment of physical activity, we found that a medium level of daily total physical activity was associated with a lower risk of Parkinson’s disease, most prominently in males. The inverse association was not statistically significant when occupational activity or leisure time exercise were analysed separately. The results were less clear for females than for males in our data. Our meta-analysis supports the inverse association between physical activity and Parkinson’s disease risk that we found.
Previously, only five prospective studies examined physical activity and risk of Parkinson’s disease (Chen et al., 2005; Logroscino et al., 2006; Thacker et al., 2008; Xu et al., 2010; Saaksjarvi et al., 2014). Our results are in line with the previous studies, although previous studies focused primarily on moderate to vigorous exercise rather than total physical activity as in our study. Moderate to vigorous exercise measured by leisure time, household or commuting activity has been commonly used to estimate physical activity level in epidemiological studies, but as exercise only accounts for ∼17–18% of total energy expense (Lagerros et al., 2009), it may not well represent the association between total physical activity and Parkinson’s disease risk. Total physical activity measured by the energy expenditure questionnaire as in the present study captures a more comprehensive picture of daily physical activities (Lagerros et al., 2009) and may therefore be a better representation of a modulating factor for Parkinson’s disease risk compared to a specific type of physical activity. Further, the different exposure measures capture different aspects of physical activity; for example, household and commuting exposures focus on specific activities, but general and total physical activity exposures cover a broader spectrum.
Our results did not show an association between physical activity and Parkinson’s disease risk when females were analysed separately, or between occupational activity and Parkinson’s disease risk in either males or females. The lack of associations in these groups may be explained by the relatively smaller number of exposed cases, making it more difficult to detect the associations. Indeed, we found no evidence of gender-specific effects by the interaction tests, and our meta-analysis of the present study and five prospective studies showed an inverse association between physical activity and Parkinson’s disease risk in both genders, although borderline significant in females.
It has been hypothesized that health benefits gained from physical activity would depend on initial physical activity level, such that sedentary individuals would be expected to benefit more from increasing their activity level late in life compared to people who were already physically active (Pate et al., 1995). However, Xu et al. (2010) reported lower Parkinson’s disease risk among individuals who increased participation in moderate to vigorous exercise between age 35–39 and the past 10 years prior to the exercise assessment, but a higher Parkinson’s disease risk was not observed among individuals with decreased participation in exercise. In our study, a similar pattern was suggested, although not statistically significant.
A protective role of physical activity on Parkinson’s disease risk is supported by animal experiments showing that forced exercise before or after 6-OHDA (6-hydroxydopamine) and MPTP (1-methyl-4-phenyl-1,2,3,6-tetrahydropyridine) treatment spared nigrostriatal dopaminergic terminals and attenuated movement abnormalities (Tillerson et al., 2001, 2003). In rodent models of Parkinson’s disease, forced exercise may increase striatal GDNF (glial cell-line derived neurotrophic factor), which has a protective effect on dopaminergic neurons (Cohen et al., 2003), or decrease the ratio between dopamine transporter and vesicular monoamine transporter protein, which makes dopaminergic neurons less vulnerable to toxins (Tillerson et al., 2003). Forced exercise may also restore the dopaminergic system and increase dopaminergic neurons’ availability in the striatum, possibly through functional enhancement of vesicular dopamine release (Petzinger et al., 2007) or elevation of D2 receptors (Vuckovic et al., 2010). In humans, physical exercise has been suggested to increase plasma urate levels (Green and Fraser, 1988), which in turn has been associated with lower risk of Parkinson’s disease (Weisskopf et al., 2007) and a slower clinical progression (Schwarzschild et al., 2008). Additionally, physical inactivity may lead to overweight or obesity, which has been suggested to decrease striatal D2 receptor availability (Wang et al., 2001), in turn associated with higher Parkinson’s disease risk (Hu et al., 2006; Hawkes, 2008). In sum, although the potential mechanisms of different types of physical activity are not yet fully understood, available evidence from animal and human studies suggest favourable biological effects of exercise with regard to Parkinson’s disease risk.
The present study has several strengths. First, this was a prospective study including both males and females. Second, all information on physical activity was assessed before the disease occurrence, minimizing recall bias and reverse causation. Third, we considered the entire spectrum of daily energy output by assessing total physical activity with a validated instrument (Lagerros et al., 2006), as well as leisure time, commuting and occupational exercise, commonly assessed in other epidemiological studies. Further, we conducted a rich set of sensitivity analyses to test the robustness of our findings.
Some limitations should be considered in interpreting our results. We cannot entirely exclude the possibility that preclinical Parkinson’s disease at baseline may manifest as a lower level of physical activity (reverse causality). However, results from our 8-year lag-time analyses were similar to those of the main analyses; decreasing physical activity level late in life was not associated with Parkinson’s disease risk neither in our own study nor in another study (Xu et al., 2010), largely alleviated this concern. One may question the reliability of self-reported information on physical activity. However, the physical activity questionnaire has been validated and proven to be of high quality. Given the prospective design with relatively long follow-up, we believe that potential misclassification would be non-differential, theoretically leading to an underestimation of the inverse association between physical activity and Parkinson’s disease risk. Parkinson’s disease diagnoses were obtained from the national health registers, and although the in-patient Parkinson’s disease diagnoses have been validated against clinical diagnoses showing good accuracy, misclassification between Parkinson’s disease and other parkinsonian disorders occurs (Feldman et al., 2012). Most likely, however, this misclassification would be non-differential, resulting in bias towards the null, so the true association would be even stronger than the observed. Nevertheless, we obtained similar results when using only the primary diagnosis or both primary and secondary diagnoses as the definitions of Parkinson’s disease. The issue of multiple testing may be a minor concern, although the results remained statistically significant after Bonferroni adjustment. Additionally, as exposure information was collected only at baseline, we were unable to examine whether some covariates may act as mediators. Last, as participants in our study appeared to be more physically active on average compared to the general Swedish population (Lagerros et al., 2009), future studies are warranted to examine whether our findings can be generalized to populations of less physically active individuals.
In conclusion, we found that a medium level of daily total physical activity is associated with a lower risk of Parkinson’s disease, especially in males. The inverse association between physical activity and Parkinson’s disease risk was also observed for higher levels of household activity, commuting activity, and exercise. Our meta-analysis supports the inverse association between physical activity and Parkinson’s disease risk. These findings are important for both the general population and the healthcare of patients with Parkinson’s disease.
Funding
This work was supported by the Swedish Research Council (grants 521-2010-2479 and 521-2013-2488); the companies ICA Sweden and Ericsson; the Swedish Cancer Society (grant CAN 2012/591); Karolinska Institutet Distinguished Professor Award (HOA grant 2368/10-221); and the regional agreement on medical training and clinical research between Stockholm County Council and Karolinska Institutet (Y.T.L.). The funders had no role in study design, data collection and analysis, decision to publish, or preparation of the manuscript. Y.T.L. has received consulting fees from Novo Nordisk. Other authors have no conflict of interest to declare.
Supplementary material
Supplementary material is available at Brain online.
Abbreviation
References
Author notes
See Tanner and Comella () for a scientific commentary on this article.

