


Abstract
Assessments of influenza season severity can guide public health action. We used the moving epidemic method to develop intensity thresholds (ITs) for 3 US surveillance indicators from the 2003–2004 through 2014–2015 influenza seasons (excluding the 2009 pandemic). The indicators were: 1) outpatient visits for influenza-like illness; 2) influenza-related hospitalizations; and 3) influenza- and pneumonia-related deaths. ITs were developed for the population overall and separately for children, adults, and older adults, and they were set at the upper limit of the 50% (IT50), 90% (IT90), and 98% (IT98) 1-sided confidence intervals of the geometric mean of each season’s 3 highest values. Severity was classified as low if ≥2 systems peaked below IT50, moderate if ≥2 peaked between IT50 and IT90, high if ≥2 peaked between IT90 and IT98, and very high if ≥2 peaked above IT98. We pilot-tested this method with the 2015–2016 season and the 2009 pandemic. Overall, 4 seasons were classified as low severity, 7 as moderate, 2 as high, and none as very high. Among the age groups, older adults had the most seasons (n = 3) classified as high, and children were the only group to have seasons (n = 2) classified as very high. We will apply this method to classify the severity of future seasons and inform pandemic response.
Seasonal influenza epidemics occur each year in the United States, resulting in 9 million to 36 million symptomatic cases, 140,000–710,000 hospitalizations, and 12,000–56,000 deaths per year (1–4). Annual rates of illness and severe outcomes vary from year to year and are dependent on the characteristics and distribution of circulating viruses, influenza vaccine effectiveness and coverage, and the age groups most affected (5–9). The Centers for Disease Control and Prevention (CDC) tracks influenza activity through key indicators such as the percentage of influenza-like illness (ILI) visits to outpatient clinics, the rates of influenza-associated hospitalizations, and the percentage of deaths resulting from pneumonia or influenza (10).
Because of the variability of influenza activity, rapidly available assessments of the intensity (i.e., the magnitude of this season’s activity compared to previous seasons) and the severity (i.e., the overall impact of epidemic influenza, accounting for both the number of cases and the proportion of cases requiring hospitalization or resulting in death) are helpful to guide public health action, such as targeting prevention and treatment messages to the appropriate clinician and public audiences. CDC previously developed a systematic framework that assessed the severity of influenza using multiple indicators to guide planning for pandemic mitigation and data collection (11); further work was needed to better distinguish differences in the intensity of influenza activity between nonpandemic seasons.
In this paper, we used the moving epidemic method (MEM) to develop intensity threshold (IT) values. ITs are developed using historic data and help assess the chance that a system will go above a certain threshold. For example, ITs have been used by the US Geological Survey and the National Flood Insurance Program to communicate flood risk (12). We developed ITs for 3 indicators of influenza activity collected through routine, representative, and near real-time US surveillance systems: 1) the percentage of visits to outpatient clinics for ILI, 2) the rates of influenza-associated hospitalizations, and 3) the percentage of deaths resulting from pneumonia or influenza. MEM translates rates or percentages of weekly data into standardized ITs and has been used to compare the intensity of influenza seasons among 28 countries in Europe (13, 14). We developed IT values for the overall population and for 3 age groups separately (children, adults, and older adults) and used these values to systematically classify influenza epidemic severity into low, moderate, high, and very high for US seasons from 2003–2004 through the 2015–2016, including the 2009 pandemic.
METHODS
Data analyses
We used the R (R Foundation for Statistical Computing, Vienna, Austria) implementation of MEM (package “mem”), version 1.4, to calculate ITs for each data source. The MEM method has been described in detail previously (13, 14). Briefly, the epidemic period for each season was determined by finding the shortest duration that included the most activity. The epidemic threshold was calculated as the upper limit of a specified 1-sided confidence interval of the 30 highest values occurring before the epidemic period while the 3 ITs were estimated as the upper limits of the 50% (IT50), 90% (IT90), and 98% (IT98) 1-sided confidence interval of the geometric mean of the 30 highest values occurring during the epidemic period, using a log-normal distribution. The number of values used from each season was determined by dividing 30 by the number of seasons included in the IT analysis and rounding to the nearest integer.
We calculated ITs separately for the 3 indicators using routine surveillance data: 1) weekly percentage of patient visits for ILI from the US Outpatient Influenza-like Illness Surveillance Network (ILINet); 2) adjusted weekly rate per 100,000 population of laboratory-confirmed influenza-related hospitalizations from the Influenza Hospitalization Surveillance Network (FluSurv-NET); and 3) weekly percentage of pneumonia- and influenza-related deaths above baseline from the 122 Cities Mortality Reporting System (122 Cities) and the National Center for Health Statistics (NCHS) mortality surveillance data. The systems are described in more detail below. Thresholds were calculated for all ages and also stratified by 3 age groups: children, adults, and older adults. The division between children and adults varied among the surveillance systems because of differences in the age ranges used to collect and aggregate the data and cannot be modified; children were defined as aged 0–17 years in FluSurv-NET and NCHS mortality surveillance and aged 0–24 years old in ILINet and 122 Cities.
Data from up to 11 influenza seasons (2003–2004 influenza season through the 2014–2015 influenza season) were used to calculate the ITs, depending on data availability; we excluded data from the 2009 pandemic period because its dynamics were dissimilar from a seasonal epidemic. Data from ILINet and 122 Cities were available for all seasons. Data from FluSurv-NET became available for children during the 2003–2004 influenza season and for adults and older adults during the 2005–2006 influenza season (15). Data from NCHS became available during the 2008–2009 season.
We classified the severity of the 11 influenza seasons included in the IT calculations and pilot tested the method with out-of-sample data during the 2015–2016 influenza season. We also piloted this method on data from the 2009 pandemic period to examine its applicability to pandemic severity assessment. Severity was classified as low if at least 2 of 3 surveillance indicators peaked below their IT50 value, moderate if at least 2 peaked between their IT50 and IT90 values, high if at least 2 peaked between their IT90 and IT98 values, and very high if at least 2 peaked above their IT98 value. Expert judgement of CDC surveillance epidemiologists was used to classify severity if all 3 indicators or the 2 mortality systems crossed different ITs. Severity assessments were made overall for all ages combined and also stratified by the 3 age groups. To determine the correlations between the 3 surveillance indicators, we gave each system’s seasonal intensity a numeric score starting at 1 for seasons that did not exceed IT50 and ending at 4 for seasons that exceeded IT98. We calculated the Pearson correlation coefficient between each pair of the included surveillance systems overall and for each age group (e.g., ILINet vs. FluSurv-NET, ILINet vs. 122 Cities, FluSurv-NET vs 122 Cities). We classified correlation coefficient values of <0.40 as poor, 0.40–0.69 as good, and 0.70–1.00 as excellent.
Data sources
Outpatient illness
ILINet consists of more than 2,000 outpatient health-care providers around the country who report data to CDC weekly on the number of patients seen for ILI (defined as measured fever (≥100°F or ≥37.8°C) with cough and/or sore throat, without a known cause other than influenza) according to age group and the aggregate number of all-cause patient encounters for all ages (10). We defined children as aged 0–24 years, adults as 25–64 years, and the older adults as >64 years.
Because age-specific denominators are not available in this system, we estimated the age distribution of total visits based on practice type. Data from the NCHS’s National Ambulatory Medical Care Survey: 1999–2006 and the National Hospital Ambulatory Medical Care Survey: 1999–2007, Emergency Department Summary were used to determine the rate of physician office visits by age group and the age distribution of the population served by physicians of various practice types. An average from NCHS’s surveys from 1999–2007 was combined with each provider’s practice type (if supplied) to estimate the proportion of the site’s total patient visits that fell into the 3 age groups (16).
Hospitalization
Laboratory-confirmed influenza-associated hospitalization statistics are collected through FluSurv-NET, a collaboration between the CDC, state health departments, and academic centers. This population-based surveillance is presently conducted in more than 70 counties in 13 states (10, 15). In this data set, cases are reported according to age in years, and children are defined as aged 0–17 years, adults as 18–64 years, and older adults as >64 years. Rates were adjusted for underreporting as previously described (3, 17, 18).
Mortality
The 122 Cities Mortality Reporting System is composed of 122 cities located throughout the United States that submit weekly reports on the total number of death certificates received and the number of those for which pneumonia or influenza is listed as the underlying or contributing cause of death, by age group. The seasonal baseline of pneumonia and influenza deaths is calculated using a periodic regression model that incorporates a robust regression procedure applied to data from the previous 5 years (10). To account for changing levels of the seasonal baseline over the study period, we used the difference between the weekly percentages of deaths attributable to pneumonia and influenza and the weekly seasonal baseline to calculate the ITs; negative values resulting from this calculation were converted to zero. Weekly threshold values were constructed by adding the IT50, IT90, and IT98 values to the weekly baseline value. In this data set, children were defined as aged 0–24 years, adults as 24–64 years, and older adults as >64 years. Because the numbers of total deaths and deaths for which pneumonia or influenza was listed as the underlying or contributing cause were low for children, we used a 3-week moving average for the percentage of deaths attributable to pneumonia or influenza to calculate the ITs.
122 Cities was retired beginning with the 2016–2017 influenza season and replaced by the NCHS Mortality Surveillance System, which collects death certificate data from state vital statistics offices for virtually all deaths occurring in the United States (19). Pneumonia and influenza deaths are identified based on International Classification of Disease, Tenth Revision, codes for underlying and contributing causes of death. As in 122 Cities, a seasonal baseline was calculated for each week using a periodic regression model, the weekly percentages of deaths attributable to pneumonia and influenza were subtracted from the seasonal baseline, and weekly threshold values were constructed by adding the IT values to the seasonal baseline. In this data set, children were defined as aged 0–17 years, adults as 18–64 years, and older adults as >64 years. As above, a 3-week moving average was used for children to set the ITs. Because 122 Cities would not be available going forward, we compared intensity classifications between the 2 systems to determine whether there were meaningful differences between them.
RESULTS
Surveillance indicator ITs
Outpatient illness
From 2003–2004 to 2014–2015, the overall peak weekly ILINet percentage ranged from 2.4% to 7.7%. The overall ILINet weekly IT50 value was 4.4%, IT90 was 6.6%, and IT98 was 8.6%. ILINet threshold values were highest in children and lowest in older adults (Table 1). From 2003–2004 to 2015–2016, 6 seasons exceeded IT50, 2 seasons exceeded IT90, and no seasons exceeded IT98 (Table 2; Figure 1). These results varied by age group; children had 3 seasons that exceeded the IT90 or IT98 value (including the 2009 pandemic), adults had 0 seasons that exceeded the IT90 or IT98 value, and older adults had 2 seasons that exceeded the IT90 value (Table 2; Web Figures 1–3, available at https://academic.oup.com/aje). Overall ILINet values were aligned to each season’s start week as defined by MEM and stratified by whether ILINet exceeded the IT50 or IT90 values (Web Figure 4).
Intensity Thresholds for the Percentage of Visits to Outpatient Clinics for Influenza-Like Illness, the Rates of Influenza-Associated Hospitalizations, and the Percentage of Deaths Resulting From Pneumonia or Influenza, According to Age Group, United States, 2003–2004 through 2014–2015
| Intensity Threshold, % | Outpatient Illness | Hospitalization | Mortality | |||||
|---|---|---|---|---|---|---|---|---|
| ILINet, % | Range of Peak Values | FluSurv-NET, Adjusted Rate Per 100,000 Population | Range of Peak Values | 122 Cities, % Over Baseline | Range of Peak Values | NCHS, % Over Baseline | Range of Peak Values | |
| Overall | ||||||||
| 50 | 4.4 | 2.4–7.7 | 8.6 | 2.7–30.0 | 0.99 | 0.31–3.04 | 0.94 | 0.32–3.33 |
| 90 | 6.6 | 23.4 | 2.71 | 3.31 | ||||
| 98 | 8.6 | 42.8 | 4.97 | 7.08 | ||||
| Childrena | ||||||||
| 50 | 7.1 | 4.4–13.9 | 3.8 | 2.2–16.2 | 0.86 | 0.55–3.75 | 1.14 | 0.95–4.60 |
| 90 | 10.6 | 6.9 | 2.01 | 1.87 | ||||
| 98 | 13.5 | 9.8 | 3.34 | 2.52 | ||||
| Adultsa | ||||||||
| 50 | 2.6 | 1.3–4.26 | 3.8 | 1.1–9.3 | 1.01 | 0.67–3.85 | 0.73 | 0.41–4.42 |
| 90 | 4.4 | 9.6 | 1.94 | 3.29 | ||||
| 98 | 6.0 | 16.8 | 2.88 | 8.18 | ||||
| Older Adultsa | ||||||||
| 50 | 1.4 | 0.7–3.50 | 39.2 | 8.9–169.6 | 1.30 | 0.73–3.43 | 0.93 | 0.50–3.93 |
| 90 | 2.7 | 124.7 | 2.82 | 3.42 | ||||
| 98 | 3.9 | 250.5 | 4.51 | 7.49 | ||||
Abbreviations: 122 Cities, 122 Cities Mortality Reporting System; FluSurv-NET, Influenza Hospitalization Network; ILINet, US Outpatient Influenza-like Illness Surveillance Network; NCHS, National Center for Health Statistics Mortality Surveillance System.
a Children were defined as aged 0–17 years in FluSurv-NET and the NCHS and aged 0–24 years old in ILINet and the 122 Cities. Older adults were defined as aged >64 years.
Peak Values and Corresponding Intensity Levels for the Percentage of Visits to Outpatient Clinics for Influenza-Like Illness, the Rates of Influenza-Associated Hospitalizations, and the Percentage of Deaths Resulting From Pneumonia or Influenza, According to Age Group and Season, United States, 2003–2004 through 2015–2016
| Season | Outpatient Illness | Hospitalization | Mortality | Severity Ranking | |||||
|---|---|---|---|---|---|---|---|---|---|
| ILINet, Maximum % ILI | ITa | FluSurv-NET, Maximum Adjusted Rate | ITa | 122 Cities, Maximum % Over Baseline | ITa | NCHS, Maximum % Over Baseline | ITa | ||
| Overall | |||||||||
| 2003–2004 | 7.6 | ≥IT90 | N/A | 3.04 | ≥IT90 | N/A | High | ||
| 2004–2005 | 5.4 | ≥IT50 | N/A | 1.54 | ≥IT50 | N/A | Moderate | ||
| 2005–2006 | 3.3 | <IT50 | 7.7 | <IT50 | 0.68 | <IT50 | N/A | Low | |
| 2006–2007 | 3.6 | <IT50 | 2.7 | <IT50 | 0.50 | <IT50 | N/A | Low | |
| 2007–2008 | 6.0 | ≥IT50 | 16.4 | ≥IT50 | 1.66 | ≥IT50 | N/A | Moderate | |
| 2008–2009 | 3.6 | <IT50 | 3.8 | <IT50 | 0.62 | <IT50 | 0.41 | <IT50 | Low |
| 2009–2010 | 7.7 | ≥IT90 | 10.8 | ≥IT50 | 1.31 | ≥IT50 | 1.22 | ≥IT50 | Moderate |
| 2010–2011 | 4.6 | ≥IT50 | 9.1 | ≥IT50 | 1.40 | ≥IT50 | 1.20 | ≥IT50 | Moderate |
| 2011–2012 | 2.4 | <IT50 | 5.8 | <IT50 | 0.31 | <IT50 | 0.32 | <IT50 | Low |
| 2012–2013 | 6.1 | ≥IT50 | 24.1 | ≥IT90 | 2.45 | ≥IT50 | 3.01 | ≥IT50 | Moderate |
| 2013–2014 | 4.6 | ≥IT50 | 11.1 | ≥IT50 | 1.55 | ≥IT50 | 2.16 | ≥IT50 | Moderate |
| 2014–2015 | 6.0 | ≥IT50 | 30.0 | ≥IT90 | 2.36 | ≥IT50 | 3.33 | ≥IT90 | High |
| 2015–2016 | 3.6 | <IT50 | 11.8 | ≥IT50 | 1.04 | ≥IT50 | 0.94 | ≥IT50 | Moderate |
| Childrenb | |||||||||
| 2003–2004 | 13.9 | ≥IT98 | 12.8 | ≥IT98 | 1.04 | ≥IT50 | N/A | Very High | |
| 2004–2005 | 6.9 | <IT50 | 3.1 | <IT50 | 0.55 | <IT50 | N/A | Low | |
| 2005–2006 | 5.3 | <IT50 | 3.0 | <IT50 | 1.20 | ≥IT50 | N/A | Low | |
| 2006–2007 | 6.5 | <IT50 | 2.6 | <IT50 | 0.98 | ≥IT50 | N/A | Low | |
| 2007–2008 | 8.9 | ≥IT50 | 4.2 | ≥IT50 | 0.61 | <IT50 | N/A | Moderate | |
| 2008–2009 | 6.2 | <IT50 | 4.0 | ≥IT50 | 0.33 | <IT50 | 1.65 | ≥IT50 | Low |
| 2009–2010 | 13.7 | ≥IT98 | 16.2 | ≥IT98 | 3.75 | ≥IT98 | 4. 60 | ≥IT98 | Very High |
| 2010–2011 | 7.7 | ≥IT50 | 4.2 | ≥IT50 | 1.37 | ≥IT50 | 1.60 | ≥IT50 | Moderate |
| 2011–2012 | 4.4 | <IT50 | 2.2 | <IT50 | 0.87 | ≥IT50 | 0.95 | <IT50 | Low |
| 2012–2013 | 10.5 | ≥IT50 | 4.6 | ≥IT50 | 2.19 | ≥IT90 | 1.87 | ≥IT90 | Moderate |
| 2013–2014 | 7.6 | ≥IT50 | 4.1 | ≥IT50 | 2.09 | ≥IT90 | 1.81 | ≥IT50 | Moderate |
| 2014–2015 | 10.9 | ≥IT90 | 6.6 | ≥IT50 | 1.43 | ≥IT50 | 1.76 | ≥IT50 | Moderate |
| 2015–2016 | 5.7 | <IT50 | 4.1 | ≥IT50 | 1.23 | ≥IT50 | 0.79 | <IT50 | Low |
| Adultsb | |||||||||
| 2003–2004 | 3.9 | ≥IT50 | N/A | 1.35 | ≥IT50 | N/A | Moderate | ||
| 2004–2005 | 3.7 | ≥IT50 | N/A | 1.03 | ≥IT50 | N/A | Moderate | ||
| 2005–2006 | 2.0 | <IT50 | 2.4 | <IT50 | 0.97 | <IT50 | N/A | Low | |
| 2006–2007 | 1.7 | <IT50 | 1.1 | <IT50 | 0.80 | <IT50 | N/A | Low | |
| 2007–2008 | 3.8 | ≥IT50 | 5.2 | ≥IT50 | 1.38 | ≥IT50 | N/A | Moderate | |
| 2008–2009 | 1.7 | <IT50 | 2.2 | <IT50 | 0.67 | <IT50 | 0.26 | <IT50 | Low |
| 2009–2010 | 4.0 | ≥IT50 | 9.3 | ≥IT50 | 2.65 | ≥IT90 | 3.12 | ≥IT50 | Moderate |
| 2010–2011 | 2.6 | ≥IT50 | 5.1 | ≥IT50 | 1.54 | ≥IT50 | 1.71 | ≥IT50 | Moderate |
| 2011–2012 | 1.3 | <IT50 | 2.4 | <IT50 | 0.67 | <IT50 | 0.41 | <IT50 | Low |
| 2012–2013 | 4.3 | ≥IT50 | 8.9 | ≥IT50 | 1.38 | ≥IT50 | 1.36 | ≥IT50 | Moderate |
| 2013–2014 | 3.8 | ≥IT50 | 8.9 | ≥IT50 | 3.85 | ≥IT98 | 4.42 | ≥IT90 | Moderate |
| 2014–2015 | 4.0 | ≥IT50 | 9.2 | ≥IT50 | 1.40 | ≥IT50 | 1.14 | ≥IT50 | Moderate |
| 2015–2016 | 2.6 | ≥IT50 | 9.0 | ≥IT50 | 2.11 | ≥IT90 | 1.78 | ≥IT50 | Moderate |
| Older Adultsb | |||||||||
| 2003–2004 | 3.1 | ≥IT90 | N/A | 3.43 | ≥IT90 | N/A | High | ||
| 2004–2005 | 1.8 | ≥IT50 | N/A | 1.95 | ≥IT50 | N/A | Moderate | ||
| 2005–2006 | 1.4 | <IT50 | 41.3 | ≥IT50 | 1.15 | <IT50 | N/A | Low | |
| 2006–2007 | 1.2 | <IT50 | 13.1 | <IT50 | 0.78 | <IT50 | N/A | Low | |
| 2007–2008 | 1.9 | ≥IT50 | 90.2 | ≥IT50 | 1.98 | ≥IT50 | N/A | Moderate | |
| 2008–2009 | 0.8 | <IT50 | 12.0 | <IT50 | 0.89 | <IT50 | 0.59 | <IT50 | Low |
| 2009–2010 | 0.8 | <IT50 | 8.9 | <IT50 | 0.79 | <IT50 | 0.69 | <IT50 | Low |
| 2010–2011 | 1.1 | <IT50 | 39.9 | ≥IT50 | 1.39 | ≥IT50 | 1.05 | ≥IT50 | Moderate |
| 2011–2012 | 0.7 | <IT50 | 28.1 | <IT50 | 0.76 | <IT50 | 0.50 | <IT50 | Low |
| 2012–2013 | 2.5 | ≥IT50 | 129.1 | ≥IT90 | 3.20 | ≥IT90 | 3.51 | ≥IT90 | High |
| 2013–2014 | 1.5 | ≥IT50 | 33.7 | <IT50 | 1.06 | <IT50 | 1.46 | ≥IT50 | Moderate |
| 2014–2015 | 3.5 | ≥IT90 | 169.6 | ≥IT90 | 3.27 | ≥IT90 | 3.93 | ≥IT90 | High |
| 2015–2016 | 1.2 | <IT50 | 38.4 | <IT50 | 1.22 | <IT50 | 0.48 | <IT50 | Low |
Abbreviations: 122 Cities, 122 Cities Mortality Reporting System; FluSurv-NET, Influenza Hospitalization Network; ILINet, US Outpatient Influenza-like Illness Surveillance Network; IT, intensity threshold; N/A, not available; NCHS, National Center for Health Statistics Mortality Surveillance System.
a <IT50: system did not exceed its 50% intensity threshold during the influenza season. ≥IT50: system met or exceeded its 50% intensity threshold during the influenza season. ≥IT90: system met or exceeded its 90% intensity threshold during the influenza season. ≥IT98: system met or exceeded its 98% intensity threshold during the influenza season.
b Children were defined as aged 0–17 years in FluSurv-NET and the NCHS mortality surveillance and aged 0–24 years old in ILINet and the 122 Cities Mortality Reporting System. Older adults were defined as aged >64 years.
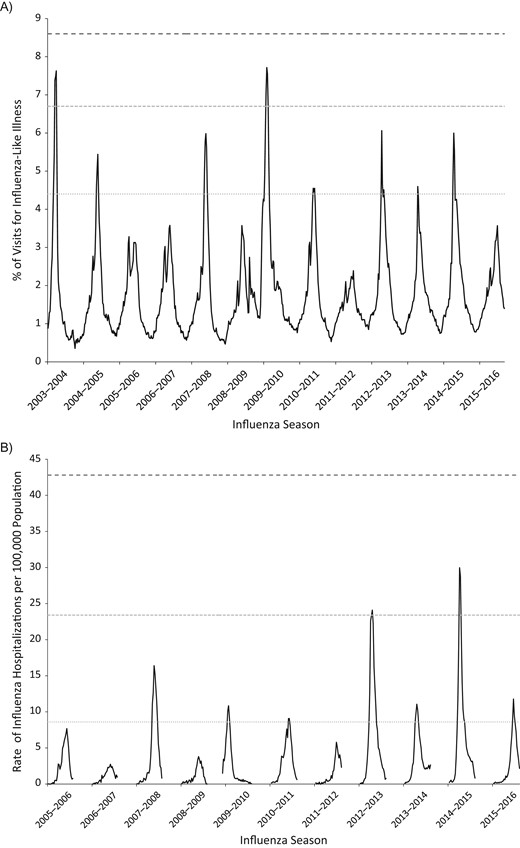
A) Percentage of visits for influenza-like illness (ILI) and corresponding intensity thresholds (ITs), according to surveillance week and season, US Outpatient Influenza-like Illness Surveillance Network (ILINet), United States, 2003–2004 through 2015–2016 influenza seasons. B) Rate of laboratory-confirmed influenza hospitalizations per 100,000 population and corresponding intensity thresholds, according to surveillance week and season, Influenza Hospitalization Network (FluSurv-NET), United States, 2005–2006 through 2015–2016 influenza seasons. Solid black line: indicator value. Light gray round dotted line: IT50. Medium gray square dotted line: IT90. Dark gray dashed line: IT98.
Hospitalization
From 2005–2006 to 2013–2014, the overall peak weekly adjusted FluSurv-NET rate per 100,000 population ranged from 2.7 to 30.0. The overall FluSurv-NET weekly IT50 value was 8.6/100,000, IT90 was 23.4, and IT98 was 42.8. FluSurv-NET threshold values were highest in older adults and lowest in children (Table 1). Overall, 5 seasons exceeded the IT50 value, 2 exceeded the IT90 value, and no seasons exceeded the IT98 value (Table 2; Figure 1). These results varied by age group; children and older adults each had 2 seasons that exceeded the IT90 or IT98 value while adults had 0 seasons that exceeded the IT90 value (Table 2; Web Figures 1–3).
Mortality
From 2003–2004 to 2014–2015, the overall peak weekly 122 Cities percentage of pneumonia and influenza deaths over baseline ranged from 0.31 to 3.04. The overall 122 Cities weekly IT50 value was 0.99%, IT90 was 2.71%, and IT98 was 4.97%. The threshold values for 122 Cities were highest in the older adult age group and lowest in the children and adult age groups (Table 1). Overall, 8 seasons exceeded the IT50 value, 1 exceeded the IT90 value, and no seasons exceeded the IT98 value (Table 2; Figure 2). These results were similar among the age groups; children, adults, and older adults each had 3 seasons that exceeded the IT90 or IT98 value (Table 2; Web Figures 1–3).
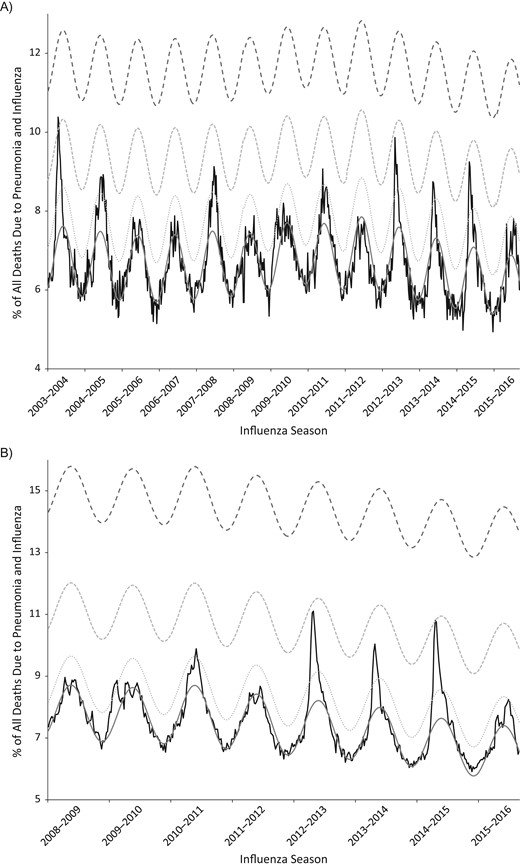
Percentage of all deaths due to pneumonia and influenza and corresponding intensity threshold (IT), according to surveillance week and season. A) 122 Cities Mortality Reporting System, United States, 2003–2004 through 2015–2016 influenza seasons. B) National Center for Health Statistics Mortality Surveillance System, United States, 2008–2009 through 2015–2016 influenza seasons. Solid black line: the indicator value. Solid gray line: the baseline. Light gray round dotted line: IT50. Medium gray square dotted line: IT90. Dark gray dashed line: IT98.
The results using the NCHS mortality data were similar to the results using the 122 Cities mortality data. From 2008–2009 to 2013–2014, the overall peak weekly NCHS percentage of pneumonia and influenza deaths over baseline ranged from 0.32 to 3.33. The overall NCHS weekly IT50 value was 0.94%, IT90 value 3.31%, and IT98 was 7.08%. NCHS threshold values were highest in the adult age group and lowest in children (Table 1). Overall, 5 seasons exceeded the IT50 value, 1 exceeded the IT90 value, and no seasons exceeded the IT98 value (Table 2; Figure 2). These results varied by age group; children had 2 seasons that exceeded the IT90 or IT98 value (including the 2009 pandemic), adults had 1 season that exceeded the IT90 value, and older adults had 2 seasons that exceeded the IT90 value (Table 2; Web Figures 1–3). During seasons in which data from both systems were available, the overall and age-specific intensity classifications were the same 72% of the time, and discordant intensity classifications between the 2 systems never differed by more than 1 category.
Correlations between the systems
The 4 systems had good to excellent correlations when compared to each other. Average correlation values were highest among adults and older adults and were lowest among the overall group and among children (Table 3). Correlation values comparing the same surveillance systems to each other were generally higher among the 3 age groups than for the overall group, although there were some exceptions (Table 3); correlation values for ILINet and FluSurv-NET comparisons to 122 Cities were much lower among children than among the overall age group. ILINet and FluSurv-NET were the most closely correlated surveillance systems among children and adults while FluSurv-Net and 122 Cities Mortality and FluSurv-Net and NCHS Mortality were the most correlated among older adults.
Pearson Correlations Between the Four Surveillance Systems Used to Calculate Intensity Levels in the United States, According to Age Group and System Comparison, United States, 2003–2004 through 2015–2016
| Surveillance System Comparison | Pearson Coefficient of Season-Specific Intensity Ranking | |||
|---|---|---|---|---|
| Overall | Childrena | Adultsa | Older Adultsa | |
| ILINet compared with FluSurv-NET | 0.65b | 0.90c | 1.0b | 0.69b |
| ILINet compared with 122 Cities | 0.83c | 0.53c | 0.76c | 0.82c |
| ILINet compared with NCHS | 0.55d | 0.81d | 0.84d | 0.85d |
| FluSurv-NET compared with 122 Cities | 0.86b | 0.48c | 0.79b | 0.93b |
| FluSurv-NET compared with NCHS | 0.88d | 0.84d | 0.84d | 0.92d |
| 122 Cities compared with NCHS | 0.84d | 0.73d | 0.92d | 0.92d |
| Average correlation | 0.77 | 0.71 | 0.86 | 0.86 |
Abbreviations: 122 Cities, 122 Cities Mortality Reporting System; FluSurv-NET, Influenza Hospitalization Network; ILINet, US Outpatient Influenza-like Illness Surveillance Network; NCHS, National Center for Health Statistics Mortality Surveillance System.
a Children were defined as aged 0–17 years in FluSurv-NET and the NCHS and aged 0–24 years old in ILINet and the 122 Cities. Older adults were defined as aged >64 years.
b Only seasons where data from both surveillance systems were available are included in the correlation value. Seasons included in comparison: 2005–2006 to 2015–2016.
c Seasons included in comparison: 2003–2004 to 2015–2016.
d Seasons included in comparison: 2008–2009 to 2015–2016.
Seasonal severity classification
Of the 13 influenza seasons overall, 4 were classified as low severity, 7 as moderate severity, 2 as high severity (2003–2004 and 2014–2015), and 0 as very high severity (Table 2; Web Table 1). Seasonal severity varied by age group. Older adults had the most seasons classified as high severity (2003–2004, 2012–2013, and 2014–2015) while children had the only 2 seasons classified as very high severity (2003–2004 and the 2009 pandemic). Adults had 0 seasons classified as high or very high severity (Table 2; Web Table 1).
DISCUSSION
This is the first systematic assessment of seasonal influenza severity in the United States using multiple routine weekly surveillance data sets in order to classify the overall impact of epidemic influenza each year. We created standardized intensity thresholds for 3 different routine surveillance systems to guide the overall classification of the severity of seasonal influenza epidemics and the 2009 pandemic for the overall US population and for 3 age groups. Because the assessments are based on data collected from national ongoing surveillance systems, they can easily and rapidly be applied to future seasons and pandemics to guide public health actions and to help tailor recommendations and communications to specific audiences in order to prevent influenza illnesses and deaths. CDC plans to use this method to classify the severity of influenza seasons going forward. Because long-term temporal trends would influence the validity of the ITs, CDC is evaluating methods to update them going forward; previous classifications of a season’s severity will not be changed.
Over the last 13 seasons, 2 seasons were classified as high severity, 7 as moderate (including the 2009 pandemic), and 4 as low for the overall US population using weekly indicators that describe the outpatient ILI visits, influenza-associated hospitalizations, and pneumonia- and influenza-related deaths. These seasonal assessments are designed to be updated throughout the influenza season and can provide public health officials and communicators with an ongoing measure of the impact of influenza, supporting the development and communication of appropriate information to reduce illness and death. For example, during seasons where ILINet exceeds the IT90 value among children, special messages directed to pediatricians or other specialty providers may be needed, while during seasons where hospitalizations and deaths exceed the IT90 value, extra efforts to increase effective influenza antiviral treatment may be warranted.
These indicators are based on peak values, which will limit their utility for preventive measures such as vaccination. Work is ongoing to determine whether there are factors or characteristics present earlier during an influenza season that can signal the potential for a season with greater severity. Initial work aligning seasons based on their start week indicates that there may be differences in the rate of the ILINet increase in years where ILINet exceeds the IT50 or IT90 value (Web Figure 4). Additionally, both of the seasons classified as high severity, 4 out of the 6 seasons classified as moderate severity (excluding the 2009 pandemic), and 2 out of the 4 seasons classified as low severity were influenza A (H3N2) predominant, suggesting that seasons may be more likely to be classified as high or moderate when influenza A (H3N2) viruses predominate (2, 5, 9, 20, 21). CDC also continues to support work that improves the science and usability of influenza forecasts with the goal of providing forecast products that health officials can use to target medical interventions, inform earlier public health actions, and allocate resources for communications and disease prevention. Since the 2013–2014 influenza season, CDC has coordinated seasonal influenza forecasting activities that define prediction targets, facilitate data access, establish evaluation metrics to assess accuracy, and develop forecast visualizations (22). These efforts provide early-season predictions for the intensity and timing of ILINet, and the addition of forecasts for FluSurv-NET hospitalization rates is being explored (23, 24).
This work shows that age stratification when assessing intensity and severity is important and generally improved the concordance between the different surveillance indicators for the season (Web Table 1). In this analysis, there were only 7 seasons out of the 13 assessed in which the overall severity assessment and the severity assessment for each age group were identical, and a majority of these seasons were classified as low severity. During 2 of the seasons, the overall assessment was classified as moderate severity while at least 1 group was classified as having a high- or very high–severity season. Therefore, assessments that are not age-stratified can obscure important differences in the variable impact of influenza on different populations during the same season. For example, the weekly rates of influenza-associated hospitalizations and pneumonia- and influenza-related deaths during the 2012–2013 influenza season exceeded the IT90 value for older adults and reached some of the highest values measured during the 13 influenza seasons included in the study. In this analysis, the 2012–2013 influenza season was classified as high severity for older adults but moderate severity overall. Communication of only the overall severity assessment could misrepresent the impact of influenza on older adults during that season and potentially prevent tailored recommendations for actions that could be taken to prevent influenza illness, hospitalization, and death.
The IT50, IT90, and IT98 values correspond to a 50% (1 in 2), 10% (1 in 10), and 2% (1 in 50) chance of exceedance during a given influenza season. Assessing and communicating risk based on the probability of occurrence from historic data has been used by the US Geological Survey and the National Flood Insurance Program as a method of placing floods of differing magnitudes into context, improving the communication and prevention of risk to life and property (12). Applying this type of risk classification to influenza epidemics and pandemics, which also have differing magnitudes, may help to more effectively communicate the risks of moderate- and high-severity influenza seasons to the public, the types of impacts that could be expected to occur, and mitigation recommendations. This assessment may also help guide decision making by allowing public health and health-care officials to weigh the costs and impacts associated with the action against the likelihood of its occurrence each influenza season. For example, the chance that the outpatient surge will exceed the IT90 value during the season is higher than the chance that the outpatient surge will exceed the IT98 value, and health-care facilities may want to consider the likelihood of the occurrence along with the magnitude when developing their surge capacity guidelines.
This analysis illustrates that no single surveillance indicator fully captures the impact of influenza on the population and that assessments of overall impact need to incorporate multiple surveillance measures. Because care-seeking for ILI has been shown to be relatively stable in the United States, ILINet can be considered a proxy for the transmissibility of the influenza virus (25–28). Therefore, seasons where ILINet exceeded the IT90 value (e.g., 2003–2004 and the 2009 pandemic) indicate years when the influenza attack rate may have been high. In contrast, the rates of influenza-associated hospitalizations and the percentage of deaths for pneumonia and influenza are a product both of the transmissibility and the clinical severity (seriousness) of influenza. Therefore, seasons with higher intensity values for hospitalization or mortality than for ILINet intensity may represent seasons that carry a higher risk of severe illness for those infected with influenza.
We used ITs that were determined using data from influenza seasons to assess the intensity and the severity of the 2009 pandemic. Seasonal influenza epidemics result in an estimated 9 million to 36 million symptomatic cases and 140,000–710,000 hospitalizations, which can exceed the number of hospitalizations estimated to have occurred during the 2009 pandemic (1, 3, 17, 18, 29, 30). The Pandemic Severity Assessment Framework was designed to incorporate multiple surveillance indicators for transmissibility and clinical severity into its overall assessment (11). This research provides a systematic and quantified way to score these values from ILINet, FluSurv-NET, and the mortality systems, allowing them to be placed into the appropriate location on the transmissibility and clinical severity scales. Assessing the intensity and severity of the 2009 pandemic with the same methodology for seasonal assessment provides a seasonal reference to the potential impacts of pandemic influenza and ensures that influenza seasons and pandemics with comparable impacts will be classified similarly.
This analysis is subject to at least one limitation beyond the limitations inherent in the surveillance data sources used, which have been described previously (10, 15, 19, 31). MEM relies on weekly values of the indicator to calculate the threshold and assign the intensity level. Other measures, such as the cumulative hospitalization rates or the estimated burden of disease, could be used instead (1, 21). A comparison of the cumulative overall FluSurv-NET hospitalization rate with the overall seasonal severity assessment indicates that the severity results using peak weekly hospitalization rates would be similar to the results using cumulative rates (Web Figure 5). Additionally, the use of weekly rates allows assessments to be made continuously throughout the season, unlike assessments based on an entire season of activity. We also explored the use of the weekly percentage of respiratory samples positive for influenza as an additional indicator but excluded it because this value is contingent on a number of factors that are not directly associated with the intensity of influenza, including changing testing recommendations, practices, quality, and volume (especially since the 2009 pandemic).
This is, to our knowledge, the first systematic classification of influenza severity in the United States using multiple influenza surveillance indicators. This method was appropriate to classify both seasonal influenza epidemics and the 2009 pandemic and to stratify by age group, which revealed important age-related differences in intraseason severity. The thresholds and severity classification methodology can be applied to weekly surveillance data during future seasons and pandemics in near real time to guide public health actions and the development of tailored recommendations to prevent influenza illnesses and death.
ACKNOWLEDGMENTS
Author affiliations: Epidemiology and Prevention Branch, Influenza Division, National Center for Immunization and Respiratory Diseases, Centers for Disease Control and Prevention, Atlanta, Georgia (Matthew Biggerstaff, Krista Kniss, Lynnette Brammer, Shikha Garg, Carrie Reed); and Influenza Division, National Center for Immunization and Respiratory Diseases, Centers for Disease Control and Prevention, Atlanta, Georgia (Daniel B. Jernigan, Joseph Bresee, Erin Burns).
This work has no funding disclosures.
We thank the participating state, territorial, and local health departments and health-care providers who contribute data to the Outpatient Influenza-like Illness Surveillance Network, Influenza-Associated Hospitalizations Surveillance, 122 Cities Mortality Reporting System, and National Center for Health Statistics Mortality Surveillance System.
Preliminary findings reported in this manuscript were presented at Options IX for the Control of Influenza, August 24–28, 2016, Chicago, Illinois.
The findings and conclusions in this report are those of the authors and do not necessarily represent the official position of the Centers for Disease Control and Prevention.
Conflict of interest: none declared.
Abbreviations
- 122 Cities
122 Cities Mortality Reporting System
- CDC
Centers for Disease Control and Prevention
- FluSurv-NET
Influenza Hospitalization Network
- ILI
influenza-like illness
- ILINet
US Outpatient Influenza-like Illness Surveillance Network
- IT
intensity threshold
- IT50
intensity threshold of 50%
- IT90
intensity threshold of 90%
- IT98
intensity threshold of 98%
- MEM
moving epidemic method
- NCHS
National Center for Health Statistics

