


Abstract
The ability to classify people according to their underlying genetic susceptibility to a disease is increasing with new knowledge, better family data, and more sophisticated risk prediction models, allowing for more effective prevention and screening. To do so, however, we need to know whether risk associations are the same for people with different genetic susceptibilities. To illustrate one way to estimate such gene-environment interactions, we used prospective data from 3 Australian family cancer cohort studies, 2 enriched for familial risk of breast cancer. There were 288 incident breast cancers in 9,126 participants from 3,222 families. We used Cox proportional hazards models to investigate whether associations of breast cancer with body mass index (BMI; weight (kg)/height (m)2) at age 18–21 years, BMI at baseline, and change in BMI differed according to genetic risk based on lifetime breast cancer risk from birth, as estimated by BOADICEA (Breast and Ovarian Analysis of Disease Incidence and Carrier Estimation Algorithm) software, adjusted for age at baseline data collection. Although no interactions were statistically significant, we have demonstrated the power with which gene-environment interactions can be investigated using a cohort enriched for persons with increased genetic risk and a continuous measure of genetic risk based on family history.
The ability to classify people according to their underlying genetic susceptibility to a specific disease is increasing with new knowledge on genetic risk factors, better family data, and more sophisticated risk prediction models. This opens up the potential for more effective prevention and screening. To do so, however, we need to know whether risk associations are the same for people with different genetic susceptibilities.
Taking breast cancer as an example, current information from mutation screening (1) and multiple markers of genetic susceptibility (including single-nucleotide polymorphisms (SNPs)) (2), especially when combined with multigenerational family cancer history (3), can be used to develop risk prediction scores with an interquartile risk ratio of 5 or more (3). The cost of measuring genetic markers is decreasing, and classification of risk is likely to improve through the use of genetic risk scores that are based on more markers, and perhaps by using alternative approaches to the usual statistical significance of individual markers to choose them.
The Breast and Ovarian Analysis of Disease Incidence and Carrier Estimation Algorithm (BOADICEA) (http://ccge.medschl.cam.ac.uk/boadicea/) estimates genetic risk of breast and ovarian cancer by modeling major genes and polygenes (3–5). BOADICEA has been shown to be well calibrated and to have good discriminatory accuracy for Australian women (6). BOADICEA is being extended to include more measured genetic and environmental or lifestyle risk factors, including mammographic density (7, 8).
A woman's risk of breast cancer depends on both her underlying genetic predisposition and some environmental and lifestyle factors she experiences during her lifetime. Few epidemiologic studies of breast cancer have measured both genetic and nongenetic risk factors comprehensively, and fewer have addressed gene-environment interactions by using global measures of genetic risk based on complex models of multigenerational family data (as distinct from considering individual measured genetic markers of risk). Moreover, previous studies of gene-environment interactions have not used samples enriched for familial risk, which limits statistical power to detect differences across the full spectrum of risk (9).
Environmental and lifestyle risk factor associations could be stronger or weaker for women at higher genetic risk of breast cancer than for women at a lower genetic risk. Such gene-environment interactions could result in substantial gradients in absolute risk for women at increased genetic risk of breast cancer and make it possible to better identify women at high risk who might benefit from additional screening or preventive measures appropriate for their risk. Finding gene-environment interactions could also show that some risk factors for women in the general population do not apply to women at high genetic risk. On the other hand, a lack of evidence for a gene-environment interaction from studies with sufficient power would mean that a modifiable risk factor for women in the general population, who are mostly at very low risk, is also important for women at the higher end of genetic risk. Either way, clarification of the issue of gene-environment interactions is important.
To illustrate one way to find evidence for gene-environment interactions, we used 3 prospective family cohorts enriched for familial risk (10) to investigate whether associations between breast cancer risk and body mass index (BMI) differ according to a woman's underlying genetic risk of breast cancer. We chose BOADICEA to estimate genetic risk because, being founded on likelihood theory, it makes optimal use of family data and can be continually updated to include new risk information, such as genetic risk scores based on SNPs. We chose BMI because it is an example of a potentially modifiable continuous risk factor for which we had 2 correlated measurements: one taken in early adulthood and one in later life. Using this example, we considered the issue of multiple risk factors and allowed for the possibility that the interactions can differ. We chose to fit multiplicative interactions to demonstrate our approach because they are standard, appreciating that other models such as those including data from SNPs could have been fitted.
METHODS
Subjects
We studied women who were unaffected by invasive breast cancer at enrollment in 3 large Australian family cancer cohort studies: the Australian Breast Cancer Family Registry (ABCFR), the Kathleen Cuningham Foundation Consortium for Research into Familial Breast Cancer (kConFab), and the Australasian Colorectal Cancer Family Registry (ACCFR).
Australian Breast Cancer Family Registry
From 1992 to 1999, probands and their relatives were recruited into the ABCFR as described previously (11–16). Briefly, probands included population-based cases who were aged less than 60 years when diagnosed with an incident first primary invasive breast cancer (identified through population-complete cancer registries); population-based controls aged less than 60 years at recruitment (identified through the electoral roll, for which registration is mandatory for Australian adults); Ashkenazi Jewish women with a family history of breast cancer; and twin pairs (identified through the Australian Twin Registry) in which one or both twins had breast cancer. Living adult first-degree relatives, aunts, and grandparents were invited to participate, and additional recruitment occurred iteratively; if identified relatives had a diagnosis of breast cancer, participation was sought from them and their first-degree relatives (13, 14).
At baseline, all participants completed an interviewer-administered risk factor questionnaire that asked about their demographic background, personal characteristics, reproductive history, environmental risk factors, lifestyle risk factors, surgeries, and personal history of breast and other cancers (12, 14). Participants were also asked to provide cancer history information on all of their first-degree and second-degree relatives (12, 14). This ensured that cancer information was obtained from multiple sources and that, for each individual, cancer history was usually self-reported or reported by a first-degree relative. Verification of cancers was sought through pathologist reviews of cancer tissue, pathology reports, cancer registries, medical records, and death certificates (12, 14).
Participants were recontacted approximately 10 years and 15 years after their baseline interview and invited to take part in the follow-up phase of the ABCFR. The follow-up questionnaires were either interviewer-administered during a telephone interview or self-administered with a telephone interview used to obtain additional details if required. The follow-up questionnaires updated the data collected in the baseline questionnaire, and participants were also asked to provide an updated cancer history for their first- and second-degree relatives and the date(s) of death for any deceased relatives. Where possible, reports of new cancer diagnoses were verified using pathology reports and medical records.
Ethics approval for the ABCFR was obtained from the human research ethics committees of the University of Melbourne and the Cancer Councils of Victoria and New South Wales. All participants provided written informed consent before taking part in the research.
Kathleen Cuningham Foundation Consortium for Research into Familial Breast Cancer
Starting in 1997, families with multiple cases of breast cancer were recruited into kConFab as described previously (17). Briefly, eligible families were identified from women undergoing clinical consultations at 24 family cancer clinics in Australia and New Zealand. Eligible families included those with a strong family history of breast or ovarian cancer or a confirmed mutation in the breast cancer 1, early-onset gene (BRCA1) or the breast cancer 2, early-onset gene (BRCA2) (18). At baseline, participants provided a blood sample for genetic analyses and completed the questionnaire used by the ABCFR (14).
Every 3 years, all female participants are invited to participate in the kConFab follow-up study, as described in detail previously (19). In kConFab follow-up, a mailed self-administered questionnaire is used to systematically update the baseline questionnaire data and information on personal cancer history, family cancer history, environmental risk factors, lifestyle risk factors, and uptake of cancer prevention and screening strategies. When possible, self-reports of new cancer diagnoses and prophylactic surgeries were verified using pathology reports and medical records.
Ethics approval for kConFab was obtained from the coordinating site at the Peter MacCallum Cancer Centre (Melbourne, Victoria, Australia) and from each of its recruitment sites. All participants provided written informed consent before taking part in the research.
Australasian Colorectal Cancer Family Registry
From 1998 to 2007, families were recruited into the ACCFR for a study of the genetic, environmental, and lifestyle factors associated with colorectal cancer, as described previously (20, 21). In brief, probands included men and women who were aged less than 60 years when diagnosed with incident first primary invasive colorectal cancer (identified from the population-complete Victorian Cancer Registry) and affected and unaffected individuals with a family history of colorectal cancer or related cancers who were recruited from family cancer clinics in Australia and New Zealand.
For all probands, their living adult first- and second-degree relatives were invited to participate. If an identified relative had a diagnosis of colorectal cancer or a related cancer, participation was sought from that person and his or her first-degree relatives.
At baseline, all participants completed a questionnaire that asked about their demographic background, personal characteristics, medical history, medication use, reproductive history (for females), physical activity, diet, smoking, alcohol use, and personal history of cancer (20). The questionnaire used by the ACCFR (22) was based on the questionnaire used by the ABCFR and kConFab. Participants were also asked to provide information on the cancer histories of all of their first- and second-degree relatives so that cancer history information was obtained from multiple sources. Verification of cancers was sought through pathology reports, medical records, cancer registries, and death certificates (20).
Participants have been followed up approximately every 5 years and asked to complete a self-administered questionnaire to update data on the information collected at baseline and to provide updated cancer histories for their first- and second-degree relatives (21, 23). Where possible, reports of new cancer diagnoses were verified using pathology reports and medical records.
Ethics approval for the ACCFR was granted by the Human Research Ethics Committee at the University of Melbourne.
Eligibility
For the present study, female ABCFR and kConFab participants were eligible if they had not been diagnosed with invasive breast cancer at baseline; they had not had a mastectomy (unilateral or bilateral) before baseline; they had not had an oophorectomy (unilateral or bilateral) before baseline; they and their family had no deleterious mutations in BRCA1, BRCA2, or the tumor protein p53 gene (TP53); and they had completed a baseline questionnaire and provided data for all of the height and weight questions. ABCFR participants were included if at least 1 member of their family had completed a follow-up questionnaire, while the kConFab participants were included if they had completed at least 1 follow-up questionnaire.
Female ACCFR participants were eligible if they had not been diagnosed with invasive breast cancer at baseline; they had completed a baseline questionnaire and provided valid data for the height and weight questions; and at least 1 member of their family had completed a follow-up questionnaire. It was not possible to exclude women who had had a mastectomy or oophorectomy before baseline because this information was not collected. The ACCFR did not test for mutations in BRCA1, BRCA2, or TP53.
Statistical analysis
On the baseline risk factor questionnaires that were completed at enrollment in the cohorts, participants were asked about their height, their current weight, and their weight when they were aged 18–21 years (or aged 20 years for the ACCFR). BMI at baseline and BMI at ages 18–21 years were calculated as current weight (kg) and weight at ages 18–21 years (kg), respectively, divided by the square of height (m2) at baseline. Because there were so few missing values for the other risk factor questions used in analyses—1 for smoking and 19 for use of hormone replacement therapy—these persons were taken to be nonsmokers and nonusers, respectively.
We considered each BMI measure separately and then together. We calculated change in BMI (from ages 18–21 years to baseline data collection) as the difference between the 2 BMI measures, and we fitted that measure alone and then combined with one or other of the 2 other measures. Note that knowing any 2 of the BMI measures defines the third.
For each eligible participant, we estimated genetic risk using BOADICEA to calculate the person's lifetime risk (from birth) of invasive breast cancer (4, 5) using baseline pedigree information from all participating and nonparticipating family members and Australian cancer incidence rates (6). To ensure that BOADICEA lifetime risk scores could be calculated for all eligible participants, missing pedigree data were imputed using a previously developed protocol (14, 24). We adjusted BOADICEA lifetime risk score for baseline age as a quadratic function because we wanted to compare women of the same age, and as a woman gets older, her living relatives also get older and her cancer family history becomes more informative.
Time in the study began at the date of the baseline interview and ended at whichever of the following came first: the last follow-up questionnaire, diagnosis of invasive breast cancer, death, mastectomy, oophorectomy, or age 80 years.
We fitted Cox proportional hazards models using age as the time axis and stratifying by age at interview in 2-year groups to estimate hazard ratios for the risk of invasive breast cancer. Because our eligible participants included families with multiple members, we calculated robust estimates of confidence intervals by clustering by family. Tests of the proportional hazards assumption were based on Schoenfeld residuals.
We tested for evidence of multiplicative gene-environment interactions using interaction terms created by multiplying each BMI measure by the BOADICEA lifetime risk score, adjusted for a quadratic function of age at baseline data collection. We then included one or both of these interaction terms in the models.
Stata, version 13 (StataCorp LP, College Station, Texas) was used for all statistical analyses (25). All statistical tests were 2-sided, and P values less than 0.05 were considered nominally statistically significant.
RESULTS
We studied 9,126 participants from 3,222 families. On average, participants were aged 45.9 years (standard deviation (SD), 15.0) at baseline and contributed 10.0 years (SD, 4.1) of follow-up time, during which 288 invasive breast cancers were diagnosed at a mean age of 56.6 years (SD, 12.3). Table 1 provides more detail on the cohort.
Characteristics of Families, Participants, and Breast Cancers in 3 Australian Family Cancer Cohorts (ABCFR, kConFab, and ACCFR), by Source of Proband, 1992–2010
| Source of Proband | No. of Families | No. of Participants | Mean (SD) No. of Participants per Family | Mean (SD) Age at Baseline, years | Mean (SD) Duration of Follow-up, years | No. of Breast Cancers | Mean (SD) Age at Diagnosis, years |
|---|---|---|---|---|---|---|---|
| ABCFR | |||||||
| Cases by age group, years | |||||||
| <40 | 418 | 1,168 | 2.8 (1.9) | 50.7 (14.9) | 14.1 (3.5) | 64 | 62.7 (11.8) |
| 40–49 | 254 | 571 | 2.2 (1.4) | 47.3 (17.6) | 13.6 (3.0) | 31 | 58.0 (13.6) |
| 50–59 | 225 | 556 | 2.5 (1.5) | 43.2 (16.8) | 14.0 (2.7) | 20 | 57.9 (12.5) |
| Population controls | |||||||
| Age group, years | |||||||
| <40 | 157 | 433 | 2.8 (1.6) | 44.2 (14.5) | 12.3 (1.9) | 12 | 51.9 (12.2) |
| 40–49 | 154 | 359 | 2.3 (1.2) | 45.6 (13.5) | 11.7 (1.9) | 9 | 58.6 (10.7) |
| 50–59 | 167 | 401 | 2.4 (1.5) | 46.3 (14.8) | 12.1 (2.0) | 10 | 61.3 (10.1) |
| Twins | 14 | 53 | 3.8 (2.4) | 45.2 (15.1) | 13.2 (2.2) | 2 | 44.5 (4.9) |
| Ashkenazi Jews | 56 | 64 | 1.1 (0.4) | 43.9 (11.4) | 15.2 (2.0) | 4 | 54.0 (9.8) |
| kConFab | 637 | 1,925 | 3.0 (2.2) | 44.6 (14.6) | 7.1 (3.3) | 80 | 52.0 (11.3) |
| ACCFR | |||||||
| Cases by age group, years | |||||||
| <45 | 246 | 566 | 2.3 (1.5) | 43.9 (14.8) | 8.0 (2.9) | 8 | 52.4 (12.5) |
| 45–59 | 437 | 1,141 | 2.6 (1.7) | 45.7 (14.5) | 8.9 (2.5) | 25 | 56.3 (11.1) |
| Clinic-based | 457 | 1,889 | 4.1 (3.4) | 45.8 (14.2) | 7.8 (3.0) | 23 | 55.4 (12.3) |
| Total | 3,222 | 9,126 | 2.8 (2.2) | 45.9 (15.0) | 10.0 (4.1) | 288 | 56.6 (12.3) |
Abbreviations: ABCFR, Australian Breast Cancer Family Registry; ACCFR, Australasian Colorectal Cancer Family Registry; kConFab, Kathleen Cuningham Foundation Consortium for Research into Familial Breast Cancer; SD, standard deviation.
Table 2 shows the distributions, unadjusted hazard ratios (and 95% confidence intervals), and P values for the participants’ baseline BOADICEA lifetime risk scores, BMI measures, and risk factor questions. For the risk factors originally measured on a continuous scale, the mean values were: 13.2% (SD, 5.5) for BOADICEA lifetime risk; 21.5 (SD, 3.6) for BMI at ages 18–21 years; 25.2 (SD, 5.4) for BMI at baseline; 3.6 (SD, 4.6) for change in BMI since ages 18–21 years; 13.0 years (SD, 1.5) for age at menarche; and 2.0 (SD, 1.7) for number of live births.
Distributions of BOADICEA Risk Scores, Body Mass Index Measures, and Responses to Risk Factor Questions in 3 Australian Family Cancer Cohorts (ABCFR, kConFab, and ACCFR) and Unadjusted Hazard Ratios for Breast Cancer According to Those Factors, 1992–2010
| Risk Factor | No. of Participants | % | Risk of Breast Cancer | ||
|---|---|---|---|---|---|
| HR | 95% CI | P Value | |||
| BOADICEA lifetime risk scorea, % | |||||
| Q1 (0.29–9.51) | 2,228 | 24.4 | 1 | Referent | |
| Q2 (9.52–11.03) | 2,301 | 25.2 | 1.01 | 0.65, 1.58 | 1.0 |
| Q3 (11.04–16.27) | 2,287 | 25.1 | 1.81 | 1.27, 2.58 | 0.001 |
| Q4 (16.28–59.09) | 2,310 | 25.3 | 2.16 | 1.52, 3.06 | <0.001 |
| BMIb at ages 18–21 yearsc | |||||
| Q1 (11.34–19.15) | 2,181 | 23.9 | 1 | Referent | 1 |
| Q2 (19.16–20.93) | 2,382 | 26.1 | 1.03 | 0.75, 1.42 | 0.8 |
| Q3 (20.94–23.06) | 2,280 | 25.0 | 0.89 | 0.64, 1.25 | 0.5 |
| Q4 (23.07–68.69) | 2,283 | 25.0 | 0.92 | 0.66, 1.30 | 0.7 |
| BMI at baselined | |||||
| Q1 (11.72–21.45) | 2,230 | 24.4 | 1 | Referent | 1 |
| Q2 (21.46–24.02) | 2,324 | 25.5 | 1.18 | 0.84, 1.66 | 0.3 |
| Q3 (24.03–27.68) | 2,276 | 24.9 | 1.34 | 0.94, 1.91 | 0.1 |
| Q4 (27.69–65.75) | 2,296 | 25.2 | 1.26 | 0.88, 1.81 | 0.2 |
| Change in BMIe | |||||
| Q1 (−45.18 to 0.39) | 2,281 | 25.0 | 1 | Referent | 1 |
| Q2 (0.40–2.71) | 2,380 | 25.0 | 1.16 | 0.78, 1.72 | 0.5 |
| Q3 (2.72–5.86) | 2,270 | 24.9 | 1.56 | 1.09, 2.24 | 0.02 |
| Q4 (5.87–40.40) | 2,295 | 25.1 | 1.52 | 1.05, 2.19 | 0.03 |
| Country of birth | |||||
| Australia | 7,430 | 81.4 | 1 | Referent | |
| Overseas | 1,693 | 18.6 | 0.79 | 0.59, 1.07 | 0.1 |
| Missing data | 3 | 0.0 | |||
| Highest level of education completed | |||||
| Year 10 | 1,908 | 20.9 | 1 | Referent | |
| Year 11–12 or vocational training | 4,216 | 46.2 | 0.91 | 0.66, 1.26 | 0.6 |
| University degree | 2,981 | 32.7 | 0.90 | 0.64, 1.27 | 0.5 |
| Missing data | 21 | 0.2 | |||
| Marital status | |||||
| Never married | 1,365 | 15.0 | 1 | Referent | |
| Married or living as married | 7,748 | 84.9 | 1.28 | 0.75, 2.17 | 0.4 |
| Missing data | 13 | 0.1 | |||
| Age at menarche, years | |||||
| <12 | 1,389 | 15.2 | 1 | Referent | |
| 12 | 1,931 | 21.2 | 1.03 | 0.71, 1.49 | 0.9 |
| 13 | 2,522 | 27.6 | 0.98 | 0.69, 1.40 | 0.9 |
| 14 | 1,762 | 19.3 | 1.03 | 0.71, 1.49 | 0.9 |
| ≥15 | 1,470 | 16.1 | 0.77 | 0.50, 1.17 | 0.2 |
| Missing data | 52 | 0.6 | |||
| Ever having been pregnant | |||||
| No | 1,865 | 20.4 | 1 | Referent | |
| Yes | 7,261 | 79.6 | 1.11 | 0.75, 1.63 | 0.6 |
| Ever having a live birth | |||||
| No | 2,267 | 24.8 | 1 | Referent | |
| Yes | 6,859 | 75.2 | 1.10 | 0.76, 1.58 | 0.6 |
| No. of live births | |||||
| 0 | 2,267 | 24.8 | 1 | Referent | |
| 1 | 946 | 10.4 | 1.19 | 0.73, 1.91 | 0.5 |
| 2 | 2,499 | 27.4 | 1.10 | 0.73, 1.65 | 0.6 |
| 3 | 1,966 | 21.5 | 1.13 | 0.75, 1.70 | 0.6 |
| ≥4 | 1,447 | 15.9 | 0.95 | 0.60, 1.50 | 0.8 |
| Missing data | 1 | 0.0 | |||
| Ever use of oral contraceptives | |||||
| No | 1,931 | 21.2 | 1 | Referent | |
| Yes | 7,192 | 78.8 | |||
| Missing data | 3 | 0.0 | 1.06 | 0.77, 1.45 | 0.7 |
| Menopause | |||||
| No | 5,465 | 59.9 | 1 | Referent | |
| Yes | 3,661 | 40.1 | 0.71 | 0.41, 1.24 | 0.2 |
| Ever use of hormone replacement therapy | |||||
| No | 7,333 | 80.4 | 1 | Referent | |
| Yes | 1,774 | 19.4 | 1.33 | 0.99, 1.77 | 0.05 |
| Missing data | 19 | 0.2 | |||
| Breast cancer in a first-degree relative | |||||
| No | 5,267 | 57.7 | 1 | Referent | |
| Yes | 3,859 | 42.3 | 1.95 | 1.52, 2.50 | <0.001 |
| Smoking | |||||
| Never smoker | 4,968 | 54.4 | 1 | Referent | |
| Past smoker | 2,557 | 28.0 | 1.08 | 0.83, 1.39 | 0.6 |
| Current smoker | 1,600 | 17.5 | 0.68 | 0.46, 1.00 | 0.05 |
| Missing data | 1 | 0.0 | |||
| Ever drinking alcohol | |||||
| No | 3,626 | 39.7 | 1 | Referent | |
| Yes | 5,496 | 60.2 | 0.95 | 0.75, 1.20 | 0.7 |
| Missing data | 4 | 0.0 | |||
Abbreviations: ABCFR, Australian Breast Cancer Family Registry; ACCFR, Australasian Colorectal Cancer Family Registry; BMI, body mass index; BOADICEA, Breast and Ovarian Analysis of Disease Incidence and Carrier Estimation Algorithm; CI, confidence interval; HR, hazard ratio; kConFab, Kathleen Cuningham Foundation Consortium for Research into Familial Breast Cancer; Q, quartile.
a BOADICEA risk score was divided into quartiles with the following median values: Q1, 9.09%; Q2, 9.86%; Q3, 13.74%; and Q4, 18.74%.
b Weight (kg)/height (m)2.
c BMI at ages 18–21 years was divided into quartiles with the following median values: Q1, 18.25; Q2, 20.20; Q3, 21.91; and Q4, 24.91.
d BMI at baseline was divided into quartiles with the following median values: Q1, 19.95; Q2, 22.66; Q3, 25.56; and Q4, 31.17.
e Change in BMI was divided into quartiles with the following median values: Q1, 0.00; Q2, 1.63; Q3, 4.06; and Q4, 8.65.
Breast cancer risk increased with unadjusted BOADICEA lifetime risk score and with having a first-degree relative with breast cancer (Table 2). The hazard ratios for the continuous measurements were: 1.24 (95% confidence interval (CI): 1.14, 1.35; P < 0.001) for each 5% increment in BOADICEA lifetime risk; 1.07 (95% CI: 0.97, 1.19; P = 0.2) for each 5-unit increment in BMI at baseline; 0.94 (95% CI: 0.79, 1.12; P = 0.5) for each 5-unit increment in BMI at ages 18–21 years; 1.13 (95% CI: 1.02, 1.26; P = 0.02) for each 5-unit change in BMI since ages 18–21 years; 0.97 (95% CI: 0.91, 1.05; P = 0.5) for each year of age at menarche; and 1.00 (95% CI: 0.92, 1.08; P = 1.0) for each live birth. We also fitted models that allowed the BMI associations to depend on age at baseline but did not find any statistically significant effect modifications (data not shown).
Table 3 shows the fits for combinations of the BMI measures, age-adjusted BOADICEA risk score, and their multiplicative interactions. Models 1–3 show that the only BMI measure associated with risk on its own was change in BMI from ages 18–21 years to baseline (P = 0.03). Model 4 shows that age-adjusted BOADICEA score was strongly associated with breast cancer risk (P < 0.001), and comparison with models 5–7 shows that this association did not change after adjusting for the BMI measures one at a time. Similarly, comparisons of models 5–7 with models 1–3 show that the BMI associations were unchanged after adjustment for age-adjusted BOADICEA score.
Adjusted Hazard Ratios for Breast Cancer According to Body Mass Index and BOADICEA Risk Score in 3 Australian Family Cancer Cohorts (ABCFR, kConFab, and ACCFR), 1992–2010
| Model and Adjustment Criteria | Risk of Breast Cancer | |||
|---|---|---|---|---|
| HRa | 95% CI | P Value | Δ LLb | |
| Model 1 | 0.17 | |||
| BMIc at ages 18–21 years (per 5-unit increment) | 0.95 | 0.80, 1.13 | 0.5 | |
| Model 2 | 0.77 | |||
| BMI at baseline (per 5-unit increment) | 1.07 | 0.97, 1.19 | 0.2 | |
| Model 3 | 1.70 | |||
| BMI changed (per 5-unit increment) | 1.13 | 1.01, 1.25 | 0.03 | |
| Model 4 | 9.61 | |||
| BOADICEA risk scoree (per 5% increment) | 1.24 | 1.14, 1.35 | <0.001 | |
| Model 5 | 9.76 | |||
| BMI at ages 18–21 years | 0.95 | 0.80, 1.13 | 0.6 | |
| BOADICEA risk score | 1.24 | 1.14, 1.35 | <0.001 | |
| Model 6 | 10.57 | |||
| BMI at baseline | 1.08 | 0.98, 1.20 | 0.1 | |
| BOADICEA risk score | 1.25 | 1.15, 1.36 | <0.001 | |
| Model 7 | 11.59 | |||
| BMI change | 1.14 | 1.02, 1.27 | 0.02 | |
| BOADICEA risk score | 1.25 | 1.15, 1.36 | <0.001 | |
| Model 8 | 10.40 | |||
| BMI at ages 18–21 years | 1.02 | 0.85, 1.24 | 0.8 | |
| BOADICEA risk score | 1.79 | 0.94, 3.43 | 0.08 | |
| BMI at 18–21 years × BOADICEA score | 0.92 | 0.78, 1.07 | 0.3 | |
| Model 9 | 11.50 | |||
| BMI at baseline | 1.14 | 1.01, 1.28 | 0.03 | |
| BOADICEA risk score | 1.70 | 1.12, 2.57 | 0.01 | |
| BMI at baseline × BOADICEA score | 0.94 | 0.87, 1.02 | 0.1 | |
| Model 10 | 11.83 | |||
| BMI change | 1.17 | 1.03, 1.33 | 0.02 | |
| BOADICEA risk score | 1.28 | 1.16, 1.42 | <0.001 | |
| BMI change × BOADICEA score | 0.97 | 0.90, 1.04 | 0.4 | |
| Model 11 | 11.64 | |||
| BMI at ages 18–21 years | 0.86 | 0.71, 1.03 | 0.1 | |
| BMI at baseline | 1.14 | 1.02, 1.27 | 0.03 | |
| BOADICEA risk score | 1.25 | 1.15, 1.36 | <0.001 | |
| Model 12 | 11.64 | |||
| BMI at ages 18–21 years | 0.97 | 0.82, 1.16 | 0.8 | |
| BMI change | 1.14 | 1.02, 1.27 | 0.03 | |
| BOADICEA risk score | 1.25 | 1.15, 1.36 | <0.001 | |
| Model 13 | 11.64 | |||
| BMI at baseline | 0.97 | 0.82, 1.16 | 0.8 | |
| BMI change | 1.17 | 0.97, 1.40 | 0.1 | |
| BOADICEA risk score | 1.25 | 1.15, 1.36 | <0.001 | |
| Model 14 | 12.69 | |||
| BMI at ages 18–21 years | 0.90 | 0.73, 1.12 | 0.3 | |
| BMI at baseline | 1.18 | 1.04, 1.34 | 0.01 | |
| BOADICEA risk score | 1.97 | 0.98, 3.96 | 0.06 | |
| BMI at 18–21 years × BOADICEA score | 0.95 | 0.81, 1.11 | 0.5 | |
| BMI at baseline × BOADICEA score | 0.95 | 0.88, 1.04 | 0.3 | |
| Model 15 | 12.69 | |||
| BMI at ages 18–21 years | 1.06 | 0.87, 1.30 | 0.6 | |
| BMI change | 1.18 | 1.04, 1.34 | 0.01 | |
| BOADICEA risk score | 1.97 | 0.98, 3.96 | 0.06 | |
| BMI at 18–21 years × BOADICEA score | 0.90 | 0.77, 1.06 | 0.2 | |
| BMI change × BOADICEA score | 0.95 | 0.88, 1.04 | 0.3 | |
| Model 16 | 12.69 | |||
| BMI at baseline | 1.06 | 0.87, 1.30 | 0.6 | |
| BMI change | 1.11 | 0.90, 1.38 | 0.3 | |
| BOADICEA risk score | 1.97 | 0.98, 3.96 | 0.06 | |
| BMI at baseline × BOADICEA score | 0.90 | 0.77, 1.06 | 0.2 | |
| BMI change × BOADICEA score | 1.05 | 0.90, 1.23 | 0.5 | |
Abbreviations: ABCFR, Australian Breast Cancer Family Registry; ACCFR, Australasian Colorectal Cancer Family Registry; BMI, body mass index; BOADICEA, Breast and Ovarian Analysis of Disease Incidence and Carrier Estimation Algorithm; CI, confidence interval; HR, hazard ratio; kConFab, Kathleen Cuningham Foundation Consortium for Research into Familial Breast Cancer; LL, log-likelihood.
a Adjusted for smoking and use of hormone replacement therapy.
b Change in LL from the base model that included smoking and use of hormone replacement therapy.
c Weight (kg)/height (m)2.
d Change in BMI from ages 18–21 years to baseline.
e Adjusted for baseline age and age2.
Models 8–10 show that there was no evidence for a multiplicative interaction between any of the BMI measures and age-adjusted BOADICEA score (all P values > 0.1).
Models 11–13 considered the pairs of BMI measures, and all 3 gave similar fits with the same associations with age-adjusted BOADICEA score. The associations with BMI at ages 18–21 years and BMI at baseline both diverged from the null when fitted together (model 11 compared with models 5 and 6). After adjustment for BMI at ages 18–21 years, both BMI at baseline and BMI change were associated with an increased risk of breast cancer (both P values = 0.03).
Models 14–16 considered the pairs of BMI measures, this time allowing for each measure to have a multiplicative interaction with age-adjusted BOADICEA score (all models gave similar fits). After adjustment for BMI at ages 18–21 years, both BMI at baseline and BMI change were associated with an increased risk of breast cancer (P = 0.04). The change in likelihood from models 11–13 to models 14–16 was not significant (P = 0.4).
We repeated the modeling shown in Table 3 after excluding women from the ACCFR who had colorectal cancer at baseline and found no change in the results (data not shown). We also repeated the modeling after stratifying by menopausal status (Table 4).
Adjusted Hazard Ratios for Breast Cancer According to Body Mass Index and BOADICEA Risk Score in 3 Australian Family Cancer Cohorts (ABCFR, kConFab, and ACCFR), by Menopausal Status, 1992–2010
| Model and Adjustment Criteria | Risk of Breast Cancer | |||||||
|---|---|---|---|---|---|---|---|---|
| Premenopausal Women | Postmenopausal Women | |||||||
| HRa | 95% CI | P Value | Δ LLb | HRa | 95% CI | P Value | Δ LLb | |
| Model 1 | 0.34 | 1.78 | ||||||
| BMIc at ages 18–21 years (per 5-unit increment) | 1.01 | 0.89, 1.36 | 0.4 | 0.76 | 0.58, 0.99 | 0.04 | ||
| Model 2 | 0.79 | 0.04 | ||||||
| BMI at baseline (per 5-unit increment) | 1.10 | 0.96, 1.26 | 0.2 | 1.03 | 0.88, 1.21 | 0.7 | ||
| Model 3 | 0.43 | 1.20 | ||||||
| BMI changed (per 5-unit increment) | 1.10 | 0.93, 1.29 | 0.3 | 1.14 | 0.99, 1.33 | 0.08 | ||
| Model 4 | 7.61 | 2.30 | ||||||
| BOADICEA risk scoree (per 5% increment) | 1.27 | 0.16, 1.40 | <0.001 | 1.20 | 1.03, 1.41 | 0.02 | ||
| Model 5 | 7.99 | 4.14 | ||||||
| BMI at ages 18–21 years | 1.11 | 0.90, 1.37 | 0.3 | 0.76 | 0.58, 0.98 | 0.04 | ||
| BOADICEA risk score | 1.26 | 1.16, 1.40 | <0.001 | 1.20 | 1.03, 1.40 | 0.02 | ||
| Model 6 | 8.64 | 2.38 | ||||||
| BMI at baseline | 1.11 | 0.97, 1.27 | 0.1 | 1.04 | 0.88, 1.22 | 0.7 | ||
| BOADICEA risk score | 1.28 | 1.16, 1.41 | <0.001 | 1.20 | 1.03, 1.41 | 0.02 | ||
| Model 7 | 8.24 | 3.64 | ||||||
| BMI change | 1.12 | 0.95, 1.31 | 0.2 | 1.15 | 0.99, 1.34 | 0.07 | ||
| BOADICEA risk score | 1.28 | 1.16, 1.41 | <0.001 | 1.21 | 1.03, 1.41 | 0.02 | ||
| Model 8 | 8.37 | 5.66 | ||||||
| BMI at ages 18–21 years | 1.12 | 0.94, 1.53 | 0.1 | 0.89 | 0.67, 1.18 | 0.4 | ||
| BOADICEA risk score | 1.74 | 0.87, 3.47 | 0.1 | 3.66 | 1.40, 9.58 | 0.008 | ||
| BMI at 18–21 years × BOADICEA score | 0.93 | 0.79, 1.09 | 0.4 | 0.76 | 0.60, 0.97 | 0.03 | ||
| Model 9 | 8.72 | 3.60 | ||||||
| BMI at baseline | 1.14 | 0.97, 1.35 | 0.1 | 1.12 | 0.94, 1.32 | 0.2 | ||
| BOADICEA risk score | 1.44 | 0.88, 2.34 | 0.1 | 2.43 | 1.12, 5.27 | 0.03 | ||
| BMI × BOADICEA score | 0.98 | 0.88, 1.08 | 0.6 | 0.87 | 0.75, 1.01 | 0.08 | ||
| Model 10 | 8.26 | 3.79 | ||||||
| BMI change | 1.10 | 0.91, 1.33 | 0.3 | 1.19 | 0.99, 1.43 | 0.07 | ||
| BOADICEA risk score | 1.27 | 1.14, 1.41 | <0.001 | 1.27 | 1.00, 1.62 | 0.05 | ||
| BMI change × BOADICEA score | 1.02 | 0.91, 1.13 | 0.8 | 0.95 | 0.83, 1.10 | 0.5 | ||
| Model 11 | 8.64 | 4.91 | ||||||
| BMI at ages 18–21 years | 0.99 | 0.77, 1.28 | 1.0 | 0.70 | 0.53, 0.92 | 0.01 | ||
| BMI at baseline | 1.12 | 0.96, 1.30 | 0.2 | 1.12 | 0.95, 1.32 | 0.2 | ||
| BOADICEA risk score | 1.28 | 1.16, 1.41 | <0.001 | 1.21 | 1.03, 1.41 | 0.02 | ||
| Model 12 | 8.64 | 4.91 | ||||||
| BMI at ages 18–21 years | 1.11 | 0.90, 1.37 | 0.3 | 0.79 | 0.60, 1.04 | 0.09 | ||
| BMI change | 1.12 | 0.96,1.30 | 0.2 | 1.12 | 0.95, 1.32 | 0.2 | ||
| BOADICEA risk score | 1.28 | 1.16,1.41 | <0.001 | 1.21 | 1.03, 1.41 | 0.02 | ||
| Model 13 | 8.64 | 4.91 | ||||||
| BMI at baseline | 1.11 | 0.90, 1.37 | 0.3 | 0.79 | 0.60, 1.04 | 0.09 | ||
| BMI change | 1.01 | 0.78, 1.29 | 1.0 | 1.42 | 1.08, 1.87 | 0.01 | ||
| BOADICEA risk score | 1.28 | 1.16, 1.41 | <0.001 | 1.21 | 1.03, 1.41 | 0.02 | ||
| Model 14 | 12.01 | 6.87 | ||||||
| BMI at ages 18–21 years | 1.08 | 0.83, 1.42 | 0.6 | 0.79 | 0.57, 1.10 | 0.2 | ||
| BMI at baseline | 1.11 | 0.92, 1.33 | 0.3 | 1.17 | 0.97, 1.42 | 0.09 | ||
| BOADICEA risk score | 1.72 | 0.83, 3.58 | 0.1 | 4.48 | 1.56, 12.90 | 0.005 | ||
| BMI at 18–21 years × BOADICEA score | 0.92 | 0.87, 1.09 | 0.4 | 0.81 | 0.63, 1.05 | 0.1 | ||
| BMI at baseline × BOADICEA score | 1.01 | 0.91, 1.12 | 0.9 | 0.91 | 0.78, 1.07 | 0.2 | ||
| Model 15 | 12.01 | 6.87 | ||||||
| BMI at ages 18–21 years | 1.20 | 0.94, 1.53 | 0.1 | 0.93 | 0.69, 1.25 | 0.6 | ||
| BMI change | 1.11 | 0.92, 1.33 | 0.3 | 1.17 | 0.97, 1.42 | 0.09 | ||
| BOADICEA risk score | 1.72 | 0.83, 3.58 | 0.1 | 4.48 | 1.56, 12.90 | 0.005 | ||
| BMI at 18–21 years × BOADICEA score | 0.93 | 0.79, 1.01 | 0.4 | 0.74 | 0.58, 0.95 | 0.02 | ||
| BMI change × BOADICEA score | 1.01 | 0.91, 1.23 | 0.9 | 0.91 | 0.78, 0.95 | 0.2 | ||
| Model 16 | 12.01 | 6.87 | ||||||
| BMI at baseline | 1.20 | 0.94, 1.53 | 0.1 | 0.93 | 0.69, 1.25 | 0.6 | ||
| BMI change | 0.92 | 0.71, 1.21 | 0.6 | 1.26 | 0.91, 1.75 | 0.2 | ||
| BOADICEA risk score | 1.72 | 0.83, 3.58 | 0.1 | 4.48 | 1.56, 12.90 | 0.005 | ||
| BMI at baseline × BOADICEA score | 0.93 | 0.79, 1.10 | 0.4 | 0.74 | 0.58, 0.95 | 0.02 | ||
| BMI change × BOADICEA score | 1.08 | 0.92, 1.28 | 0.4 | 1.23 | 0.95, 1.59 | 0.1 | ||
Abbreviations: ABCFR, Australian Breast Cancer Family Registry; ACCFR, Australasian Colorectal Cancer Family Registry; BMI, body mass index; BOADICEA, Breast and Ovarian Analysis of Disease Incidence and Carrier Estimation Algorithm (per 5%, adjusted for baseline age and age2); CI, confidence interval; HR, hazard ratio; kConFab, Kathleen Cuningham Foundation Consortium for Research into Familial Breast Cancer; LL, log-likelihood.
a Adjusted for smoking and use of hormone replacement therapy.
b Change in LL from the base model that included smoking and use of hormone replacement therapy.
c Weight (kg)/height (m)2.
d Change in BMI from ages 18–21 years to baseline.
e Adjusted for baseline age and age2.
Figures 1 and 2 show the associations predicted by the 2 interaction models (models 14 and 15) that included BMI at ages 18–21 years. Log hazard ratio estimates for both BMI measures tended to decrease with increasing age-adjusted BOADICEA score. To illustrate interpretations, ignoring the lack of statistical evidence for multiplicative interactions, the predictions from these model fits would be: 1) for women in the lower quartiles of age-adjusted BOADICEA score, after taking into account BMI at ages 18–21 years, both BMI at baseline and change in BMI were associated with an increased risk of breast cancer; and 2) for women in the upper quartile of age-adjusted BOADICEA score, BMI at ages 18–21 years was associated with a decreased risk of breast cancer.
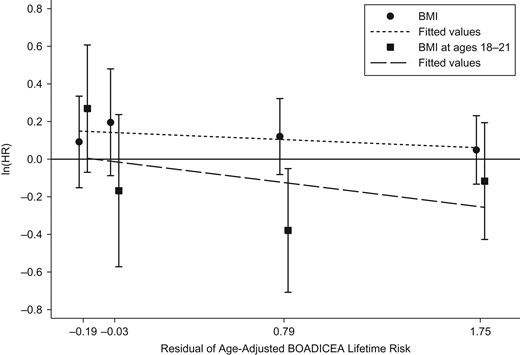
Logarithms of adjusted hazard ratios (HRs) for the risk of breast cancer according to body mass index (BMI; weight (kg)/height (m)2) at baseline (per 5-unit increment) and BMI at ages 18–21 years (per 5-unit increment) in quartiles of the residuals of age-adjusted BOADICEA lifetime risk score (from left to right, median values from quartile 1 to quartile 4), Australia, 1992–2010. Bars, 95% confidence intervals. BOADICEA, Breast and Ovarian Analysis of Disease Incidence and Carrier Estimation Algorithm.
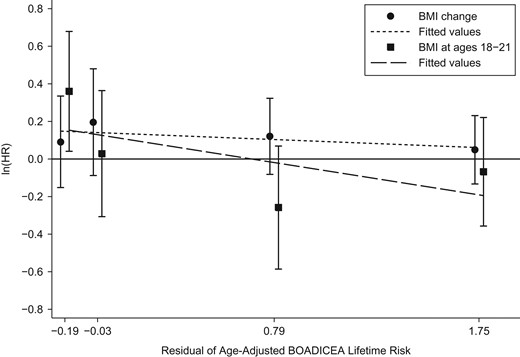
Logarithms of adjusted hazard ratios (HRs) for the risk of breast cancer according to change in body mass index (BMI; weight (kg)/height (m)2) since baseline (per 5-unit increment) and BMI at ages 18–21 years (per 5-unit increment) in quartiles of the residuals of age-adjusted BOADICEA lifetime risk score (from left to right, median values from quartile 1 to quartile 4), Australia, 1992–2010. Bars, 95% confidence intervals. BOADICEA, Breast and Ovarian Analysis of Disease Incidence and Carrier Estimation Algorithm.
DISCUSSION
These analyses show how evidence for multiplicative gene-environment interactions can be assessed using family history data to predict underlying genetic risk. Nonmultiplicative interactions or interactions involving individual SNPs could have been similarly considered by changing the model parameterization. We age-adjusted lifetime risk estimated by BOADICEA score as a surrogate for genetic risk because the lifetime risk predicted from family history increases with age and because we compared risk factors for women of the same age.
Even a null finding (not finding evidence of gene-environment interactions) is important because it could be used to support current practice, which typically assumes that the risk factors observed for the general population apply to people at high genetic risk. An increase in the absolute gradient in relative risk for people at higher genetic risk would have important implications because the gradient in absolute risk will be much greater for people at high genetic risk than it would be for the general population. A decrease in the absolute gradient in relative risk for people at higher genetic risk would also be important because this information could curtail inappropriate interventions and false advice for persons at the higher end of the risk spectrum.
Most studies of BMI and breast cancer risk use cohorts of women at average risk and have little statistical power to evaluate gene-environment interactions across the spectrum of risk. Using cohorts enriched for familial risk could help, as could better measures of family history risk and better measures of genetic risk. We used a prospective family cohort study design that provides increased information on familial and genetic risk through the study of multiple people in the same family (9). We have also used a cohort enriched for genetic risk of breast cancer through having oversampled women with a family history of breast cancer. This provides more statistical power by increasing the proportion of women at the upper end of the highly skewed genetic risk distribution. An early example of this approach in the context of a case-control study is the study by Becher et al. (26).
Our null findings should not be taken as showing that there are no multiplicative gene-environment interactions. There were 288 incident cases, so power was limited. We did not find any evidence that the BMI associations depended on age at baseline, when there is strong evidence that this is the case, at least for BMI at baseline. We did find, however, that there was evidence consistent with negative confounding between a protective association of BMI at ages 18–21 years and the opposite for BMI in later adulthood. Our measures of BMI at ages 18–21 years likely had greater imprecision than the measure of BMI at baseline, so there would have been less power to detect associations and interactions of the same magnitude for the latter BMI measure.
Our analyses can be used to predict statistical power for similarly structured cohorts. For example, the standard errors of the log hazard ratios for the BOADICEA interaction terms in Table 3 were 0.04 for models 9 and 10, so for these variables there was 80% power at the significance level of 0.05 (2-sided) to detect interactions of hazard ratio = 1.1 or more from this sample size. Given that standard errors are approximately inversely proportional to the square root of the number of incident cases, the detectable interaction hazard ratio would be 1.06 for 1,000 incident cases and 1.03 for 4,000 incident cases.
We chose BMI because it is a potentially modifiable risk factor. Having a greater BMI has been shown to be associated with an increased risk of breast cancer for postmenopausal women (27–29), especially for women who are 15 years or more postmenopause (30) or aged 60 years or older (31). For premenopausal women, the risk associated with BMI is less clear (27). In one recent meta-analysis of studies of risk for premenopausal women, Renehan et al. (29) concluded that having a greater BMI was associated with a decreased risk of breast cancer, while in another, Cheraghi et al. (28) found that the inverse risk association with BMI was not statistically significant. Greater BMI in childhood or adolescence has been found to be associated with decreased risk of both premenopausal and postmenopausal breast cancer (27), although a recent study found no evidence for an association between BMI at ages 18–21 years and postmenopausal breast cancer (32).
Given the emergence of better predictors of inherent risk through inclusion of genetic risk scores based on SNPs, the approach demonstrated here will be increasingly important, especially now that many of the major cohort studies across the world are including genetic risk measures. It is straightforward to include measured genetic risk factors in this prediction, as we have recently demonstrated (3). Genetic risk scores are likely to improve with the use of analytical approaches that focus on predicting risk (as distinct from discovering risk variants)—for example, by using different techniques for selecting SNPs, such as gene-based or pathway-based analyses of genome-wide association studies. Risk prediction will also improve by using more SNPs (33). This will all contribute to producing more power for detecting gene-environment interactions.
In summary, we have demonstrated the statistical power with which gene-environment interactions can be investigated using a cohort enriched for persons with increased genetic risk and a continuous measure of genetic risk based on family history. We plan to use the techniques described in this paper to study other potential multiplicative gene-environment interactions for breast cancer using a much larger prospective family study cohort enriched for familial risk by including families from the United States and Canada (9) and by using other cohorts from the Cancer Cohort Consortium (34). We think the approach demonstrated here is timely for the upcoming era of precision health.
ACKNOWLEDGMENTS
Author affiliations: Centre for Epidemiology and Biostatistics, Melbourne School of Population and Global Health, The University of Melbourne, Melbourne, Victoria, Australia (Gillian S. Dite, Robert J. MacInnis, Adrian Bickerstaffe, James G. Dowty, Roger L. Milne, Prue Weideman, Carmel Apicella, Graham G. Giles, Mark A. Jenkins, Kelly-Anne Phillips, Aung Ko Win, John L. Hopper); Cancer Epidemiology Centre, Cancer Council Victoria, Melbourne, Victoria, Australia (Robert J. MacInnis, Roger L. Milne, Graham G. Giles); Centre for Cancer Genetic Epidemiology, Department of Public Health and Primary Care, School of Clinical Medicine, University of Cambridge, Cambridge, United Kingdom (Antonis C. Antoniou); Division of Cancer Medicine, Peter MacCallum Cancer Centre, Melbourne, Victoria, Australia (Prue Weideman, Kelly-Anne Phillips); Department of Medicine, St. Vincent's Hospital, The University of Melbourne, Melbourne, Victoria, Australia (Kelly-Anne Phillips); Sir Peter MacCallum Department of Oncology, Peter MacCallum Cancer Centre, The University of Melbourne, Melbourne, Victoria, Australia (Kelly-Anne Phillips); Genetic Epidemiology Laboratory, Department of Pathology, School of Biomedical Sciences, The University of Melbourne, Melbourne, Victoria, Australia (Melissa C. Southey); Department of Epidemiology, Mailman School of Public Health, Columbia University, New York, New York (Mary Beth Terry); and Herbert Irving Comprehensive Cancer Center, Columbia University Medical Center, New York, New York (Mary Beth Terry).
The Australian Breast Cancer Family Registry (ABCFR) was supported in Australia by the National Health and Medical Research Council, the New South Wales Cancer Council, the Victorian Health Promotion Foundation, the Victorian Breast Cancer Research Consortium, Cancer Australia, and the National Breast Cancer Foundation. The ABCFR was also supported by the National Cancer Institute, US National Institutes of Health, under Request for Application CA-06-503 and through cooperative agreements with members of the Breast Cancer Family Registry: the University of Melbourne (Melbourne, Victoria, Australia) (grant U01 CA69638); the Fox Chase Cancer Center (Philadelphia, Pennsylvania) (grant U01 CA69631); the Huntsman Cancer Institute (Salt Lake City, Utah) (grant U01 CA69446); Columbia University (New York, New York) (grant U01 CA69398); the Cancer Prevention Institute of California (Fremont, California) (grant U01 CA69417); and Cancer Care Ontario (Toronto, Ontario, Canada) (grant U01 CA69467). The Kathleen Cuningham Foundation Consortium for Research into Familial Breast Cancer (kConFab) was supported by a grant from the Australian National Breast Cancer Foundation and previously by the National Health and Medical Research Council, the Queensland Cancer Fund, the Cancer Councils of New South Wales, Victoria, Tasmania, and South Australia, and the Cancer Foundation of Western Australia. The Australasian Colorectal Cancer Family Registry (ACCFR) was supported by grant UM1 CA167551 from the National Cancer Institute, US National Institutes of Health, and through cooperative agreements with the members and Principal Investigators of the ACCFR (grants U01 CA074778 and U01/U24 CA097735). A.K.W. is a National Health and Medical Research Council Early Career Fellow. M.A.J. is a National Health and Medical Research Council Senior Research Fellow. K.A.P. is an Australian National Breast Cancer Foundation Fellow.
We thank Prof. Margaret McCredie for her key role in the establishment and leadership of the ABCFR in Sydney, Australia. We also thank the following for their contributions to the kConFab resource: Heather Thorne, Eveline Niedermayr, and the kConFab follow-up study research nurses and staff; the kConFab investigators responsible for establishing the resource and the follow-up study (including Prof. Michael Friedlander and Dr. Sue-Anne McLachlan); and the heads and staff of the Australian and New Zealand Family Cancer Clinics.
The content of this manuscript does not necessarily reflect the views or policies of the US National Cancer Institute or any of the collaborating centers of the Breast Cancer Family Registry or the Colon Cancer Family Registry. The mention of trade names, commercial products, or organizations does not imply endorsement by the US government, the Breast Cancer Family Registry, or the Colon Cancer Family Registry.
Conflict of interest: none declared.
Abbreviations
- ABCFR
Australian Breast Cancer Family Registry
- ACCFR
Australian Colorectal Cancer Family Registry
- BMI
body mass index
- BOADICEA
Breast and Ovarian Analysis of Disease Incidence and Carrier Estimation Algorithm
- BRCA1
breast cancer 1, early-onset gene
- BRCA2
breast cancer 2, early-onset gene
- CI
confidence interval
- kConFab
Kathleen Cuningham Foundation Consortium for Research into Familial Breast Cancer
- SD
standard deviation
- SNP
single-nucleotide polymorphism
- TP53
tumor protein p53 gene

