


To study total alcohol consumption and its correlates, with an emphasis on the direction of causality.
The associations among total alcohol consumption, abstaining, alcohol dependence (AD) and heavy episodic drinking were compared in 29 Organization for Economic Cooperation and Development (OECD) countries in 2010.
Either total alcohol consumption is determined by the number of abstainers and that of alcohol dependents, or the number of alcohol dependents is determined by total alcohol consumption. The number of non-dependent heavy episodic drinkers does not play a role.
The number of alcohol dependents and abstainers seemingly determines total alcohol consumption and more efforts should be made to reduce AD.
The associations between total alcohol consumption, abstaining, alcohol dependence and heavy episodic drinking were compared in 29 OECD countries in 2010. The number of non-dependent heavy episodic drinkers does not play a role. The number of alcohol dependents and abstainers seemingly determine total alcohol consumption.
INTRODUCTION
Policy measures to reduce the level of alcohol-related harms in general populations are based on the total consumption model (Room et al., 2005). This model asserts that a country's total alcohol consumption determines the number of heavy drinkers (Bruun et al., 1975). Current policy recommendations are frequently based on this model (Anderson and Baumberg, 2006; Anderson et al., 2012). The original idea of the model, also known as the single distribution model, was based on the work of the French demographer Sully Ledermann (1915–1967) and made popular in the 1970s (for the history of the idea, see Bruun et al., 1975; Skog, 1985; Duffy and Snowdon, 2014).
Scientific evidence supporting this view mainly derives from cross-sectional studies of the shape of distribution of alcohol intake among consumers and national total alcohol consumption statistics (Bruun et al., 1975; Rossow et al., 2014). Average amount of alcohol intake (volume in the US literature) was studied, and it was found that the tail of the distribution of intake in the population, containing those who exceeded the heavy drinker criterion, was the larger the higher the per capita total consumption was. The model is weak because it only focuses on the average amount of alcohol intake and ignores alcohol dependence (AD), abstainers and drinking speed. When it was later understood that drinking speed was an important determinant of intoxication and acute harms, heavy episodic drinking (HED), also known as binge drinking, became an issue under study.
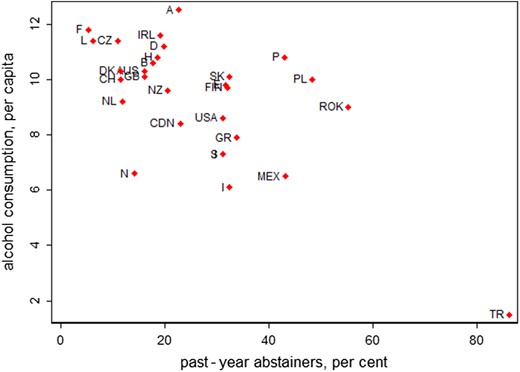
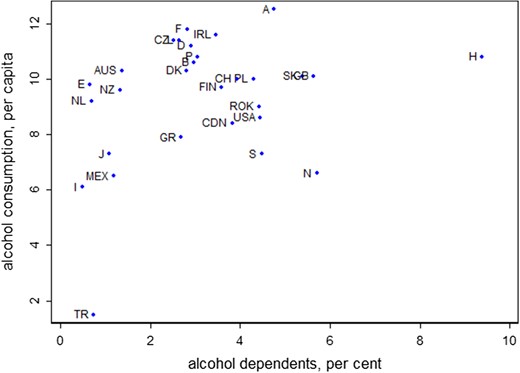
An explanation of the total consumption model assumes that social interactions between drinkers result in parallel changes at all levels of consumption; thus, higher total alcohol consumption brings about a larger number of heavy consumers and consequently more harms (Skog, 1985). Intuitively, some might think that this is not the correct causal direction. What if the proportion of various categories of drinkers and non-drinkers determines the country's total alcohol consumption? Which is the dog and which is the tail? Both directions of causality are examined below based on the cross-sectional data from 29 countries of the Organization for Economic Cooperation and Development (OECD) in 2010. To my knowledge, earlier studies have not taken into account AD, abstainers and HED.
MATERIALS AND METHODS
Data on recorded per capita alcohol consumption (litres of pure alcohol), prevalence of past 30 days HED (per cent), prevalence of past-year abstainers (per cent) and 12-month prevalence of AD (per cent), in populations 15+ years of age were extracted (September 8, 2016) from the WHO Global Health Observatory data repository (WHO, 2016). Iceland was not included because of missing data on AD. Population data were extracted for 29 member countries of OECD (2016). Population sizes were applied to calculate the respective numbers of people in various subgroups and total litres consumed in the countries under study. The number of non-dependent heavy episodic drinkers was calculated by subtracting the number of AD from that of HED. HED was defined as drinking at least 60 g or more of pure alcohol on at least one occasion in the past 30 days. All data were extracted twice, checking and correcting for possible error.
To ascertain the strength of associations, partial correlation coefficients (r), controlling for population size, were calculated. Correlations were based on total numbers. Per population data were not applied since totals divided by a common variable (such as population size) could produce spurious results in correlational and regression analysis (Kronmal, 1993). In regression analysis, population size was included as a control variable. STATA was applied for computations. All tests were two-tailed.
RESULTS
Numbers of abstainers, heavy episodic drinkers, alcohol dependents and total alcohol consumption in population 15+ years of age by country, Year 2010
| Country | Country code | Abstainers (%) | Heavy episodic drinkers (%) | Alcohol dependents (%) | Total alcohol consumption (per capita) |
|---|---|---|---|---|---|
| Australia | AUS | 16 | 10.9 | 1.5 | 10.3 |
| Austria | A | 22.6 | 40.5 | 4.9 | 12.5 |
| Belgium | B | 17.7 | 34.3 | 3.1 | 10.6 |
| Canada | CDN | 22.9 | 17.8 | 4.1 | 8.4 |
| Czech Republic | CZ | 10.9 | 38.9 | 2.6 | 11.4 |
| Denmark | DK | 11.4 | 28.5 | 2.9 | 10.3 |
| Finland | FIN | 32 | 36.5 | 3.7 | 9.7 |
| France | F | 5.2 | 29.4 | 2.9 | 11.8 |
| Germany | D | 19.7 | 12.5 | 2.9 | 11.2 |
| Greece | GR | 33.8 | 34.9 | 2.7 | 7.9 |
| Hungary | H | 18.6 | 26.3 | 9.4 | 10.8 |
| Ireland | IRL | 19.1 | 39 | 3.8 | 11.6 |
| Italy | I | 32.4 | 4.2 | 0.5 | 6.1 |
| Japan | J | 31.1 | 17.5 | 1.1 | 7.3 |
| Korea, Republic of | ROK | 55.2 | 6 | 4.7 | 9 |
| Luxembourg | L | 6.1 | 24 | 2.9 | 11.4 |
| Mexico | MEX | 43.1 | 12.1 | 1.3 | 6.5 |
| Netherlands | NL | 11.8 | 5.9 | 0.7 | 9.2 |
| New Zealand | NZ | 20.5 | 4.5 | 1.4 | 9.6 |
| Norway | N | 14.1 | 11.9 | 4.9 | 6.6 |
| Poland | PL | 48.3 | 5.3 | 4.4 | 10 |
| Portugal | P | 43 | 20.4 | 3.1 | 10.8 |
| Slovak Republic | SK | 32.4 | 28.6 | 5.5 | 10.1 |
| Spain | E | 31.7 | 13.4 | 0.7 | 9.8 |
| Sweden | S | 31.2 | 23.8 | 4.7 | 7.3 |
| Switzerland | CH | 11.5 | 18.7 | 4.2 | 10 |
| Turkey | TR | 86.2 | 0.2 | 0.8 | 1.5 |
| UK | GB | 16.1 | 28 | 5.9 | 10.1 |
| USA | USA | 31.1 | 16.9 | 4.7 | 8.6 |
Correlation coefficients (and P-values) between total alcohol consumption and size of various drinking groups in 2010a
| All 29 countries | Turkey excluded | |||
|---|---|---|---|---|
| ra | P-value | ra | P-value | |
| Non-dependent heavy episodic drinkers | 0.49 | 0.008 | 0.24 | 0.2 |
| All heavy episodic drinkers | 0.61 | 0.000 | 0.40 | 0.04 |
| Alcohol dependents | 0.54 | 0.003 | 0.50 | 0.008 |
| All 29 countries | Turkey excluded | |||
|---|---|---|---|---|
| ra | P-value | ra | P-value | |
| Non-dependent heavy episodic drinkers | 0.49 | 0.008 | 0.24 | 0.2 |
| All heavy episodic drinkers | 0.61 | 0.000 | 0.40 | 0.04 |
| Alcohol dependents | 0.54 | 0.003 | 0.50 | 0.008 |
aPartial Pearson correlation coefficients, controlling for population size, 15+ years old.
In separate regression models with one dependent variable and total alcohol consumption and population size as independent variables, total alcohol consumption was significantly related to AD (P = 0.008) and HED (P = 0.04), but not to non-dependent HED (P = 0.2). Looking at causality from the opposite direction and adding abstainers to the list of explanatory variables of the regression model showed that HED (P = 0.2) and non-dependent HED (P = 0.2) were not significant. However, abstainers and alcohol dependents remained significant in the final model (Table 3). The predictive R2 was 0.96. Differences between recorded consumption data and fitted values are shown in Table 4. The largest difference was in Luxembourg, a tiny country with a lot of visitors and cross-border shopping.
Regression of total alcohol consumption on number of 12-month alcohol dependents, past-year abstainers and 15+ year-old population size in 2010, 28 countries, Turkey excluded (R2 = 0.99)
| Independent variable | Regression coefficient | Standard error | P-value |
|---|---|---|---|
| Alcohol dependents | 32.13405 | 9.997017 | 0.004 |
| Abstainers | −9.292836 | 2.089742 | 0.000 |
| Population size | 10.0378 | 0.8290983 | 0.000 |
| Constant | 1.73e+07 | 1.14e+07 | 0.142 |
| Independent variable | Regression coefficient | Standard error | P-value |
|---|---|---|---|
| Alcohol dependents | 32.13405 | 9.997017 | 0.004 |
| Abstainers | −9.292836 | 2.089742 | 0.000 |
| Population size | 10.0378 | 0.8290983 | 0.000 |
| Constant | 1.73e+07 | 1.14e+07 | 0.142 |
Recorded alcohol consumption, per capita, and its estimates from regression analysis with number of abstainers and that of alcohol dependents as explaining variables, 29 OECD countries in 2010
| Country | Alcohol consumption (per capita) | Difference (%) | |
|---|---|---|---|
| Recorded | Estimated | ||
| Australia | 10.3 | 10.0 | 2.9 |
| Austria | 2.5 | 12.0 | −4.4 |
| Belgium | 10.6 | 11.0 | 6.6 |
| Canada | 8.4 | 9.8 | 17.0 |
| Czech Republic | 11.4 | 12.0 | 3.4 |
| Denmark | 10.3 | 14.0 | 33.0 |
| Finland | 9.7 | 12.0 | 25.0 |
| France | 11.8 | 11.0 | −8.3 |
| Germany | 11.2 | 9.4 | 16.0 |
| Greece | 7.9 | 9.6 | 21.0 |
| Hungary | 10.8 | 13.0 | 24.0 |
| Ireland | 11.6 | 14.0 | 23.0 |
| Italy | 6.1 | 7.5 | 23.0 |
| Japan | 7.3 | 7.7 | 4.9 |
| Korea, Republic of | 9.0 | 6.8 | −24.0 |
| Luxembourg | 11.4 | 52.0 | 356.0 |
| Mexico | 6.5 | 6.7 | 2.6 |
| Netherlands | 9.2 | 10.0 | 13.0 |
| New Zealand | 9.6 | 14.0 | 42.0 |
| Norway | 6.6 | 15.0 | 122.0 |
| Poland | 10.0 | 7.5 | −25.0 |
| Portugal | 10.8 | 9.0 | −17.0 |
| Slovak Republic | 10.1 | 13.0 | 25.0 |
| Spain | 9.8 | 7.8 | −21.0 |
| Sweden | 7.3 | 11.0 | 49.0 |
| Switzerland | 10.0 | 13.0 | 29.0 |
| UK | 10.1 | 11.0 | 6.7 |
| USA | 8.6 | 8.7 | 1.5 |
DISCUSSION
The aim of this study was to compare the total consumption theory and an opposite view on the direction of causality. If total alcohol consumption is the cause, as the total consumption theory claims, it seems to bring about AD. If total consumption is the outcome, then it seems to be caused by AD and abstainers. Non-dependent heavy episodic drinkers do not play a significant role in either case.
The cross-sectional design does not permit clear conclusions about the direction of causality. Skog's (1985) collectivity of drinking cultures theory is thought to support the view that total consumption determines the number of heavy drinkers. But it has not been proven. The author himself noted that ‘Whether or not the collective patterns observed in the data presently available are in fact created by the mechanisms suggested here is of course still an open question.’ So it would be better to call it a hypothesis rather than a theory. The evidence on the causal direction is contradictory (Rehm, 2014; Rossow et al., 2014). I submit that risk factors, random processes, human intentions, social interactions and perhaps other things determine abstaining and various drinking patterns in a population and bring about the total sum of sales that is then published in statistics as per capita alcohol consumption. The inputs constitute the statistical indicator.
The present findings are relevant to the efforts to reduce alcohol-attributable deaths. It has long been known that alcoholics have higher mortality than the general population (Oesterlen, 1865). Important new causally directed information is available from two follow-up studies. To my knowledge, these are the only ones that have studied both AD and other patterns of alcohol intake as the determinants of all-cause mortality. Both have shown that mortality is associated with AD but not with other patterns of drinking (Dawson, 2000; Lundin et al., 2015). This suggests that it is the number of alcohol dependents that determine, to a significant extent, the serious harm due to alcohol and also total alcohol consumption. Consequently, the relation between total consumption and harm is likely to be spurious.
Strengths and limitations are to be noted. The present study included abstainers. Studying not only drinkers but also full populations has been earlier called for (Rehm, 2014). Data consisted of a total of 1000 million inhabitants in 29 countries and the best data available from WHO, all from the year 2010. The evidence for the total consumption view is based on various population samples from different countries and calendar years that span over 50 years (Bruun et al., 1975; Skog, 1985; Rossow et al., 2014). A weakness for both views is the reliance on survey data. Such data are known to underestimate total alcohol consumption (Rossow et al., 2014), and may be influenced by social desirability (Rehm, 2014). Data on the average amounts of alcohol consumed in the drinker groups were not available, and more importantly, neither was the number of heavy drinkers defined by a certain level of average intake. The number of HED was regarded as a proxy variable. These two variables are closely related, but the relation varies depending on what operational criteria have been used in various studies and how drinking habits differ between samples. There is no uniform definition of heavy drinking. Usually heavy drinking is defined either as consumption exceeding some daily amount or as the highest consuming 5 or 10% of the population of drinkers. Heavy drinking and HED can also be joined by incorporating the frequency of HED into the algorithm to calculate average daily amount, thus forming a component in determining the number of heavy drinkers (Dawson et al., 2015). Therefore, no constant relation between these variables can be expected. The lack of data on the number of heavy drinkers would not have made much difference, since the coefficient of determination in the final regression model was 0.99 and the predictive R2 was 0.96.
CONCLUSION
The present findings do not provide a final answer to the question of the direction of causality. Do inputs bring about the end result, or is it vice versa? However, evidence seems to weigh in favour of the first and not the latter. Thus, our results and the aforementioned studies on mortality suggest that, in order to decrease alcohol-attributable deaths, the focus should be on AD rather than on total alcohol consumption. Or does the tail wag the dog?
CONFLICT OF INTEREST STATEMENT
Fee received for proof reading a report. Panimo- ja virvoitusjuoma- teollisuusliitto ry (The Federation of the Brewing and Soft Drinks Industry, Finland).
