


Abstract
Differences between individuals in correlated responses across contexts have both functional and mechanistic implications. Such syndromes may have either beneficial or harmful consequences when novel changes in the environment occur. We used wild-caught house sparrows, Passer domesticus, to test in functionally relevant circumstances, whether neophobia (initial fear of novelty), habituation, and the learning of novel cues (discriminant learning) were linked by a common underlying mechanism or reflected separate processes. We repeatedly measured individual latencies to approach and also to feed from a familiar feeding site in 3 contexts: a baseline control for mild disturbance, in the presence of a novel object and to a novel cue indicating hidden food. House sparrows on average exhibited neophobia, habituated to novel objects, and learned to associate new cues with a reward. We also found evidence for consistent individual differences in both latencies within most contexts but there was no evidence of individual differences in plasticity with repeated trials within either the novel object (habituation) or novel cue (learning) contexts. There was also little or no correlation between the 2 latencies within individuals within contexts. Individual differences in latencies to arrive at the food station exhibited strong correlations across contexts but latencies to feed were weaker. These results suggest a personality trait that exists regardless of novelty but no syndrome affecting reactions to different forms of novelty. House sparrows appear strongly plastic when responding to novel environments. Such plasticity is likely favored by the varied consequences of novelty across environments.
INTRODUCTION
Environmental change is a common challenge faced by most organisms, yet understanding the core processes influencing how they respond is difficult because change can occur across a variety of temporal and spatial scales. For individuals, sudden and local changes are a regular feature of their environment. Resources necessary for growth and reproduction may shift in both form and appearance. Familiar enemies may disappear and unfamiliar ones appear. Indeed, many types of stimuli that organisms receive from the environment may shift within an individual’s lifetime, possibly as quickly as from one moment to the next. Such changes may be considered novel if an individual has either never experienced them before (Sol et al. 2011) or they occur unexpectedly. Novelty in an organism’s environment could have any possible effect on fitness (Greenberg and Mettke-Hofmann 2001; Figure 1). For example, some types of change may be entirely neutral, having neither positive nor negative effects on fitness. Alternatively, sudden changes in environment might be harmful, perhaps because the change itself increases risk or it predicts increased risk. For example, a novel stimulus may indicate that a new type of predator is present or it could indicate a change that alters exposure to predators. Finally, some changes could be beneficial if they provide an opportunity to access new resources. A shift in the availability of different types of food or in the circumstances where food is most abundant are opportunities making novelty a potential benefit.
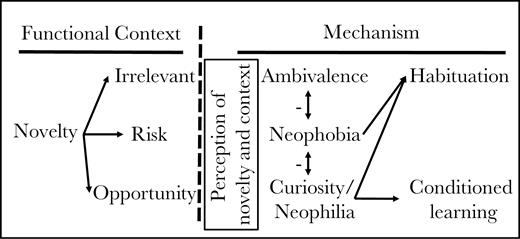
Overview of the functional consequences of novelty, the corresponding adaptive mechanisms for responding, and some nonadaptive outcomes. Any change in local environment could have either no effect on fitness (irrelevant), could reduce fitness (increase risk), or could increase fitness (new opportunity for resources). If organisms could perfectly assess these consequences, then they should respond either with ambivalence (to irrelevant novelty), neophobia (to risky novelty), or neophilia (to beneficial novelty). Because organisms are rarely perfect in their assessments, incorrect identification of novelty leads to inappropriate responses. For example, neophobia could interfere with adaptive ambivalence or with adaptive neophilia and vice-versa (indicated by vertical arrows). Habituation, the reduction in neophobia to irrelevant novelty upon repeated exposure, may be a response to inappropriate neophobia or neophilia. Conditioned or innovative learning may similarly be affected by inappropriate neophobia. Such connections between responses to novelty may be driven by common or linked programs for processing information and so could produce a syndrome structure to responses across some or all contexts. However, the impact of other contextual factors (not shown) could reduce correlations among the different responses to novelty.
The fitness consequences of natural forms of novelty should have selected for behavioral mechanisms that produce an appropriate response. For example, irrelevant novelty should be ignored. Neophobia, an avoidance response that individuals have to novel stimuli (Greenberg and Mettke-Hofmann 2001; Fox and Millam 2007; Brown et al. 2013), would be adaptive if there really was an increase in risk. Finally, beneficial novelty may be more effectively or quickly exploited if organisms investigate the change. Neophilia or the attraction to novelty per se (Greenberg 2003), could be adaptive if it leads to faster learning of new cues and better exploitation of new resources (Greenberg and Mettke-Hofmann 2001).
These mechanisms would work best if organisms were perfect assessors of change. However, the consequences of any particular type of change may be hard to discern, plus asymmetric fitness consequences of making errors (e.g., avoiding risk may have a much stronger effect on fitness than the cost of responding inappropriately to irrelevancy; e.g., Sherman et al. 1997) can lead to inappropriate responses being relatively common. For example, neophobia in reaction to irrelevant novelty often occurs, and in fact is exploited by researchers to measure boldness (e.g., Mettke-Hofmann et al. 2006; Brown et al. 2007; but see Carter et al. 2012). That such responses are not adaptive is evident from the fact that as more information becomes available over repeated exposures, individuals typically return toward ambivalence. Habituation, the decline in responsiveness to stimulus with repeated exposure (Thompson and Spencer 1966; Groves and Thompson 1970; Rankin et al. 2009), could thus be interpreted as a secondary adaptation to moderate an initially inappropriate response to that stimulus. Organisms should not, however, habituate to truly harmful novelty (Figure 1). Similarly, neophobia inappropriately applied to a beneficial stimulus might impede the ability to exploit new resources and conversely, inappropriate neophilia to harmful novelty would be quite costly (Greenberg and Mettke-Hofmann 2001; Sol et al. 2011).
How these related fitness consequences may have shaped the underlying mechanisms for assessing and responding to novelty is not known. Neophobia, habituation, and conditioned learning could be linked mechanistically for 3 reasons. First, they are all potential responses to any type of novelty and as such, the mechanisms for each begin with the initial perception of a new stimulus (Figure 1). Thus, the sensory mechanisms for detecting novel cues may impose correlated effects on all responses. Whether sensory mechanisms have effects only across large taxonomic variation (e.g., Echeverría et al. 2006, Mettke-Hofmann et al. 2013) or could explain variation among individuals is not clear. In addition, because the fitness consequences of a detected novel cue initially may be cryptic, the mechanisms for assessing the context of novelty might influence the responses regardless of the potential consequence. Finally, because the errors in classifying types of novelty can have asymmetric fitness consequences, selection for a mechanism applicable solely to one context may spillover to have effects on other contexts.
If different responses to novelty have linked mechanistic underpinnings, then they may produce domain-generality, that is, behavioral responses in different contexts have some common elements and so may exhibit similar patterns of variation. Domain generality versus domain specificity (a specific and separate mechanism or module for each behavior) is a debate currently applied mostly to human behavior (Fodor 1983; Sternberg 1999; Cosmides and Tooby 1994; Shettleworth 2000; Barrett and Kurzban 2006). However, these ideas are fundamentally related to recent research in animals on behavioral syndromes, which are correlated suites of traits that show among-individual variation (e.g., Samuels 1998; Buller and Hardcastle 2000; Sih et al. 2004; Chiappe and MacDonald 2005; Dochtermann and Jenkins 2007). Domain generality is thus a general mechanistic hypothesis underlying the existence of a behavioral syndrome, whereas domain specificity implies that each response involves separate mechanisms and exhibits independent variation.
Behavior often is a repeatedly expressed trait, so it can vary both within and among individuals in a complex hierarchical fashion (Westneat et al. 2015). For a single behavior, among-individual variation is detected when responses are measured repeatedly and indicates “personality,” consistent individual differences in behavior across conditions (Sih et al. 2004; Nussey et al. 2007; Dingemanse et al. 2010; Réale et al. 2010). Operationally, a behavioral syndrome (Sih et al. 2004) is indicated when there is among-individual covariance in 2 or more behaviors (Dingemanse and Dochtermann 2013). This among-individual covariation could exist either in the individual mean expressions of 2 traits or in the among-individual covariance in how a particular trait responds plastically to an environmental gradient in multiple contexts. A behavioral syndrome/domain general mechanism for responses to novelty would thus be manifested as a covariance among individuals in their responses to multiple types of novelty.
Among-individual variation has been documented for multiple behaviors related to novelty, such as in boldness, risk-taking, and exploration (Verbeek et al. 1994; Koolhaas et al. 1999; Boogert et al. 2006; Bókony et al. 2012). Links across contexts also have some support. For example, in black-capped chickadees (Poecile atricapillus), exploration behavior predicted performance in an acoustic discrimination task (Guillette et al. 2009). Similarly, studies have found significant correlations between neophobia or exploratory behavior and several types of learning (Webster and Lefebvre 2001; Mettke-Hofmann et al. 2006; Guillette et al. 2016; Zandberg et al. 2016). Tobler and Sandell (2007) found that increases in testosterone sped up habituation but resulted in greater neophobia in zebra finches (Taeniopygia guttata). A novelty syndrome driven by some overlap in underlying mechanism has thus garnered partial support and if it exists could have important evolutionary consequences (Dochtermann and Dingemanse 2013).
By contrast, domain specificity in responses to novelty would imply that complex forms of phenotypic plasticity exist and that multiple cues may be used to assess the type of novelty. Phenotypic plasticity, whereby the phenotype expressed by a genotype (or individual) varies across a range of environments (Woltereck 1909; Bradshaw 1965; Pigliucci 2001), is common throughout all organisms and all phenotypes ranging from gene regulation up through various complex individual behaviors (e.g., West-Eberhard 1989; Pigliucci 2001). Domain-specific plasticity in response to novelty could evolve if the impact of novelty varies across a complex mix of conditions (Heinrich 1995; Shettleworth 2001; Greenberg and Mettke-Hofmann 2001; Mettke-Hofmann et al. 2006; Scales et al. 2011; Shaw 2017). Operationally, domain specificity is implicated if covariances in responses among individuals are weak or lacking, and the majority of behavioral variation, assuming minimal measurement error, occurs within individuals and within contexts. This would imply that individuals are responding flexibly to the differences between contexts.
We tested the hypothesis that responses to several forms of novelty experienced during foraging by captive house sparrows (Passer domesticus) exist as syndromes. The house sparrow is a songbird whose success as an invasive species has been attributed in part to their behavioral flexibility in foraging and innovation (Sol et al. 2002; Martin and Fitzgerald 2005). For example, wild house sparrows have learned to open automatic doors (Breitwisch and Breitwisch 1991), forage from the grills of cars (Simmons 1984), and pry bark off trees to find insects (Lowther and Cink 2006). Previous studies have also found that house sparrows exhibit population and individual differences in neophobia, habituation and innovative learning in novel contexts (Martin and Fitzgerald 2005; Katsnelson et al. 2010; Ensminger and Westneat 2012; Bókony et al. 2012; Vincze et al. 2016). Bókony et al. (2012) uncovered correlations between responses to several types of novelty, suggesting a possible syndrome but due to the nature of sampling, could not distinguish within-individual from among-individual processes. Here, we repeatedly measured the fitness-relevant traits of time to approach a food source and time to begin feeding, both within individuals and within 3 contexts; a mild disturbance, exposure to 2 novel objects, and exposure to 2 conditions in a discriminant learning set-up. Each of these contexts are general situations free-living sparrows regularly encounter in the wild. If responding to novelty is domain-general, then response to a mild disturbance, neophobia, habituation, and acquisition speed of discriminant learning should covary among individuals, implying a syndrome that might constrain adaptive responses in some circumstances, whereas no covariation would support domain specificity for responses to novelty.
METHODS
Subjects and acclimation
We assessed response to several kinds of novelty using captive house sparrows in fall 2013 and 2014 at the University of Kentucky’s Ecological Research and Education Center (EREC). This site contains 15 outdoor aviaries (3.7 × 2.4 × 2.4 m), each having a wooden frame with hardware cloth (wire mesh 1 × 1 cm) used to enclose them on all sides. The aviaries were grouped into clusters of 2–4, connected by a center chamber with a window looking into each aviary. In each central window, we placed tripods and cameras to record foraging behavior.
We captured adult house sparrows in seed-baited cage traps and mist nets from a rural population at the University of Kentucky’s Agricultural Experiment Station, located north of Lexington, KY (38°06′N, 84°29′W). We placed a Fish and Wildlife metal band and up to 3 colored plastic bands in a unique combination on any unbanded bird so they could be easily identified by sight. If an individual had been previously banded, we recorded their band combination and band number. No individual had been part of any previous captive studies. We transported subjects to the EREC aviaries shortly after capture. A total of 43 sparrows were tested and all were returned to the site of capture within 1 month of being caught. We placed each subject in a separate aviary, which included a tree, a sand dish, a water dish, and a food platform; the platform consisted of a 23 cm by 47 cm board with 18 3.5-cm diameter holes cut into the flat side (see Figure 2). The holes were arranged in a 6 × 3 pattern and each contained a 1.5 oz. plastic cup. We allowed subjects to acclimate to the aviary and the food board for 5 days. During this time, we placed food (white millet) in every other well of the food board and switched to the other cups every other day.
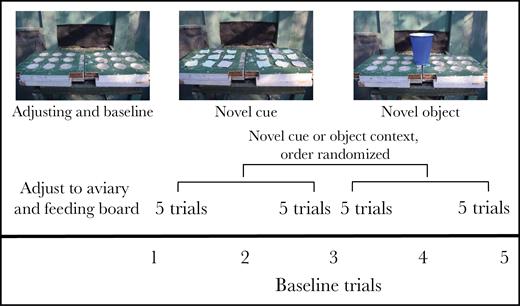
Overview of experimental setting and organization of trials. All data collection focused on subjects arriving at the feeding board (latency to board) or feeding from the board (latency from board to feed) that was present in all trials. Baseline trials (using board depicted at left) were interspersed among all other trials as indicated at the bottom. The order of novel object trials (set of 10 trials with series of 5 for each of 2 objects, one of which is shown in right-hand picture) and novel cue trials (example in center picture) was randomized in blocks of 10 trials. The first 5 novel cue trials were preceded by trials designed to train subjects to look for food under lids (not shown).
Experiments
Once birds were acclimated, we conducted 3 types of experiments in a semirandomized order. We conducted all trials similarly: We deprived the subject for 1 h, followed by an experimental trial (described below) in which we video-recorded behavior for 1 h. We then restored the food using the baseline condition (see below) allowing individuals easy access for at least 90 min before starting another trial. At most, subjects received 3 trials in 1 day. The majority of trials (53%) in the novel object or novel cue contexts were separated by less than 5 h and 42% were done the following day. Of the 133 bouts of 5 trials completed in these 2 contexts, 75% were done in 3 days or less.
Baseline
One set of trials was called “baseline” (n = 5); after deprivation, we replaced the food board and started the camera. These trials serve as a control for deprivation and disturbance common to all trials and they also allow assessment of individual differences in response to a mild, repeated but unpredictable disturbance. Once birds were acclimated to the aviary, the first trial they experienced was a baseline. The additional baseline trials were interspersed between each subsequent group of 5 trials in the other treatments and also the last trial overall (see Figure 2).
Novel object
We randomized whether novel object trials or the novel cue trials (below) followed the first baseline trial. For the novel object trials, we tested subject reactions to each of 2 objects on their food board that the birds had not previously experienced in captivity: an 18 ounce blue plastic cup (with weights inside to keep upright; Figure 2) and a 16 ounce clear glass jar. We followed the same procedure as with baseline trials except we placed the novel object in the center of the food board and located the food in the 3 wells immediately on either side of the object. We removed the object after each 1 h trial. We tested subjects with the same novel object for 5 consecutive trials but we randomized the order of which novel object was first, which allowed us to assess order and object effects separately. We inserted a baseline trial after the first set of novel object trials and then conducted the second set with the other object.
Novel cue
To assess differences in the abilities of adult sparrows to learn the distinction between a rewarded cue and a nonrewarded one, we conducted 2 conditioning experiments using colored lids on the feeding wells. Individuals were first trained to locate food under covers (pieces of 4 × 4 cm pieces of paper attached to a disk of cardboard that fitted into the plastic cups and covered the contents). We trained subjects before the first set of novel cue trials by conducting training trials with white covers on all cups, all of which had food. Training occurred in 2 stages. The first consisted of covers that we placed over half of each cup. Once individuals learned to feed, usually by pushing the cover out of the way, we then placed covers completely over the cups and tested individuals with 5 trials. An individual was considered successfully trained when it had removed a least one cover and fed in 2 successive trials. Two individuals did not complete the second training stage within 5 trials and were not used in analysis of the novel cue context or the tests of cross-context covariances.
We exposed trained subjects to covers of green and purple, with 4 randomly placed green covers covering food and 14 purple covers over foodless wells (Figure 2). Each individual received this color combination first and was tested in 5 successive trials with food location varying across trials and all individuals receiving the same sequence of locations. At the end of these 5 trials, we then gave subjects a single baseline trial followed by a reversal learning set-up with the colors reversed in both number and reward (i.e., 4 purple covers indicated food) for 5 trials. We similarly randomized the location of food across trials but gave all subjects the same board arrangements.
Video scoring
We scored the videos of all trials after they had been completed for a given season. Because the set-up was obvious in the video but the order of presentation was not, videos were scored semiblindly. All time variables were recorded in seconds. The scorer noted the time the experimenter closed the aviary door after the food board was returned to the aviary, the time a bird first landed on the food board, the time a bird left the food board, and the time at which feeding first occurred.
Statistical analysis
For foraging birds, the most salient measures across all these trials are latencies, because longer latencies will reduce the rate of food intake. Moreover, latencies can be measured in all trial types. Thus, for each trial, we extracted “Latency to board” (LTB), calculated as the elapsed time after the experimenter left the aviary until the subject bird first landed on the food board and “Latency from board to feed” (BTF), calculated from the time a bird first landed on the food board until it fed. These represent separate but linked timing variables that could be correlated or not both within or among individuals. Both response measurements were log transformed (base 10) to better fit a normal distribution. We used Proc Mixed and Proc Glimmix in SAS 9.4 (SAS Institute Inc., Cary, NC) to create linear mixed models to estimate the variance within and among individuals in each novelty context (Ensminger and Westneat 2012; Wetzel and Westneat 2014) and to test their significance.
Our initial analysis of each dependent trait was designed to create a best fit model that accounted for external sources of among-individual variance we could not control otherwise. Because no hypothesis was being tested using these variables, we employed backwards elimination and we successively removed those terms with the smallest F value and a P value greater than 0.05. In each model, we included the fixed effects of sex, block (the set of birds across aviaries that were tested together, n = 3), and the among-subject mean-centered covariates of start time, temperature, and date in the season (Supplementary Material, Supplementary Table S1). For tests involving a novel object, the object order (first or second object) and the object type (cup or jar) were included, whereas the association test had an additional fixed effect of color order.
Once we had a best fit “background” model, we applied the following phenotypic equation to the 5 baseline trials, the 10 novel object trials, and the 10 novel cue trials separately:
where the response (logged latency to board or logged latency from board to feed) of the jth individual at the ith instant (i.e., observation) is the sum of β0 (the mean population response) and indoj (deviation of the jth individual’s average response) plus (β1 + ind1j)(Prior trials), the population slope and the individual’s deviation in slope as measured over the number of prior trials, and lastly eij, the residual deviation from the reaction norm of the ith expression of individual j’s phenotype (Dingemanse and Dochtermann 2013). The term “covariates” included any environmental variable (either continuous or categorical) found to be retained in the process of generating a best fit model (above). Eventually, we also included trial order to specifically test for effects of repeated exposure. We assigned trials (n = 24) in which subjects never landed on the board a latency of the full observation time and left latency from board to feed missing. Trials (n = 49) in which subjects landed on the board but never fed were scored as having a latency from board to feed as if they fed at the end of the observation. Omitting these truncated data had only minor effects on the main results (see Supplementary Material, Supplementary Tables S2 and S3). Among-individual variation (personality) is indicated by a significant random effect of individual (i.e., V(ind0)) at the intercept of the equation, which was estimated at the first trial in each run of 5 trials. To test for significant random intercept variance, we compared models with and without the random effect of individual identity using a likelihood ratio test (LRT; Pinheiro and Bates 2000; Zuur et al. 2009). Repeatability was then calculated as the proportion of total variation that was among individuals, controlling for the variables included in the best fit background model.
We assessed the main responses to novelty (e.g., neophobia, habituation, and discriminant learning) via slope terms with respect to trial type or order. Habituation and conditioned learning were measured with respect to number of prior trials. A significant population mean slope would indicate that sparrows exhibit these responses but we were especially interested in among-individual variance in slopes. We used the likelihood ratio test to compare models with the random effects of individual intercepts and a model with the random effect of individual slopes plus the covariance between slope and intercept, with df = 2.
To assess neophobia, we compared the behavior of subjects in baseline trials 2–5 (see results for explanation) with their behavior in the first trial of each novel object presentation. We coded a variable called “Object” in 2 ways. First, we gave baseline trials a value of −0.5 and the novel object trials the value 0.5 so the intercept would be between the 2 groups and slope would equal the difference between the 2 groups. To assess whether behavior during baseline trials predicted the response to the novel object, we coded baseline trials as 0 and novel objects as 1 so that intercept variance would be estimated during the baseline and the slope–intercept covariance would address the question of linkage between the 2 contexts. The equation to assess neophobia appeared as:
In this case the response (latency to board or latency from board to feed) was measured across the environmental gradient of the presence or absence of an object. Individual variation in neophobia is thus indicated by a significant among-individual variation in slope. Significant variance in intercepts alone when object was coded as −0.5 or 0.5 would suggest variation in the tendency to leave refuge and forage regardless of the presence or absence of the novel object (Ensminger and Westneat 2012). We added covariates or factors (i.e., object type) to the above equation to test for an average effect.
We assessed if subjects learned to discriminate between the rewarded and unrewarded novel cues in 2 ways. First, we used number of incorrect lid flips as the response variable and assessed if the probability of an error declined with trial order. This was tested using a generalized linear model with a logit link and a negative binomial function in SAS GLIMMIX. Second, we modeled both latencies using equation 1 and inferred a significant decline in latency over repeated trials to indicate conditioned learning. We included a factor of whether the trials were in the acquisition phase or the reversal phase.
A syndrome or domain generality would be implicated if individuals responded similarly in different contexts, primarily indicated by covariation among slopes. In the end (see results), we tested for 3 types of covariances among individual intercepts in order to assess if subjects’ average behavior correlated across contexts. The first was the within-individual covariance between latency to board and board to feed, which we estimated within the models listed below in the repeated portion of the model (see Supplementary Table S6). A second type of covariance was that observed between the individual means of each latency, estimated as an among-individual covariance but within the same context. In equation form:
where
and where the context (c) for individual (j) at instance (i) for the 2 phenotypic traits is indicated with subscripts. Multivariate models have individual responses that are not independent and thus have a variance-covariance structure (Ωe) that separates within-individual variance ( and ) from covariance () (Dingemanse and Dochtermann 2013). We ran these bivariate models for each of the 3 contexts; the 5 baseline trials, the 10 novel object trials, and the 10 color association trials with and without number of prior trials as a covariate. We used a likelihood ratio test to test for significance of a given covariance.
We also estimated within-trait but across-context and among-individual covariances in intercepts, using 2 tri-variate mixed models in which the same response (R) measured in each context (C1, C2, and C3 indicating baseline, novel object, and novel cue, respectively) was treated as a different trait:
where
With this analysis, we assessed whether individuals exhibited similar intercepts relative to other individuals across the 3 contexts. Significance of the covariances for each response variable (logLTB and logBTF) was tested against a model with these set at 0 using a likelihood ratio test with 3 df. Finally, we attempted to analyze the same model as above with random slopes with respect to number of previous trials included. This model failed to converge and so we ran a bivariate model in which both response traits were assessed without respect to context and both random intercepts and random slopes with respect to prior trials were included.
All values presented in the text or in tables are means ± SE. Significance levels were 2-tailed with an α of less than 0.05 unless otherwise stated. Sample sizes varied among tests due to some trials being omitted because latency could not be known (see above), problems with the video camera in some contexts, and errors in setting up the boards (novel cue trials, n = 2 subjects).
RESULTS
Average responses
In the baseline trials, on average, the time it took sparrows to land on the experimental board (logLTB) declined over repeated trials (Table 1) but there was no change in their subsequent latency to feed (logBTF) over successive trials (Table 1). The effect on time to the board was due to the first trial (the first trial overall that a bird experienced) being 0.8 ± 0.1 log seconds longer than all subsequent trials in the baseline context (t = 7.1, df = 115, P < 0.0001). Analysis of the subsequent 4 trials revealed no effect of trial order (−0.02 ± 0.05, F1,28.7 = 0.3, P = 0.60). Block, mean date, and mean temperature affected logLTB (Supplementary Table S1) but not logBTF.
Average effect over all subjects of trial order on latency to board and latency from board to feed of captive house sparrows in 3 contexts
| Response | Context | Estimate ± SE | F value | dfa | P value |
|---|---|---|---|---|---|
| Latency to board | Baseline | −0.17 ± 0.03 | 21.7 | 28 | <0.0001 |
| Board to feed | Baseline | −0.06 ± 0.03 | 2.9 | 115 | 0.09 |
| Latency to board | Novel object | −0.08 ± 0.02 | 10.0 | 39.6 | 0.003 |
| Board to feed | Novel object | −0.14 ± 0.03 | 22.0 | 34.2 | <0.0001 |
| Latency to board | Novel cue | −0.01 ± 0.02 | 0.2 | 32.2 | 0.62 |
| Board to feed | Novel cue | −0.22 ± 0.03 | 49.2 | 34.5 | <0.0001 |
Model included random effect of individual and the individual by trial order (random slope) term (see also Supplementary Table S2). df are calculated using the Kenward–Roger method, which adjusts for the random effects.
We found a significant average increase in both latencies in response to the appearance of a novel object (Figure 3a,b). We found no effect of object order or type of novel object on either latency (all P > 0.05). During the repeated trials of the same novel object (combining both objects), both latencies declined significantly with trial order (Table 1, Figure 4a, b) indicating habituation to the irrelevant novelty. Latency to the board was influenced by experimental block and mean start time and latency from board to feed was affected by block, start time, and mean temperature (Supplementary Table S1). The number of hours that elapsed between trials significantly increased logLTB (0.007 ± 0.002, F1,217 = 8.3, P = 0.004) but not logBTF (−0.001 ± 0.002, F1,192 = 0.3, P = 0.61).
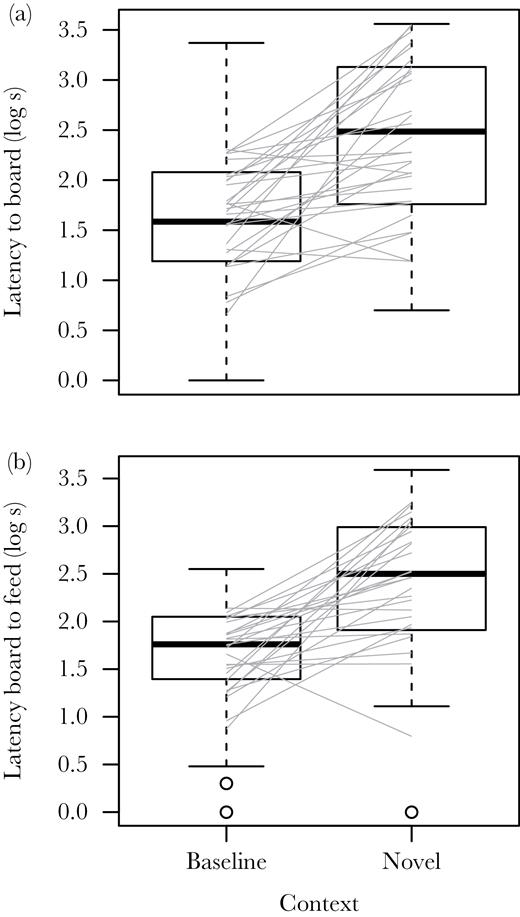
Box plots and estimated individual reaction norms (gray lines) for 2 measures of the behavior of captive house sparrows (n = 29) compared between trials 2–5 of the baseline context and the first trials of each object in the novel object experiment. (a) The latency from the start of the trial to when the subject arrived at the board and (b) the latency from arrival at the board to first feed from the board. The mean response was significant (logLTB: 0.78 ± 0.14, F1, 28.6 = 30.9, P < 0.0001; logBTF: 0.80 ± 0.13, F1, 25.6 = 37.7, P < 0.0001) and the among-individual variation in response for both latencies were different from 0 (Table 3).
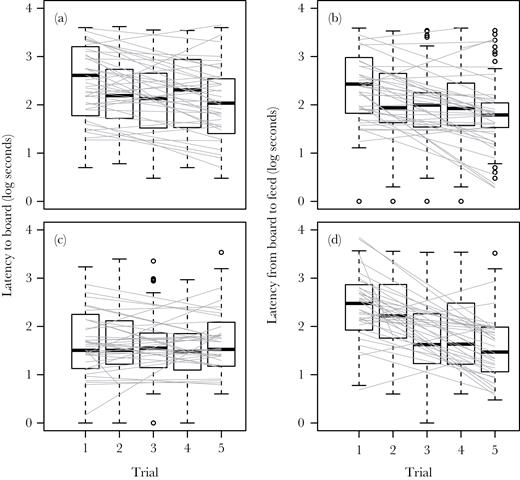
Box plots and estimated individual reaction norms (gray lines) for 2 measures of captive house sparrow behavior (n = 36) in 2 contexts over repeated trials. (a, c) The latency from the start of the trial to when the subject arrived at the board and (b, d) the latency from arrival at the board to first feed from the board. (a, b) Behavior seen during the novel object trials, lumping both objects. (c, d) Behavior observed during the novel cue trials combining the acquisition and reversal phases. Mean responses significantly declined with trial except in panel C (Table 1), among-individual variance in intercept was significant (Table 2), and among-individual variance in slope was not significant (Table 3) in each panel.
In the novel cue context (including both set-ups), subjects showed a significant decline in errors (pecking at or removing covers of the incorrect color) with trial order (GLMM with negative binomial; −0.48 ± 0.05, F1,296 = 107, P < 0.0001), indicating that discriminant learning occurred. We also found a significant positive relationship between the latency to feed once on the board and the number of incorrect covers flipped (0.07 ± 0.006, F1,314 = 122.6, P < 0.0001). Trial order had no effect on the latency to arrive at the board but had a significant negative effect on time to feed after landing on the board (Table 1, Figure 4c, d). We found no significant difference for either latency between the acquisition and reversal phases (logLTB: −0.25 ± 0.13, F1,336 = 3.8, P = 0.053; logBTF: −0.002 ± 0.14, F1,332 = 0.0, P = 0.99) nor was there a significant impact of phase on the effect of trial order (logLTB: 0.10 ± 0.05, F1,336 = 3.6, P = 0.058; logBTF: 0.06 ± 0.06, F1,332 = 1.2, P = 0.26). The elapsed time between trials had no effect on either latency (logLTB: 0.01 ± 0.03, F1,233 = 0.6, P = 0.44; LogBTF: 0.0005 ± 0.003, F1,229 = 0.04, P = 0.85).
Among-individual variation within contexts
Within contexts and traits, subjects could exhibit among-individual variation in either intercept (expected value at the first trial) or in slope with respect to trial order. We found significant among-individual variance in intercepts for both latencies in the novel object and novel cue trials. We also found significant among individual variance in intercepts in baseline trials for logLTB but not logBTF (Table 2).
Within context among-individual variance in intercepts determined as the random effect of individual in random regression models for each of 2 responses and in 4 contexts.
| Response (covariate) | Context | Variance ± SE | χ2a | P value | Repeatabilityb |
|---|---|---|---|---|---|
| Latency to board (block, date, temperature) | Baseline | 0.09 ± 0.09 | 13.1 | 0.0003 | 0.18 |
| Board to feed (block) | Baseline | 0.007 ± 0.05 | 0.01 | 0.92 | 0.02 |
| Latency to board (block, date, temperature) | Baseline to novel object | 0.18 ± 0.07 | 15.9 | <0.0001 | 0.29 |
| Board to feed (block) | Baseline to novel object | 0.06 ± 0.04 | 0.01 | 0.99 | 0.12 |
| Latency to board (block, time) | Novel object | 0.30 ± 0.11 | 115 | <0.0001 | 0.50 |
| Board to feed (block, time, temperature) | Novel object | 0.14 ± 0.07 | 78.8 | <0.0001 | 0.24 |
| Latency to board (block, date, temperature) | Novel cue | 0.22 ± 0.08 | 69.7 | <0.0001 | 0.48 |
| Board to feed (sex) | Novel cue | 0.14 ± 0.07 | 36.7 | <0.0001 | 0.22 |
Models that included any significant among-individual covariates are indicated (for full results, see Supplementary Table S2).
From a likelihood ratio test of model with random intercept versus model with no random effects; all df = 1.
Calculated using the residual variance from models shown in Supplementary Table S1.
We tested for non-zero among-individual variance in slope with respect to trial number within each of the 3 contexts (baseline, novel object, and novel cue). All estimates were no different from 0 (Table 3); logBTF showed a marginally nonsignificant (P = 0.052, Table 3) variance in slope in the novel object trials. The only situation in which among-individual variation in slope existed was in the transition from baseline to the initial trial of each novel object (Figure 3a,b) and this existed for both latencies (Table 3). We assessed the covariance between individual slope and individual intercept when the intercept was defined as the baseline condition. This provided a test of whether individuals who were quicker to arrive at the board and to feed in the baseline condition were likely to change their behavior more (or less) in response to the novel objects. For both latencies, the covariance between the change in behavior to the novel object (slope) and the average behavior in the baseline condition (intercept) was negative, small and not significantly different from 0 (LTB = −0.054 ± 0.07, Z = 0.77, P = 0.44; BTF = −0.011 ± 0.046, Z = 0.24, P = 0.81), indicating no link between behavior in the baseline condition and response to the novel object.
Among-individual variation in slope with respect to number of previous trials or trial type for 2 response traits and within 4 contexts (from full models presented in Supplementary Table S2)
| Response | Context | Estimate ± SE | χ2 valuea | df | P value |
|---|---|---|---|---|---|
| Latency to board | Baseline | 0.006 ± 0.01 | 0.09 | 2 | 0.64 |
| Board to feed | Baseline | 0 | 1.3 | 2 | 0.52 |
| Latency to board | Baseline to novel object | 0.08 ± 0.04 | 11.4 | 2 | 0.003 |
| Board to feed | Baseline to novel object | 0.13 ± 0.07 | 7.6 | 2 | 0.02 |
| Latency to board | Novel object | 0.003 ± 0.005 | 0.8 | 2 | 0.67 |
| Board to feed | Novel object | 0.009 ± 0.007 | 5.9 | 2 | 0.052 |
| Latency to board | Novel cue | 0.003 ± 0.005 | 1.7 | 2 | 0.43 |
| Board to feed | Novel cue | 0.010 ± 0.009 | 4.2 | 2 | 0.12 |
From a likelihood ratio test.
Within-context covariances
A syndrome for responding to novelty might be revealed by several types of covariances. We predicted that the 2 latency measures would covary positively within individuals, at the least because of similar effects of trial order on behavior. We first tested this idea using a bivariate mixed model as outlined in equation 3 over all trials regardless of context. We found positive within-individual covariance (0.053 ± 0.019, Z = 2.8, P < 0.006; Supplementary Table S4). However, adding the number of previous trials to the model reduced the estimate to 0.03 ± 0.018 (Supplementary Table S5) and it became no different from 0 (Z = 1.7, P = 0.10), indicating the positive covariance was likely driven by joint plasticity with respect to repeated exposure to the novelty. Within-individual covariance between the 2 latency traits within each context separately also revealed little evidence for the 2 measures either reflecting a single trait or acting through a common mechanism (Table 4). Within each context, including number of previous trials in the model reduced the covariances slightly but did not alter significance (Supplementary Table S7).
Estimated within- and among-individual covariances and correlations, within a given context, between the latency of house sparrows to land on a feeding board and the latency from the board to feed as extracted from a multivariate mixed model with no covariates (as described in Dingemanse and Dochtermann 2013)
| Context | Level | Covariance estimate ± SE | Correlation | Z value | df | P value |
|---|---|---|---|---|---|---|
| Baseline | Within | 0.03 ± 0.03 | 0.09 | 0.84 | 1 | 0.40 |
| Baseline | Among | 0.03 ± 0.02 | 0.46 | 1.4 | 1 | 0.15 |
| Novel object | Within | −0.01 ± 0.02 | −0.03 | 0.43 | 1 | 0.66 |
| Novel object | Among | 0.13 ± 0.06 | 0.38 | 2.1 | 1 | 0.04 |
| Novel cue | Within | 0.04 ± 0.02 | 0.10 | 1.7 | 1 | 0.09 |
| Novel cue | Among | 0.08 ± 0.04 | 0.39 | 2.1 | 1 | 0.04 |
The most compelling test of syndrome structure is through among-individual covariances that occur if the value of a trait for an individual predicts the value of another trait. We first tested if individual means (intercepts) for the 2 latencies covaried among individuals within contexts (whether mean latency to the board predicted the latency to feed in the, e.g., novel object trials). We found significant among-individual covariance in 2 of the 3 contexts (Table 4). Although the baseline context had the highest correlation between mean values, this was not significant (Table 4), which is not surprising given the minimal among-individual variance in intercepts for the board to feed measure (Table 2). A test comparing a model with all covariances included and one with these three set to 0 revealed a highly significant effect (LRT, χ2 = 36.3, df = 3, P <0.0001). The 3 covariances explained 38–46% of the variance in intercepts but this accounted for just 7–20% of the variance in the 2 latencies within contexts.
Across-context covariances
If responses to different types of novelty reflect a general mechanism, then individual differences within contexts should covary with those expressed in other contexts. A response to novelty is best measured by slope, because neophobia, habituation, or discriminant learning are all measured as changes in behavior from one situation to another. Because we found few individual differences in slopes within contexts, it is not surprising that covariances between slopes were not significant and in many cases were not even estimable. Indeed a multivariate model with all 6 response-by-context combinations treated as separate traits did not converge when slopes with respect to trial order were included. A bivariate analysis that lumped each latency across all contexts did converge but covariances between the slope for one latency and the slope for the other were small and nonsignificant (see Supplementary Table S8) so we present here the tests of the within-trait, across-context, and among-individual covariances in intercepts. These estimate the extent of average behavior regardless of the form of novelty.
For latency to board (logLTB), all 3 covariances were between 0.1 and 0.2 producing high correlations (Figure 5a–c)); a comparison of a model containing the 3 cross-context covariances in this measure (baseline-novel object, baseline-novel cue, and novel object-novel cue) explained significantly more variation than one without (Log likelihood = −1591, χ2 = 51.4, df = 3, P < 0.0001). The covariances among contexts in latency from board to feed (log BTF) were smaller (Figure 5d–f) and did not explain more variance than a model lacking these covariances (Log likelihood = −1569, χ2 = 7.4, df = 3, P = 0.06).
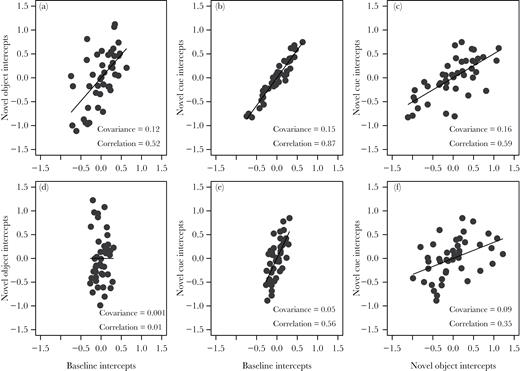
Within-trait but across context relationships between estimated individual intercepts (BLUP values) extracted from a multivariate mixed model of the 2 latencies across the 3 different novelty contexts. Intercept values are deviations from the population mean intercept at the first trial in each context. Although the models are not exactly the same, each intercept value for the novel object and novel cue context is similar to the values at trial 1 for each light gray line shown in Figure 4. Panels a–c are of latency to board and d–f of latency from board to feed. Relationships shown are between baseline and novel object (a and d), baseline and novel cue (b and e), and novel object and novel cue (c and f). Details of the model and complete results are presented in the Supplementary Material (Supplementary Table S7).
DISCUSSION
House sparrows, like many species, respond to several well-defined types of novelty in their environment. The subjects in our study exhibited neophobia, measured as an increase in the delay to approach and then feed near novel objects appearing suddenly near a traditional source of food. Our subjects also habituated to these neutral objects, indicated by a decline in both latencies over repeated exposure. Furthermore, individuals learned to discriminate a rewarded from nonrewarded novel cues, indicated by fewer errors and reduced latency from arriving at the board to finding food over repeated trials. Such responses are a regular feature of most animals that have been tested (e.g., Shettleworth 2001; Wasserman and Zentall 2006).
Our goal, however, was to assess how individual differences manifest within and across these contexts and, as a prelude to investigating the adaptiveness of such responses, whether mechanisms common to all kinds of novelty might influence their responses (Figure 1). We found a complex array of results that demand detailed explanation. First, we found significant among-individual variance in average behavior (i.e., reaction norm intercept) for both the latency to arrive at the board and the latency from arrival to feeding. Because these responses all occurred following a disturbance and both latencies exhibited a significant increase when novel objects were first introduced (indicating neophobia), they could be interpreted as individual differences in risk-taking or boldness. However, we found only weak evidence that the 2 latency measures covaried within individuals, which is surprising if both represent a general attribute affecting risk-taking. Männiste et al. (2013) uncovered a similar lack of covariance in 2 measures of activity in greenfinches (Carduelis chloris). These types of results suggest that each trait may be plastic to different environmental variables or perhaps affected by variables that changed quickly within the 1 h observation period. For example, latency to board may reflect the assessment of the individual about potential risk, such that once an individual determines that risk is low and actually lands on the board, other factors could be more influential in driving how long it takes to feed. Such factors could include search activity or cognitive abilities that influence the finding of food (Leimar 1997; Houston and McNamara 1999; Shettleworth 2001). Moreover, the weakest covariances in both response traits occurred between the novel object trials and both other types of trials (Figure 5). Thus, another possibility is that individual differences within context were due to differences in motivation, despite our efforts to control it by depriving all subjects in all trials the same amount of time and by including among-individual differences in conditions (date and temperature) in the initial models. It may be that the confluence of both personality and plasticity in boldness and in motivation produced individual differences in both latencies but little relationship between them.
Second, both response traits exhibited significant individual differences in neophobia, adding to a growing body of analogous findings within this species (Bókony et al. 2012; Ensminger and Westneat 2012) and in others (Echeverría and Vassallo 2008; Biondi et al. 2010; Mettke-Hofmann et al. 2013). Individual variation in slope was not, however accompanied by individual differences in intercepts, which is surprising given that significant variance in intercepts was found in both the baseline and novel object trials separately. If individual differences in average latency do indicate differences in boldness, then this result suggest no necessary linkage between boldness and neophobia, suggesting that house sparrows differ from some other species (e.g., Dammhahn and Almeling 2012). Individual responses to the presence of a novel object appear to increase the variation in behavior (Figures 3 and 5d), possibly making differences in intercept harder to detect due to our low sample size (see also Ensminger and Westneat 2012; van de Pol 2012). Alternatively, as previously mentioned, what we have considered to be “boldness” may in fact be differences in motivation to feed or possibly general activity levels that are evident in the baseline trials but which are then masked by differences in risk-taking when novel objects first appear. This latter explanation would suggest domain specific responses to the 2 contexts.
Third, individuals in our study exhibited significant cross-context covariances in latency to board but not latency from board to feed (Figure 5), with stronger correlations occurring between baseline and novel cue contexts for both latencies. This indicates there is a consistent difference, regardless of context, between individuals in their willingness to approach the food board after a brief disturbance. The latency from board to feed behaves differently, again suggesting that these 2 latencies reflect different traits. Whether latency to board is a manifestation of boldness or motivation, it appears to be the only attribute we measured to show consistent individual differences across all the contexts.
Finally, we found no evidence of individual differences in learning (i.e., reaction norm slope) in the 2 learning contexts (repeated exposure to novel objects or to novel cues). Hence, we find no evidence of a novelty syndrome and considerable evidence of context- and even trial-specific behavior. Others have found evidence for an inverse link between neophobia and ability to solve a novel problem across species (e.g., Webster and Lefebvre 2001) and also within a species (e.g., Biondi et al. 2010). Martin and Fitzgerald (2005) found a population-level difference in reaction to novel foods but not novel objects in house sparrows. However, no study has explicitly measured these at the among-individual level. Although plasticity may drive some correlations between behaviors if analyzed at the within-individual level, a syndrome is defined as a link between behaviors that is intrinsic to the individual and so explains across context correlations among individuals.
Thus, our findings combine to reveal little support for a general underlying mechanism for dealing with novelty and instead suggests domain specificity. It is important to note that this conclusion is based on the lack of significance in multiple tests of variance in slopes. Usually, there are problems in making inferences from not rejecting the null hypothesis of no effect, especially when sample sizes are modest as in this study. Because many of these tests focus on random effects (individual slope terms) known to require large sample sizes to achieve decent statistical power (Martin et al. 2011, van de Pol 2012, Dingemanse and Dochtermann 2013), we could be making a Type II error by over-interpreting nonsignificant results. We thus cannot say that there are no individual differences in slope. However, the main reason for poor power is the large residual variance in responses, occurring within individuals, which was often over 50% of the variance (see also Bell et al. 2009). It is important to understand the source of this residual variance (Westneat et al. 2015). If high residual variance was due to measurement error, then any conclusions about domain specificity would be in serious jeopardy. However, both of our variables are timing variables extracted from video observations in which there is little ambiguity about their scoring. Measurement error due to scoring videos was low and observer score repeatability was 0.99. Thus, the residual variance must come from variance in the true response of the subjects, which by definition must be due to plasticity, presumably in response to unmeasured variables. Hence the high residual variation is itself evidence of domain specificity, that is, from trial to trial, differences in uncontrolled environmental variables appear to affect responses to novelty. Although we cannot say that there is no link between different responses to novelty, our results suggest domain generality is not a particularly important element of these responses.
Our finding of weak individual differences in response to novelty in house sparrows joins evidence from several other sources to suggest that plasticity to multiple environmental factors (multidimensional plasticity, Westneat et al. 2009, 2011) may be a dominant mechanism for responding to unfamiliar environmental change. House sparrows in our study adjusted to the different forms of novelty that we presented them, but also varied with both measured variables (time of day and temperature) and, apparently, a suite of unmeasured environmental variables. Others have found similar results in a variety of situations. For example, Vincze et al. (2016) found that house sparrows habituate faster in urban environments than in rural. Brown et al. (2013) found that wild-caught cichlid fish and frog tadpoles exhibit greater neophobia to a novel cue in the presence of a predator than in control conditions, indicating a specific case of multidimensional plasticity to novelty. In laboratory rats, the extent of habituation to the test arena influenced the level of neophobia to a novel taste cue (Mitchell et al. 1980), also indicating multiple environmental influences on neophobia. Neophobia also is influenced by developmental conditions (Fox and Millam 2004). Thus as several have indicated (e.g., Mettke-Hofmann 2007; Carter et al. 2012, Greggor et al. 2015), responses to novelty are often context-specific. This is precisely what a functional view of novelty, as outlined in Figure 1, would predict. Because neophobia to an irrelevant object per se is a nonadaptive response, we would expect organisms to have complex mechanisms for distinguishing types of novelty.
Multidimensional plasticity in the face of novelty as opposed to a novelty syndrome is likely to depend on a suite of selective agents that are presently difficult to discern. Neophobia might be favored when multiple types of predators exist, as suggested in fish and frogs by Brown et al. (2013). Neophobia to irrelevant objects is costly and so selection should favor quick assessment and speedy habituation. In addition, neophobia to beneficial cues could inhibit associative learning. The sparrows in the present study treated a whole board filled with novel colored lids no differently than they did the baseline condition (Figure 5b, e), suggesting they quickly discerned that the change was not harmful. We might expect selection to have honed responses to be flexible to other sets of cues that might identify the appropriate context. Moreover, it is possible animals can categorize novelty hierarchically, and so may generalize some attributes but retain specificity for others (e.g., Greenberg and Mettke-Hofmann 2001). We expect this complexity also to be shaped in part by selection and produce varying levels of domain generality.
Our subjects revealed that the relatively simple act of coming to a feeding site and searching for food there under changing conditions apparently employs an array of separate behavioral mechanisms. These mechanisms appear to be adaptive, because sparrows in general may benefit by being neophobic, habituating, and learning new cues but may also benefit from flexibly separating them. Deconstructing seemingly simple behaviors to find those elements that are common and those that are unique across well-defined contexts of ecological relevance is likely the next step in understanding behavioral syndromes, their underlying mechanisms, and the selective forces shaping those mechanisms.
SUPPLEMENTARY MATERIAL
Supplementary data are available at Behavioral Ecology online.
FUNDING
Funding for this research was provided by the US National Science Foundation (IOS1257718) to D.F.W. and by the Gertrude F. Ribble Research Fund granted by the University of Kentucky to D.E.M.
The authors are grateful to A. Griggs, A. Emerson, and K. Tillman who helped to collect and score the videos. The authors thank B. Cloud, P. Crowley, J. Dillard, R. Fox, A. Mutzel, T. Salzman, C. Sargent, K. Sasser, J. Wright, and T. Zentall for conceptual discussions and comments on the manuscript. Two anonymous reviewers provided many helpful suggestions.
Data accessibility: Analyses reported in this article can be reproduced using the data provided by Moldoff and Westneat 2017.
REFERENCES
Author notes
Address correspondence to D. F. Westneat. E-mail: david.westneat@uky.edu.
Handling editor: Shinichi Nakagawa
